

Briefly: In our opinion speculative short positions (full) in gold and mining stocks are currently justified from the risk/reward point of view and the same goes for speculative short positions (half) in silver.
In fact, there are quite a few bearish indications that suggest that lower precious metals prices are just around the corner. Let’s take a look at a few of them (charts courtesy of http://stockcharts.com).
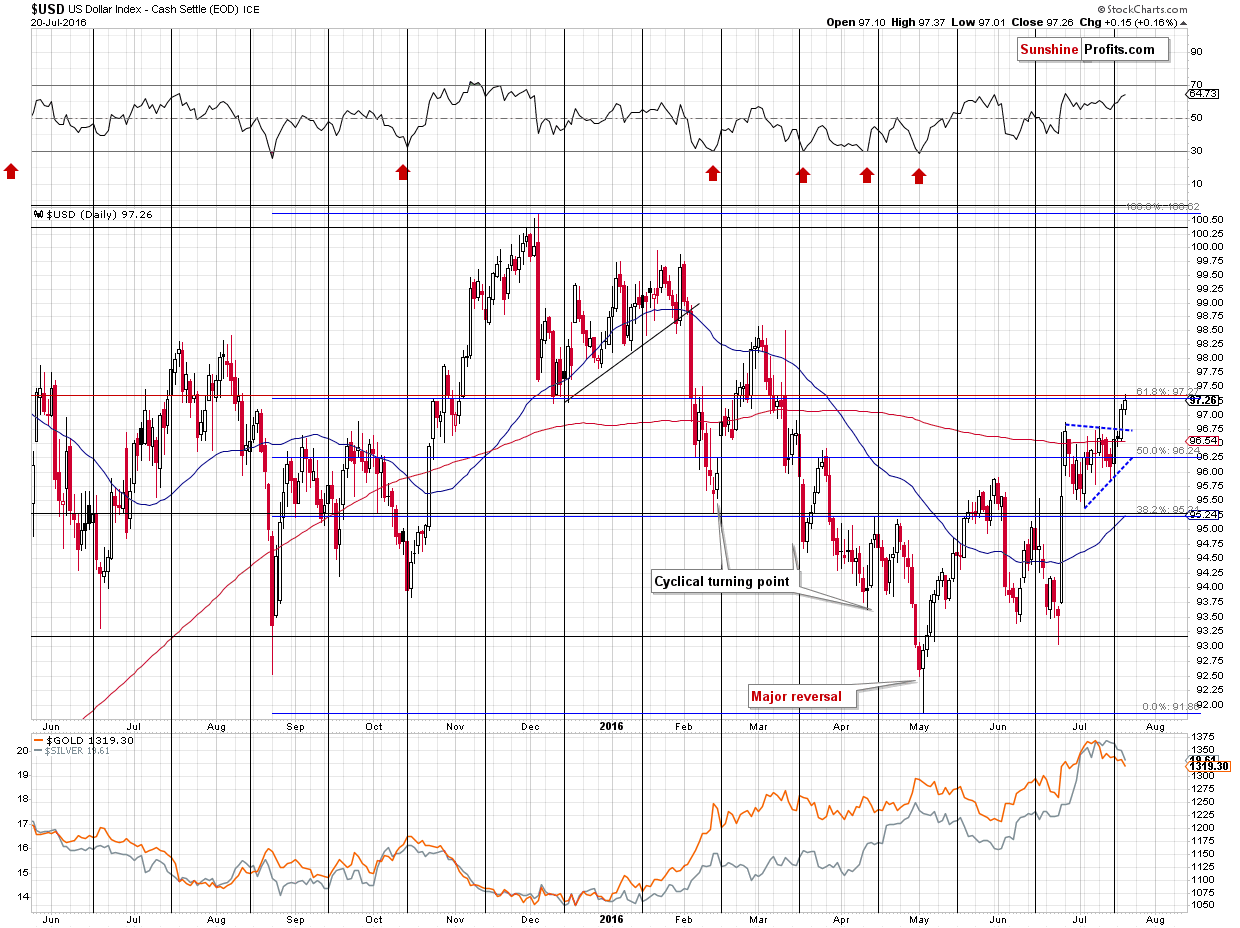
First of all, the USD Index broke above the triangle consolidation pattern and the breakout is almost confirmed (or confirmed, depending on the approach – some suggest waiting for 2 closes above a certain level and some prefer 3 closes; in the case of the precious metals market we found the 3-day rule to be more useful, but it’s not as clear in the case of currency markets). That’s bearish news for the precious metals sector, because (with local exceptions, like the Brexit vote) PMs tend to move in the opposite way to the USD Index.
In yesterday’s alert we wrote the following:
(…) The USD has been consolidating for about 3 weeks – definitely enough to cool down the previous – post-Brexit-vote emotions, so the consolidation can end any day now – perhaps even later today as only a little additional move higher is necessary.
The cyclical turning point was last Friday and the USD Index indeed turned around and rallied on this day, thus increasing the odds for a rally’s continuation.
The implications for the USD Index are bullish as the move that follows a breakout tends to be similar (mostly in terms of price, but often also in terms of time) to the moves that preceded the consolidation. The move that preceded the consolidation this time was a rally from about 93 to about 96.5 – a 3.5 move. Starting an analogous move from the bottom of the triangle pattern (about 95.5 in early July) provides 99 as the next target.
Consequently, the implications of the current situation are bullish for the USD Index and bearish for the precious metals sector (which tends to move in the opposite way to the U.S. dollar; the Brexit case was an exception from this rule) and they will be much more bullish (USD) and bearish (precious metals) in case the breakout above the triangle pattern is confirmed.
Let’s keep in mind that 99 is only an initial target.
The USD Index indeed broke higher and closed visibly above the 97 level - clearly above the mentioned resistance at 96.75.
Now, the breakout didn’t result in a big plunge in the precious metals sector, but the reason could be that the breakout is not confirmed yet – the move is seen as something temporary by traders and investors. Consequently, it could simply be the case that the metals’ and miners’ reaction is delayed, not absent.
A few hours after writing the above gold and silver indeed plunged – most likely as traders started viewing the breakout in the USD Index as confirmed. At the moment of writing these words, the USD remains above 96.75 (it moved to 96.88, though), so the breakout was not invalidated.
The upper border of the triangle consolidation pattern is not the only resistance that’s in play, though. The USD Index moved to the 61.8% Fibonacci retracement based on the December – May decline, which is also an important resistance level. Consequently, a day or a few days of consolidation will not be surprising. Still, 99 remains to be the initial upside target for the USD Index.
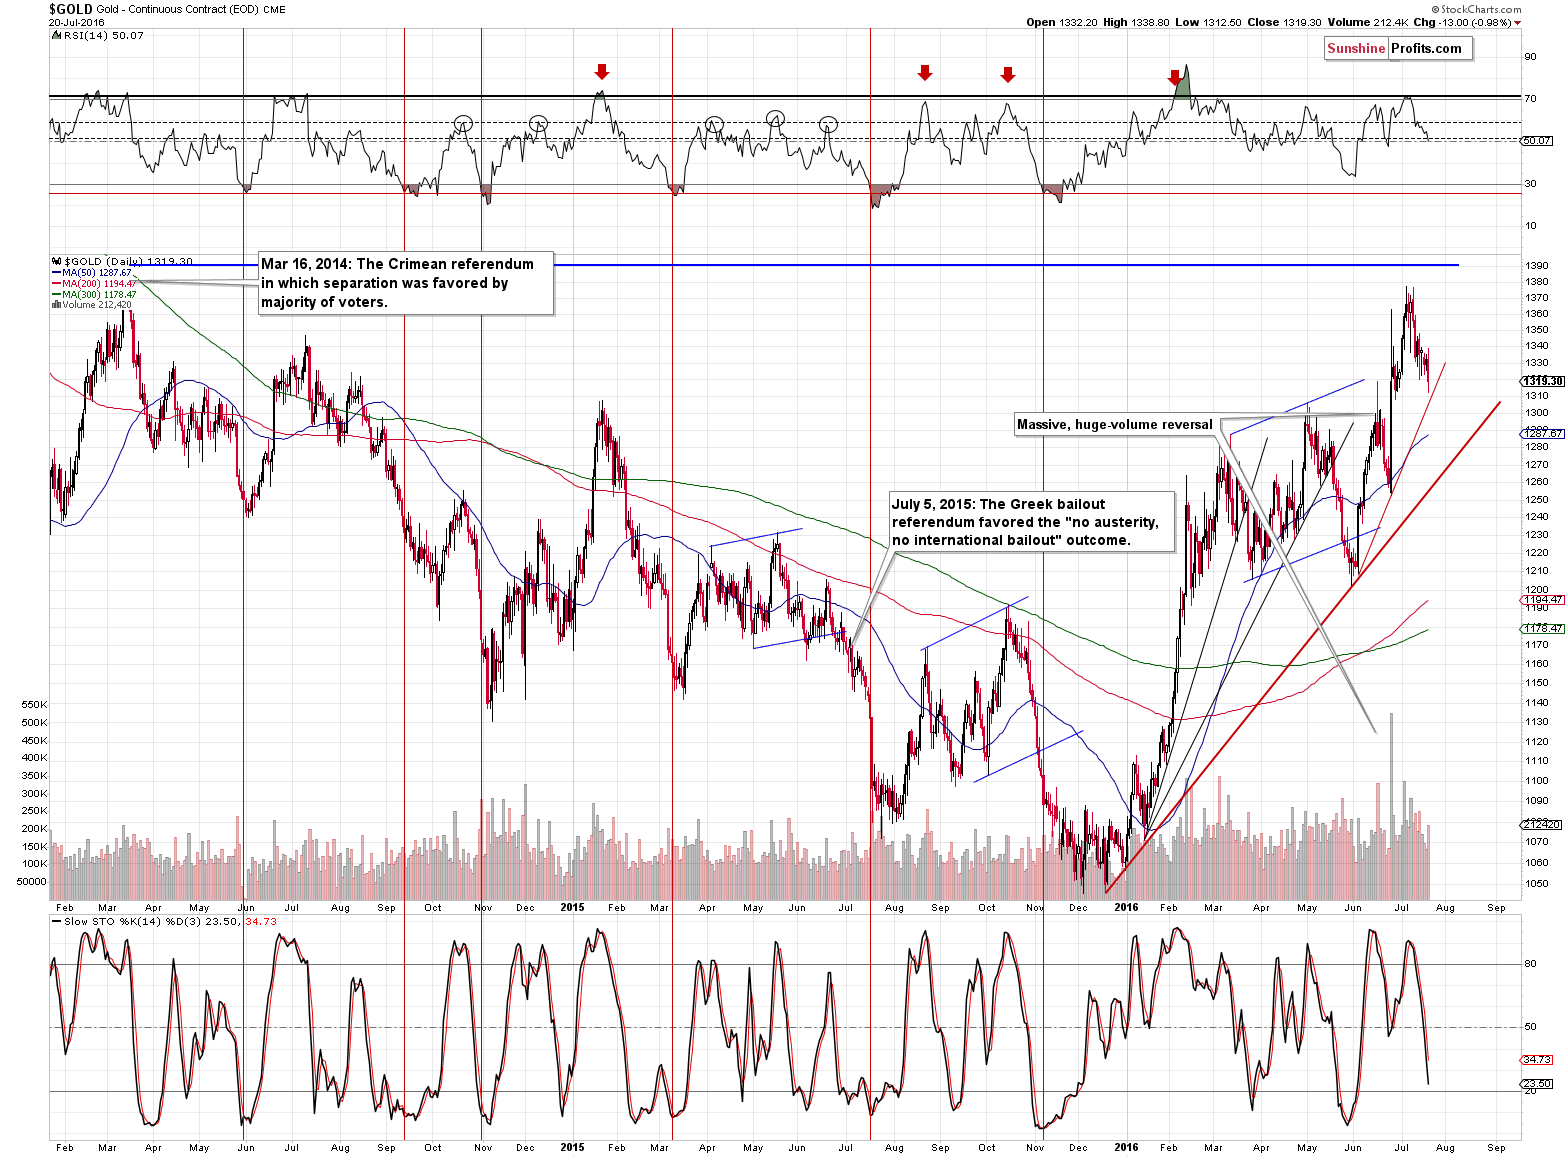
Gold declined on volume that was big on a relative basis (compared to the last few days) and it is clear that the breakout above the post-Brexit high is invalidated. The implications are bearish.
Why didn’t gold decline more? Most likely due to the mentioned technical resistance in the USD Index and the rising support lines in gold itself. Still, given the breakout in the USD, it’s likely that gold will follow and break down in analogy.
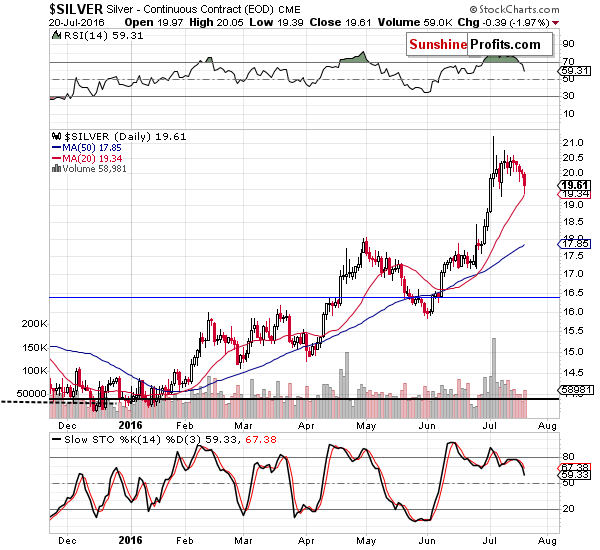
As far as silver is concerned, the white metal also moved lower on higher volume, but the more important volume reading was seen at the beginning of the month, when silver soared on an intra-day basis, only to slide later on. Then silver had an additional short-term run-up and it’s now declining, moving to its 20-day moving average. The situation is very similar to what happened in late April and in the first half of May. Back then silver also had a huge-volume reversal, followed by a short-term run-up and subsequent decline. What can we infer from this similarity? That silver could spend a few days moving close to the 20-day moving average, just like it did in mid-May. The decline is likely to continue either after such small a consolidation or right away.
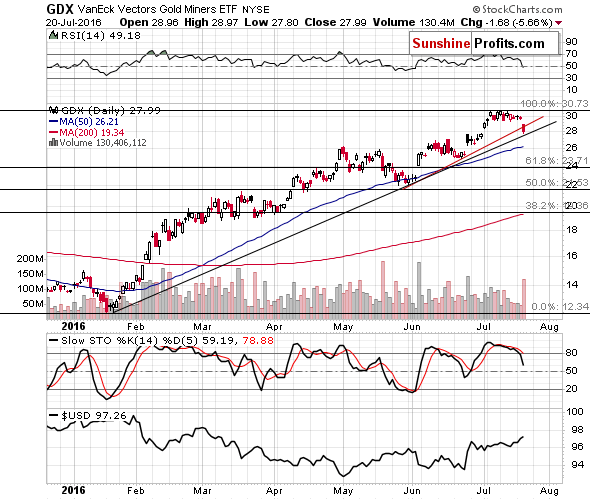
Similarly to what happened in the USD Index, the mining stocks broke below one support level, but didn’t break below the lower one yet. However, the size of the volume was huge, which is an important bearish factor. What’s also bearish is the fact that miners moved decisively below the most recent trading range – in the case of the previous huge-volume declines that we saw earlier this year, miners remained within the trading range after the huge-volume slide (for instance in late March and in mid-May). Consequently, we can speak of a specific breakdown that has already happened.
Summing up, there are quite a few bearish signals for the precious metals market alone but there are very important ones just outside of the sector – the situation in the USD Index is likely to have significant impact on the prices of PMs and it’s likely to be negative (and the likelihood of that happening increased based on this week’s breakout). Once the short-term consolidation in the USD is over and the breakouts (above both the triangle and the 61.8% Fibonacci retracement) are confirmed, we are likely to see another sizable upswing in the latter, which is likely to correspond to a decline in gold, silver and mining stocks.
Finally, we would like to stress that the long-term outlook for the precious metals sector is positive due to the positive fundamental situation as far as the very long-term uptrend is concerned, but in the short- and medium-term the market can move lower despite a positive fundamental situation and what happened between 2011 and 2015 serves as a good example.
As always, we will keep you – our subscribers – updated.
To summarize:
Trading capital (supplementary part of the portfolio; our opinion): Short positions (full position) in gold and mining stocks are justified from the risk/reward perspective with the following entry prices, stop-loss orders and initial target price levels:
- Gold: initial target price: $1,006; stop-loss: $1,423, initial target price for the DGLD ETN: $86.30; stop-loss for the DGLD ETN $34.86
- Silver: initial target price: $12.13; stop-loss: $20.83, initial target price for the DSLV ETN: $65.88; stop-loss for the DSLV ETN $16.76
- Mining stocks (price levels for the GDX ETF): initial target price: $9.34; stop-loss: $32.27, initial target price for the DUST ETF: $47.90; stop-loss for the DUST ETF $4.67
In case one wants to bet on junior mining stocks' prices (we do not suggest doing so – we think senior mining stocks are more predictable in the case of short-term trades – if one wants to do it anyway, we provide the details), here are the stop-loss details and initial target prices:
- GDXJ ETF: initial target price: $14.13; stop-loss: $54.43
- JDST ETF: initial target price: $61.74; stop-loss: $3.73
Long-term capital (core part of the portfolio; our opinion): No positions
Insurance capital (core part of the portfolio; our opinion): Full position
Plus, you might want to read why our stop-loss orders are usually relatively far from the current price.
Please note that a full position doesn’t mean using all of the capital for a given trade. You will find details on our thoughts on gold portfolio structuring in the Key Insights section on our website.
As a reminder – “initial target price” means exactly that – an “initial” one, it’s not a price level at which we suggest closing positions. If this becomes the case (like it did in the previous trade) we will refer to these levels as levels of exit orders (exactly as we’ve done previously). Stop-loss levels, however, are naturally not “initial”, but something that, in our opinion, might be entered as an order.
Since it is impossible to synchronize target prices and stop-loss levels for all the ETFs and ETNs with the main markets that we provide these levels for (gold, silver and mining stocks – the GDX ETF), the stop-loss levels and target prices for other ETNs and ETF (among other: UGLD, DGLD, USLV, DSLV, NUGT, DUST, JNUG, JDST) are provided as supplementary, and not as “final”. This means that if a stop-loss or a target level is reached for any of the “additional instruments” (DGLD for instance), but not for the “main instrument” (gold in this case), we will view positions in both gold and DGLD as still open and the stop-loss for DGLD would have to be moved lower. On the other hand, if gold moves to a stop-loss level but DGLD doesn’t, then we will view both positions (in gold and DGLD) as closed. In other words, since it’s not possible to be 100% certain that each related instrument moves to a given level when the underlying instrument does, we can’t provide levels that would be binding. The levels that we do provide are our best estimate of the levels that will correspond to the levels in the underlying assets, but it will be the underlying assets that one will need to focus on regarding the signs pointing to closing a given position or keeping it open. We might adjust the levels in the “additional instruments” without adjusting the levels in the “main instruments”, which will simply mean that we have improved our estimation of these levels, not that we changed our outlook on the markets. We are already working on a tool that would update these levels on a daily basis for the most popular ETFs, ETNs and individual mining stocks.
Our preferred ways to invest in and to trade gold along with the reasoning can be found in the how to buy gold section. Additionally, our preferred ETFs and ETNs can be found in our Gold & Silver ETF Ranking.
As always, we'll keep you - our subscribers - updated should our views on the market change. We will continue to send out Gold & Silver Trading Alerts on each trading day and we will send additional Alerts whenever appropriate.
The trading position presented above is the netted version of positions based on subjective signals (opinion) from your Editor, and the Tools and Indicators.
As a reminder, Gold & Silver Trading Alerts are posted before or on each trading day (we usually post them before the opening bell, but we don't promise doing that each day). If there's anything urgent, we will send you an additional small alert before posting the main one.
=====
Latest Free Trading Alerts:
Yesterday, the price of gold hit a three-week low. What does it imply for the gold market?
Gold Declines On Rising Interest Rate Expectations
S&P 500 index extends its rally as it gets closer to 2,200 mark. Will the uptrend accelerate? Or is this some topping action before uptrend reversal? Is holding short position justified?
Stock Trading Alert: S&P 500 At New All-Time High - Will It Continue Higher?
=====
Hand-picked precious-metals-related links:
Citigroup’s Willem Buiter Says He ‘Would Hold Gold’
US elections to give gold prices fresh boost despite roadblocks — analysts
'Why Is The Fed Manipulating Rates In The First Place?' - Steve Forbes
=====
In other news:
ECB facing gathering storm clouds but will hold fire for now
Draghi May Flag Action Ahead for ECB Under Brexit’s Shadow
Japan's $190 billion stimulus: 'double your money' but less than meets the eye
Europe Stocks Slide as Kuroda Says No Need for Helicopter Money
Red-hot Dow rises for 9th day in a row
C.E.O.s Meet in Secret Over the Sorry State of Public Companies
HSBC Bank Executives Face Charges in $3.5 Billion Currency Case
=====
Thank you.
Sincerely,
Przemyslaw Radomski, CFA
Founder, Editor-in-chief, Gold & Silver Fund Manager
Gold & Silver Trading Alerts
Forex Trading Alerts
Oil Investment Updates
Oil Trading Alerts

