

Briefly: In our opinion speculative short positions (full) in gold and mining stocks are currently justified from the risk/reward point of view.
Gold declined yesterday as stocks soared and despite an intraday move lower in the USD Index. The latter was reversed and then gold declined even further. What can we infer from the above?
That we have a good indication that the gold-USD link is moving back to normal – gold moves in the opposite way to the USD Index. Moreover, it underperformed the USD yesterday by initially declining along with it. The implications of this move are bearish, especially that gold managed to close well below the post-Brexit-hype top for the second day. Let’s take a closer look (charts courtesy of http://stockcharts.com).
In yesterday’s alert we wrote the following:
Gold declined yesterday and it moved back below the Brexit-hype top (and closed below it), but what’s happening today is even more important. Today, gold moved a bit lower, which isn’t significant on its own, but gold moved lower despite a decline in the USD Index. It could be a sign that gold-USD link is moving back to normal, which would have bearish implications for gold due to the bullish outlook for the USD Index.
The key question, naturally, is if the final bottom for the precious metals sector is already in. Naturally, it is possible, however, there are many factors pointing otherwise - the most important are the situation in the USD Index and the fact that we have extreme optimism among gold investors right now and we didn’t have extreme pessimism when gold was at $1,050.
We'd say the latter is the factor pointing to prices lower than $1,200 and lower than $1,050. However, we remain open-minded regarding a change in the outlook. Gold could move to $1,200 or so and then rally and we'd be looking at gold's reaction toward the action in the USD Index and the way mining stocks were responding to such a decline. If, for instance, the USD Index keeps rallying in a major way (moving closer to 100 / exceeding this level), but gold refuses to decline, it would indicate that we may not see a new low this year. The final bottom could form later than in September - perhaps this winter due to the recent rallies based on NIRP comments and Brexit. As far as gold supply is concerned, this doesn't have to impact the market in the short or medium run. That's a positive factor for the long run, but the fundamental situation has been favorable for the long run for years and gold has rallied only this year.
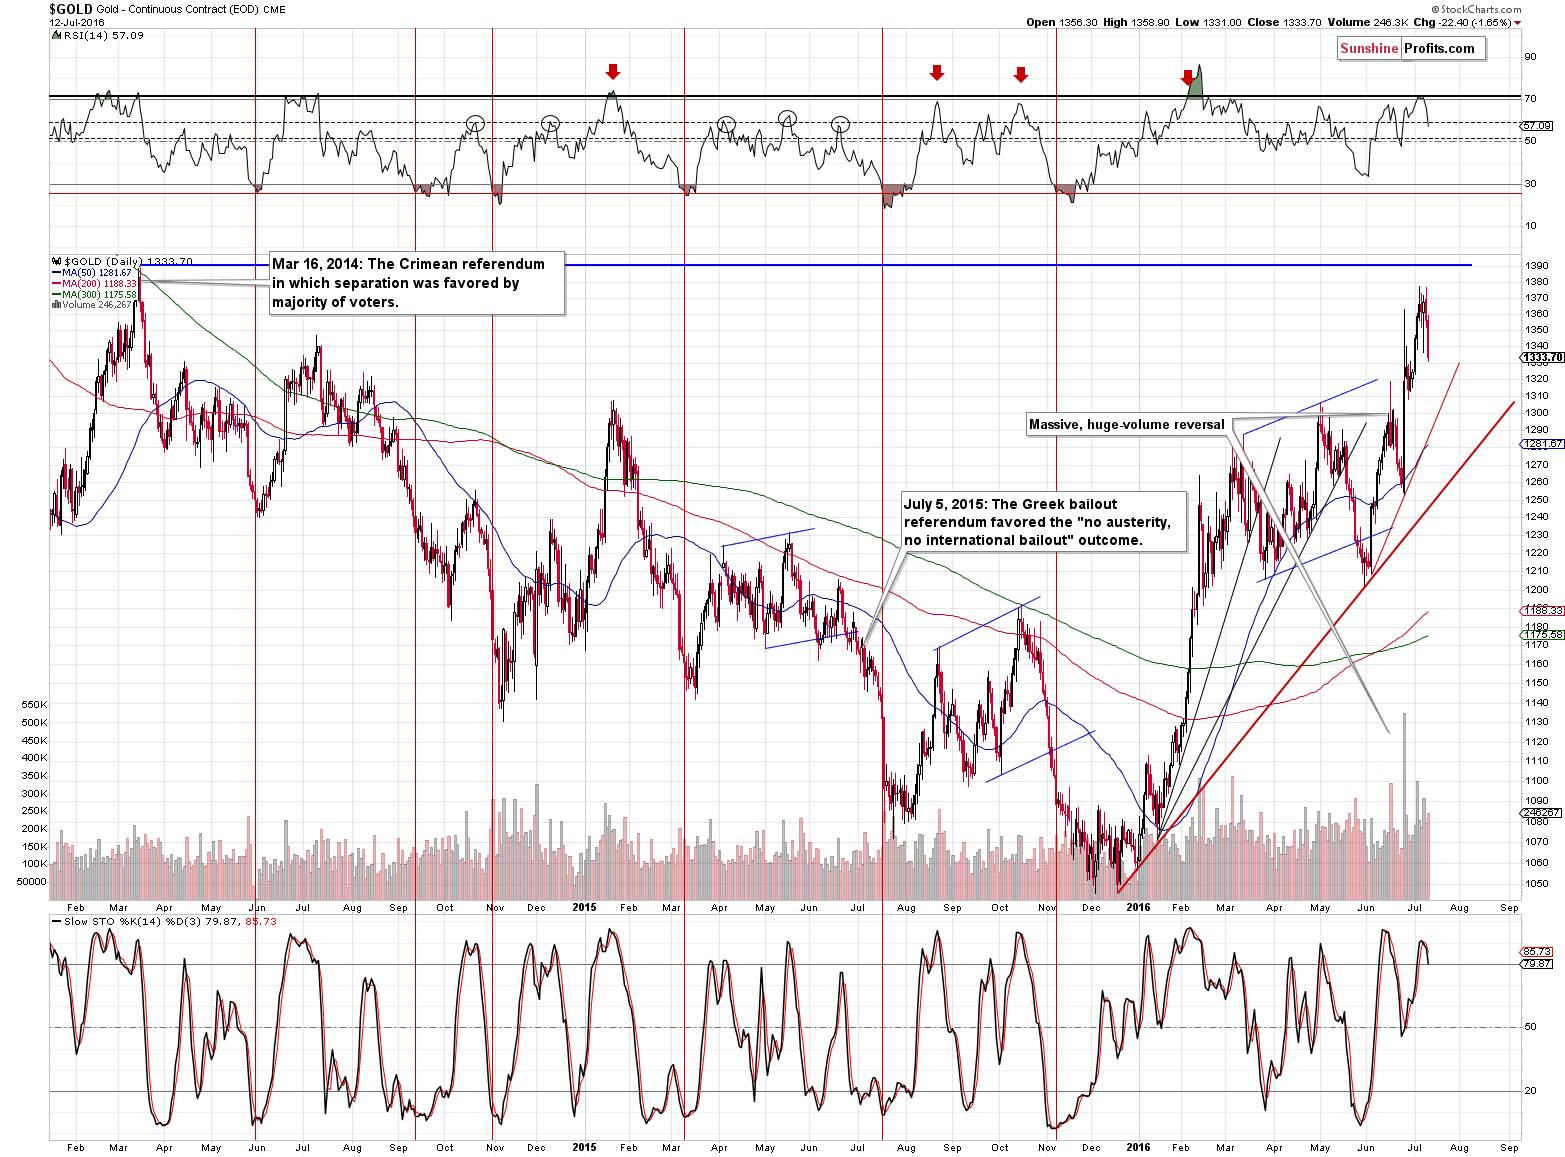
The above remains up-to-date and it provides the answer to the question from the title of today’s alert – the decline is most likely more than just a pullback and if it isn’t, then a bigger decline will likely follow shortly anyway. Still, even if this was just a pullback, then gold is likely to continue to decline anyway, as the support levels provided by rising lines are not very close yet. The first support is at about $1,300 and the second one at about $1,250 - $1,260, depending on when it is reached.
Once gold breaks below the lower of the rising red support lines, the decline will likely accelerate as more traders will become convinced that lower gold prices are to be expected.
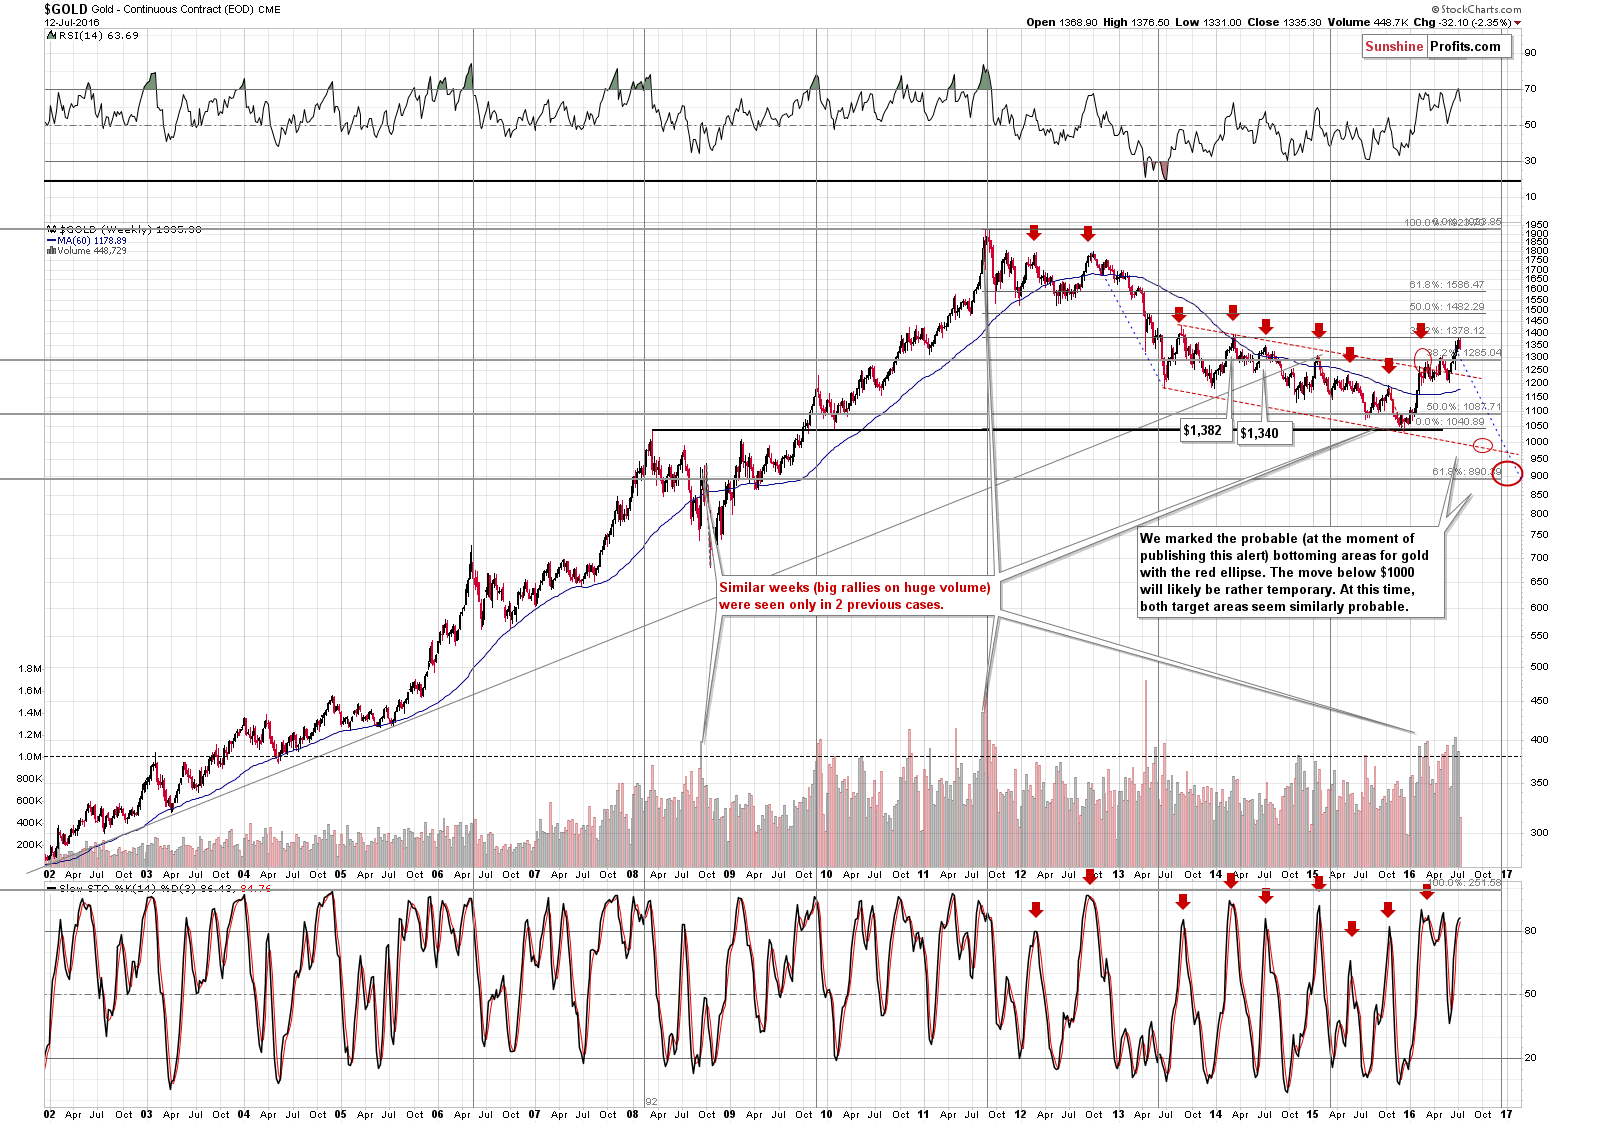
From the long-term point of view, we also see that gold’s move lower has been very small so far. Still, it is a move lower that started once gold moved to its 38.2% Fibonacci retracement level and a decline that starts from such an important level is likely to be more visible than what we’ve seen so far. Besides, in analogy to 1982 / 1983, even the initial part of the decline was much bigger than what we’ve seen so far.
Silver didn’t decline significantly yesterday, most likely because it got a boost from the rising stock market (silver and miners are more correlated with stocks than gold is). We expect this impact to either reverse (more likely) as stocks slide or wear off (less likely) if stocks continue to rally. After all, the impact that stocks can have on parts of the precious metals market can only be limited and relatively temporary. The same is likely to be the case with mining stocks.
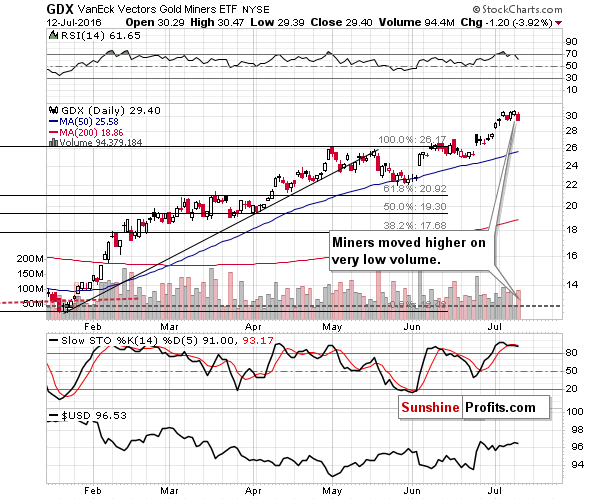
Gold mining stocks and silver mining stocks declined on volume that was much bigger than Friday’s volume, which serves as a bearish confirmation.
Summing up, gold’s underperformance relative to the USD Index is a bearish sign and it seems that what we saw yesterday could be a beginning of the final big decline in the precious metals market. Once gold breaks through its rising support lines, more traders are likely to become convinced that the rally is over and the slide will likely accelerate.
As always, we will keep you – our subscribers – updated.
To summarize:
Trading capital (supplementary part of the portfolio; our opinion): Short positions (full position) in gold and mining stocks are justified from the risk/reward perspective with the following entry prices, stop-loss orders and initial target price levels:
- Gold: initial target price: $1,006; stop-loss: $1,423, initial target price for the DGLD ETN: $86.30; stop-loss for the DGLD ETN $34.86
- Silver: No position at this time
- Mining stocks (price levels for the GDX ETF): initial target price: $9.34; stop-loss: $32.27, initial target price for the DUST ETF: $47.90; stop-loss for the DUST ETF $4.67
In case one wants to bet on junior mining stocks' prices (we do not suggest doing so – we think senior mining stocks are more predictable in the case of short-term trades – if one wants to do it anyway, we provide the details), here are the stop-loss details and initial target prices:
- GDXJ ETF: initial target price: $14.13; stop-loss: $54.43
- JDST ETF: initial target price: $61.74; stop-loss: $3.73
Long-term capital (core part of the portfolio; our opinion): No positions
Insurance capital (core part of the portfolio; our opinion): Full position
Plus, you might want to read why our stop-loss orders are usually relatively far from the current price.
Please note that a full position doesn’t mean using all of the capital for a given trade. You will find details on our thoughts on gold portfolio structuring in the Key Insights section on our website.
As a reminder – “initial target price” means exactly that – an “initial” one, it’s not a price level at which we suggest closing positions. If this becomes the case (like it did in the previous trade) we will refer to these levels as levels of exit orders (exactly as we’ve done previously). Stop-loss levels, however, are naturally not “initial”, but something that, in our opinion, might be entered as an order.
Since it is impossible to synchronize target prices and stop-loss levels for all the ETFs and ETNs with the main markets that we provide these levels for (gold, silver and mining stocks – the GDX ETF), the stop-loss levels and target prices for other ETNs and ETF (among other: UGLD, DGLD, USLV, DSLV, NUGT, DUST, JNUG, JDST) are provided as supplementary, and not as “final”. This means that if a stop-loss or a target level is reached for any of the “additional instruments” (DGLD for instance), but not for the “main instrument” (gold in this case), we will view positions in both gold and DGLD as still open and the stop-loss for DGLD would have to be moved lower. On the other hand, if gold moves to a stop-loss level but DGLD doesn’t, then we will view both positions (in gold and DGLD) as closed. In other words, since it’s not possible to be 100% certain that each related instrument moves to a given level when the underlying instrument does, we can’t provide levels that would be binding. The levels that we do provide are our best estimate of the levels that will correspond to the levels in the underlying assets, but it will be the underlying assets that one will need to focus on regarding the signs pointing to closing a given position or keeping it open. We might adjust the levels in the “additional instruments” without adjusting the levels in the “main instruments”, which will simply mean that we have improved our estimation of these levels, not that we changed our outlook on the markets. We are already working on a tool that would update these levels on a daily basis for the most popular ETFs, ETNs and individual mining stocks.
Our preferred ways to invest in and to trade gold along with the reasoning can be found in the how to buy gold section. Additionally, our preferred ETFs and ETNs can be found in our Gold & Silver ETF Ranking.
As always, we'll keep you - our subscribers - updated should our views on the market change. We will continue to send out Gold & Silver Trading Alerts on each trading day and we will send additional Alerts whenever appropriate.
The trading position presented above is the netted version of positions based on subjective signals (opinion) from your Editor, and the Tools and Indicators.
As a reminder, Gold & Silver Trading Alerts are posted before or on each trading day (we usually post them before the opening bell, but we don't promise doing that each day). If there's anything urgent, we will send you an additional small alert before posting the main one.
=====
Latest Free Trading Alerts:
Bitcoin Trading Alert: Bitcoin Walking Thin Line
There was relatively little action following the halving of mining rewards. Is this a trading hint? We present our take in this alert.
=====
Hand-picked precious-metals-related links:
Opinion: Sorry, gold and silver lovers, the party’s almost over
Gold up slightly after dipping to near 2-week low
=====
In other news:
Prime Minister concludes visit to Ukraine
U.S. stock futures take breather after record run
=====
Thank you.
Sincerely,
Przemyslaw Radomski, CFA
Founder, Editor-in-chief, Gold & Silver Fund Manager
Gold & Silver Trading Alerts
Forex Trading Alerts
Oil Investment Updates
Oil Trading Alerts

