

Briefly: In our opinion speculative short positions (full) are currently justified from the risk/reward point of view.
The no-hike announcement and Brexit-related tensions contributed to big intraday action in last week’s trading of precious metals (mining stocks were not that affected, though). At the first sight, the action was bullish as gold closed the week higher, but there’s much more that needs to be analyzed before the final conclusions can be drawn.
One thing is the lack of positive action in mining stocks. Even when gold was rallying above $1,310 temporarily, miners didn’t really soar. They simply refuse to break out above the previous highs and that’s a very bearish sign that we’ve been seeing over and over again. Let’s examine the details (charts courtesy of http://stockcharts.com).
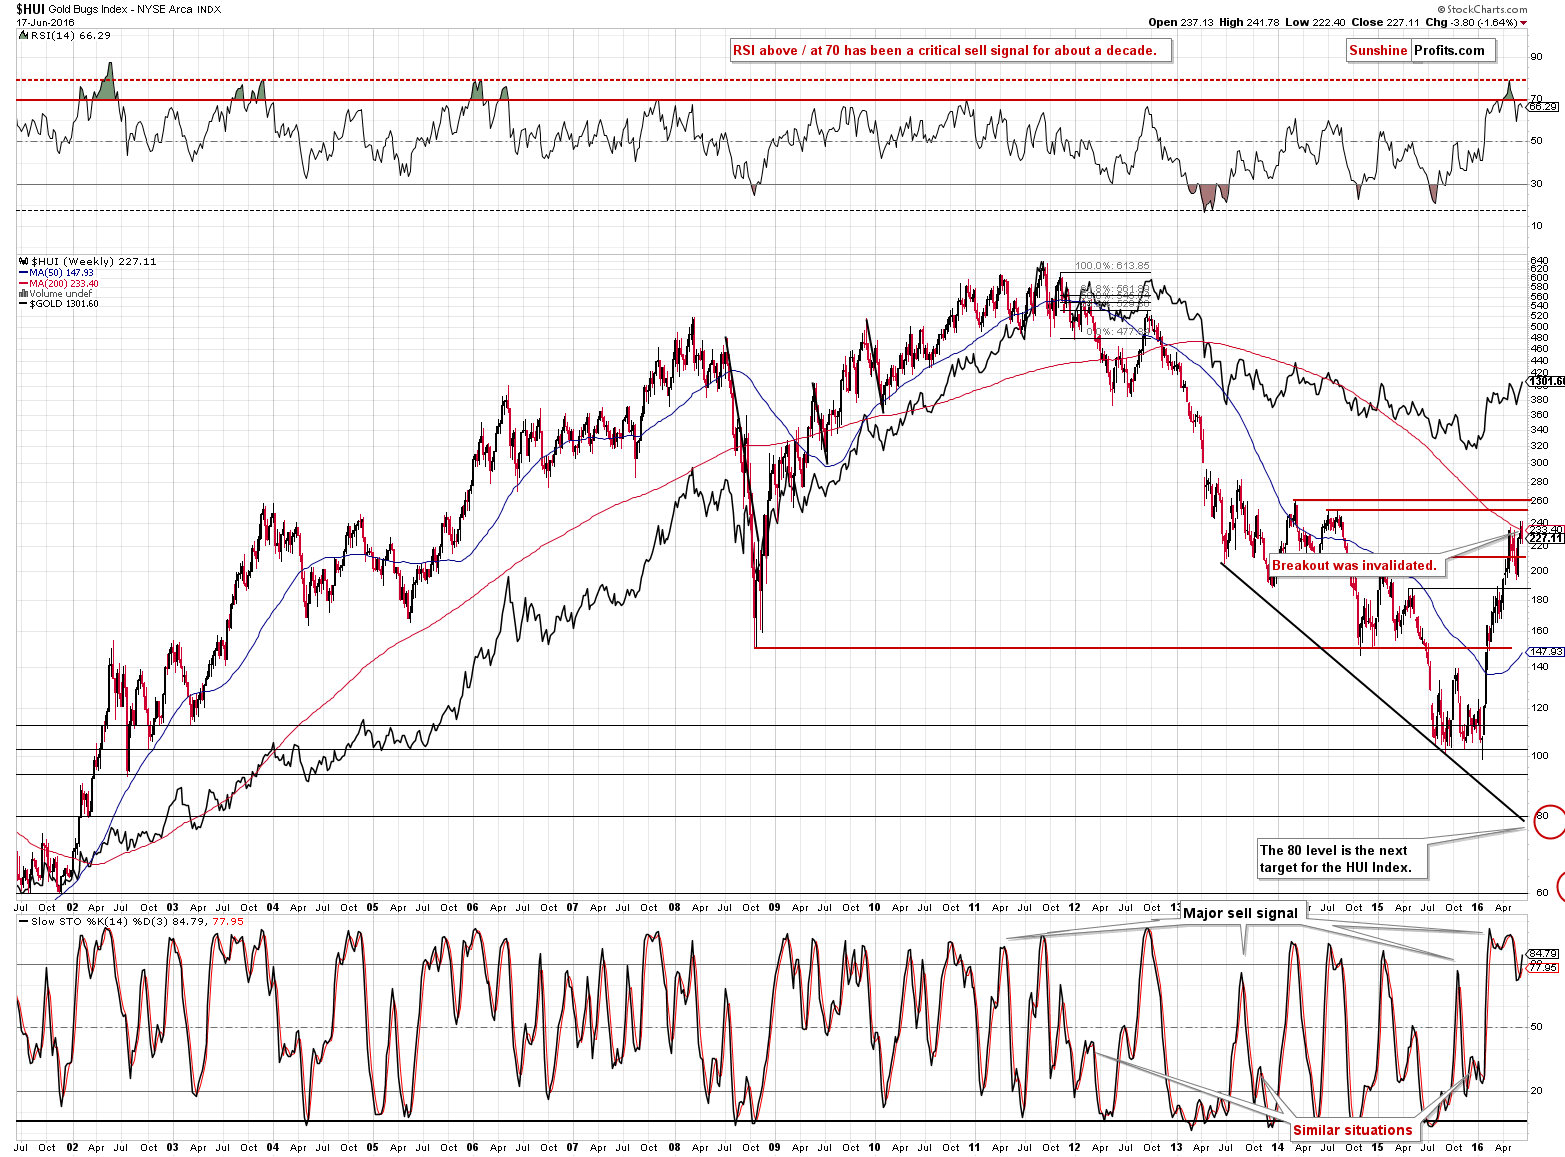
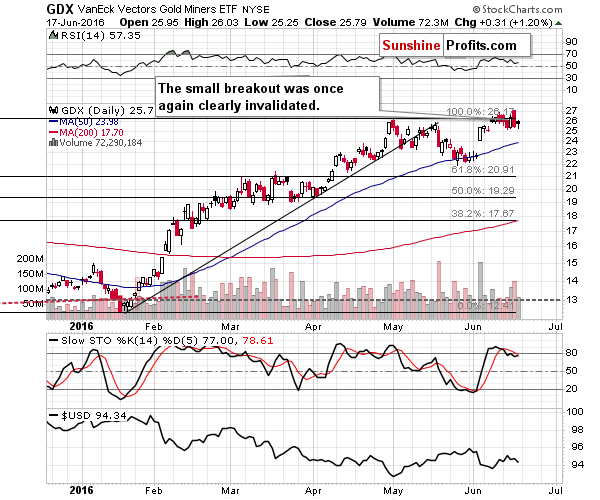
On both the long- and short-term basis, we can see that gold stocks remain very close to the previous 2015 highs, but there was no breakout above them. In case of the GDX ETF there was a tiny and unconfirmed breakout, but both the HUI and XAU Indices didn’t break out at all.
When the precious metals mining stocks are not making new highs, but gold does, it’s a sign that a top is being formed.
What about gold?
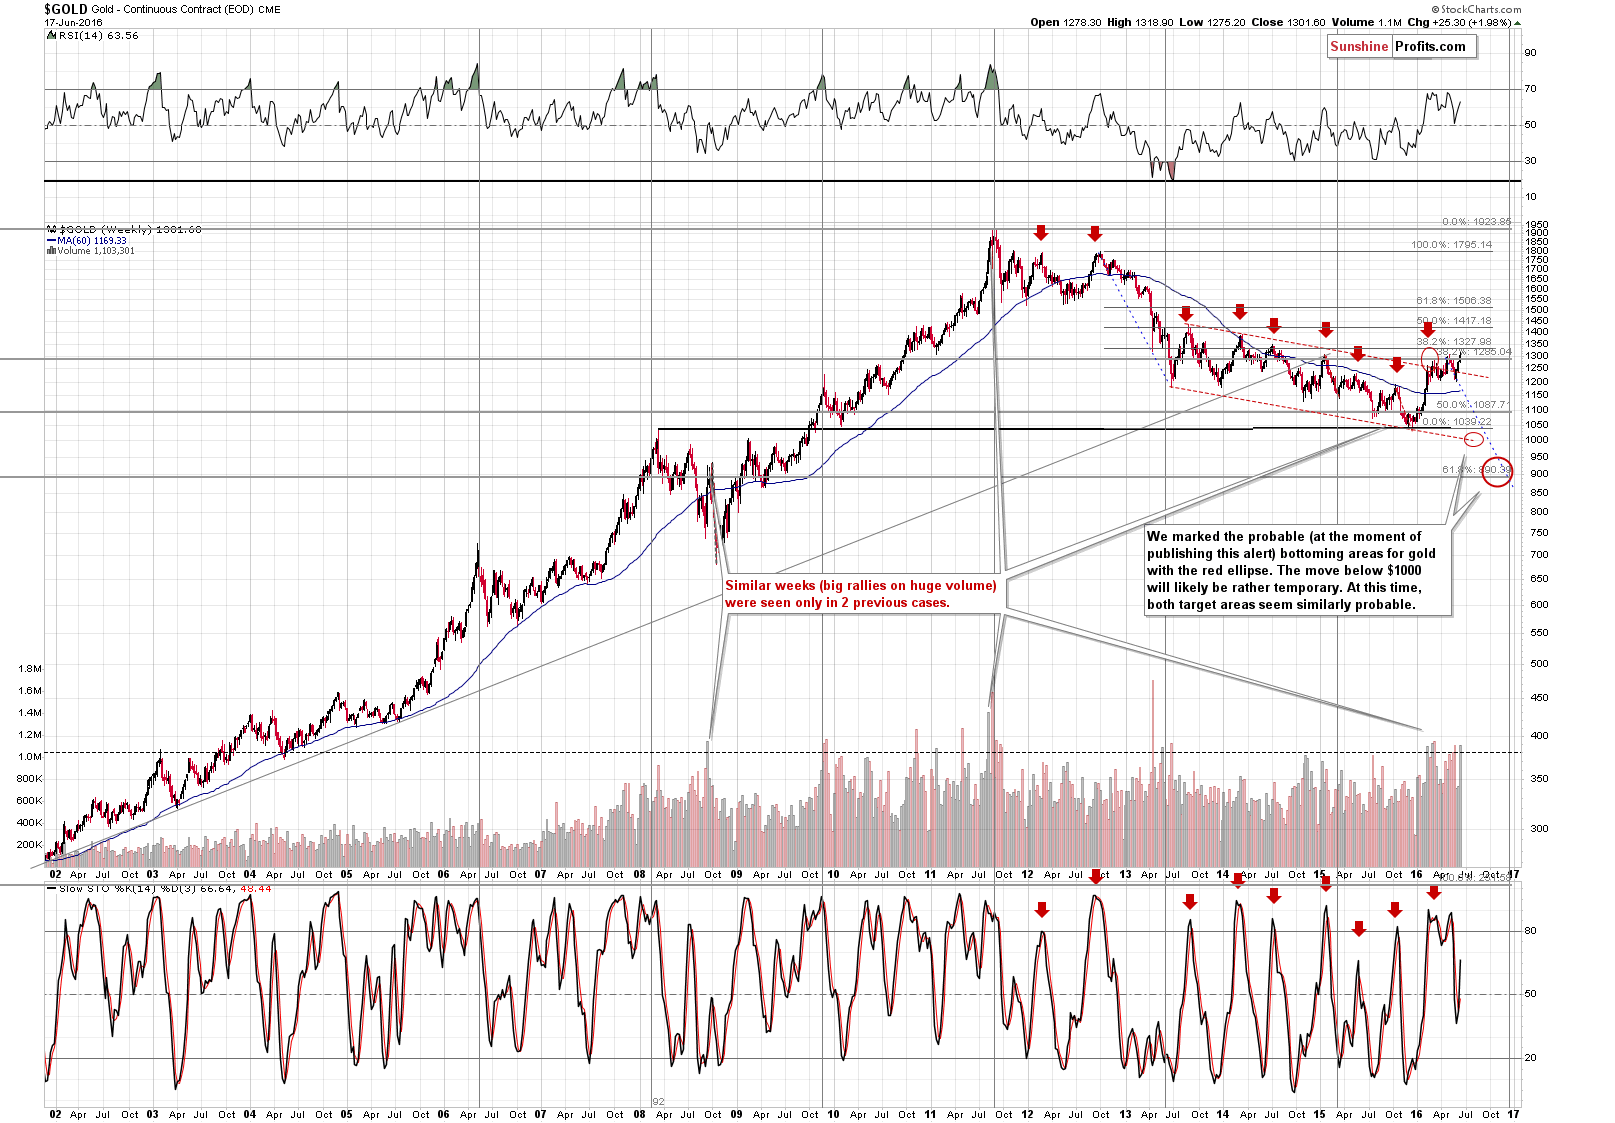
Gold closed the week higher, and in terms of daily closing prices, it closed about $1 below the highest close of 2015. There was no breakout and at the moment of writing these words, gold is after a $14 decline, which took it back below $1,290. The above chart also tells us that if gold confirms the breakout above the 2015 high, it is still not likely to rally far – the 2014 highs and the 38.2% Fibonacci retracement provide resistance.
Last week’s volume was big overall, but the daily chart below shows that it was due to the huge volume that accompanied Thursday’s major reversal.
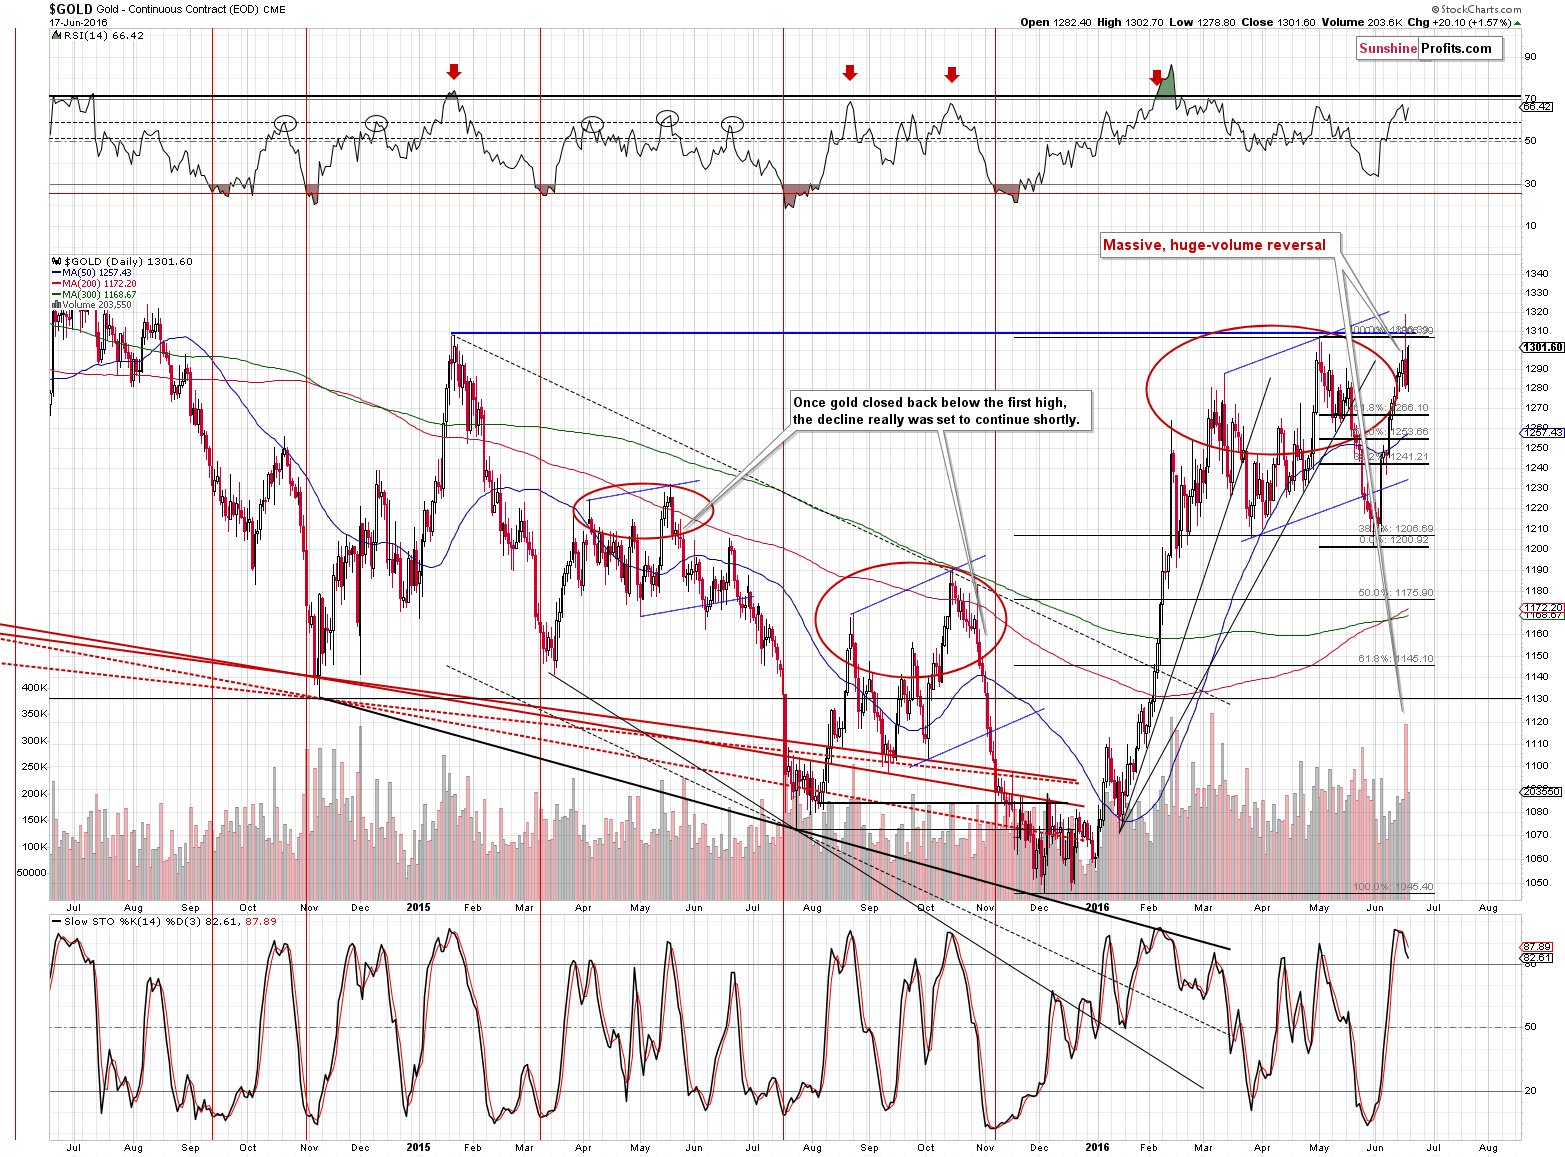
The rally that we saw on Friday took gold to new high (in terms of daily closing prices), but the volume that accompanied it wasn’t significant. Consequently, this move was not likely to be followed by much higher prices and in today’s pre-market trading we’re seeing the result – gold is significantly lower.
We would once again like to put the emphasis on the need to see a move’s verification as Thursday’s reversal serves as a great example. The session that appeared bullish became very bearish shortly.
Additionally, please note that we saw a sell signal from the Stochastic indicator even despite Friday’s upswing.
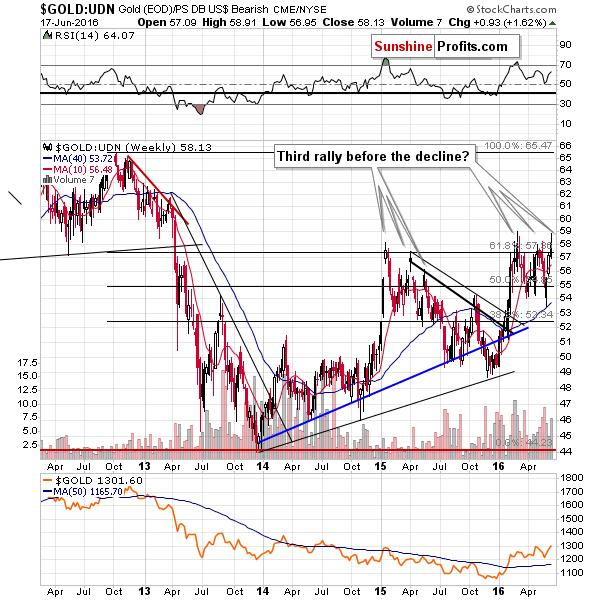
From the non-USD perspective, we saw a move back to the previous 2016 high and since today gold is declining along with the USD Index, the above price is likely declining quickly as well. It appears that a triple top was formed. Let’s keep in mind that we saw 3 rallies before gold continued the decline also in 2015 and since history tends to repeat itself, we find the implications bearish (not strongly bearish, but still).
What about silver?
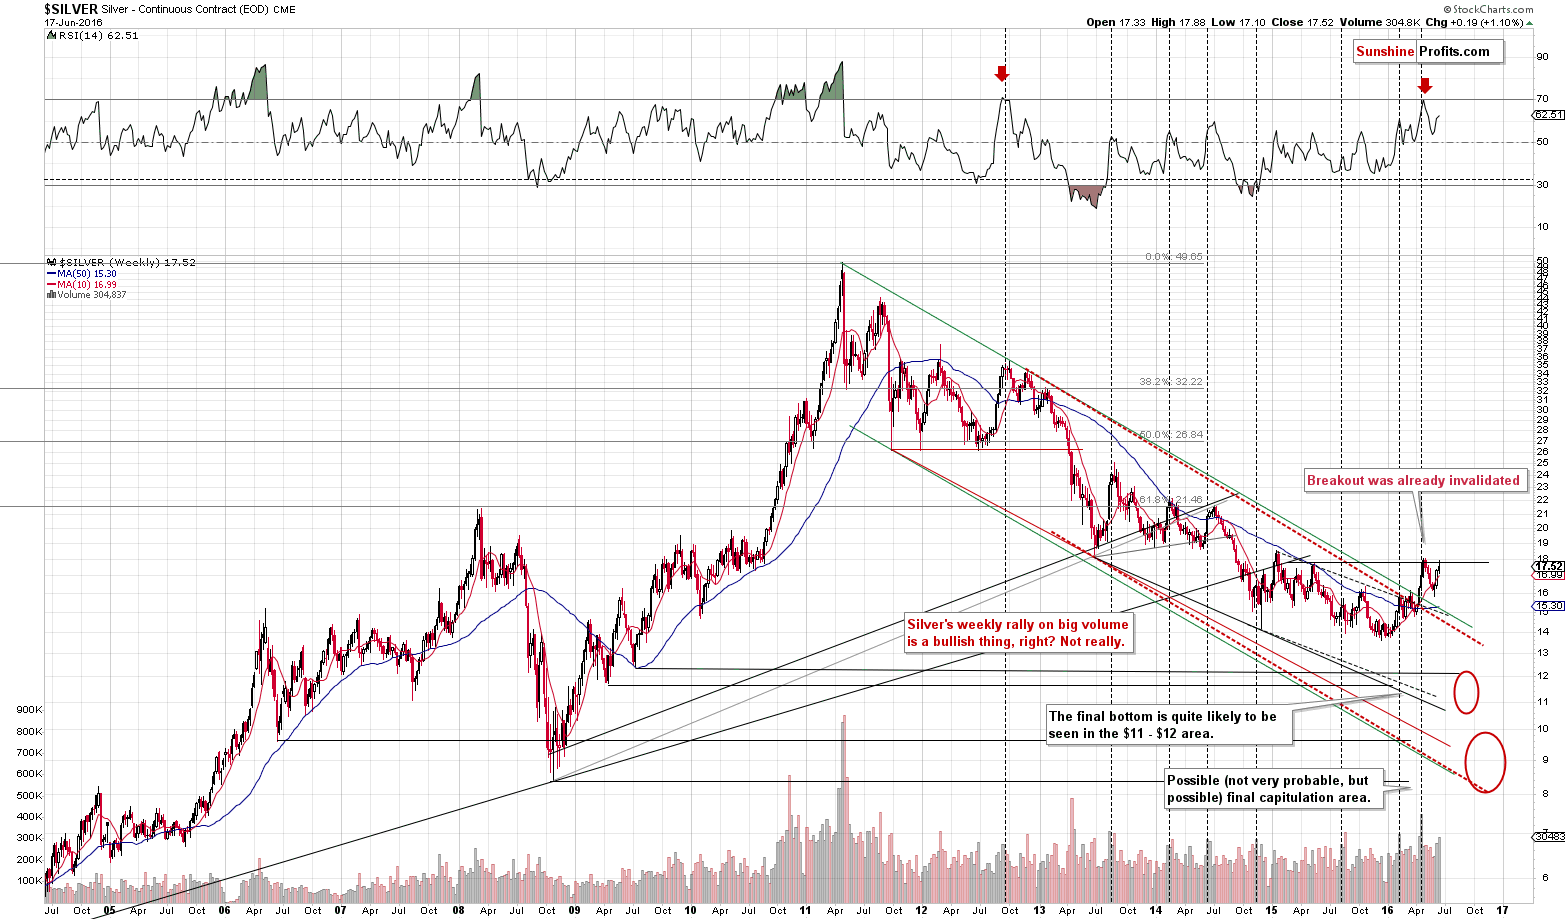
Not much changed – silver didn’t break above the mid-2015 high (despite an intra-day attempt) and it also reversed on Thursday, just as gold did. The invalidation of the breakout serves as a bearish sign, just like it did earlier this year.
Before summarizing, let’s discuss why gold and the USD Index rising and declining together. The most likely reason is that the biggest news this week for gold is the Brexit poll. The tensions regarding the European Union increase demand for both the U.S. dollar (as a safe-haven currency) and gold (as a safe-haven asset). As we wrote previously, gold is not really a good hedge against single geopolitical events, but it’s still being viewed as such.
CNBC’s poll shows that gold’s gleam is appealing to those aiming to hedge the risk of Brexit:
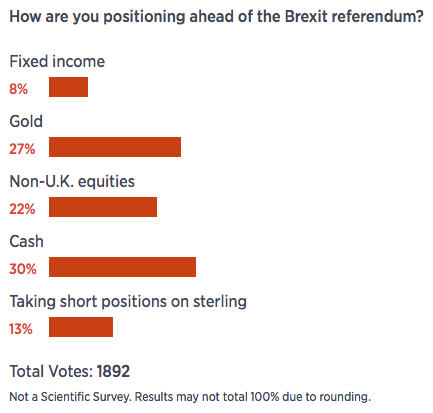
What does it mean? That the usual relationship between gold and the USD Index could continue to act out of the regular pattern in the coming days and we can’t discuss gold’s strength or weakness based on the way it responds to the USD’s moves. After a while this kind of relationship is likely to be back to normal and we will once again be able to use it to detect market turning points.
Summing up, a lot happened last week, but not much changed. The outlook was and it still is bearish. The lack of a rally in mining stocks and Thursday’s key reversal are new bearish factors that suggest lower prices in the coming weeks.
As far as the UK vote is concerned, we think (also based on how gold / miners are performing) that the UK will remain in the EU and this is likely to trigger a decline in gold and – to some extent – in the USD Index. Given a declining USD, the Fed could be more eager to increase the rates, which would quite likely contribute to even lower gold prices. Of course that’s what seems likely at this time and it can change – but as always, we will keep you informed.
As always, we will keep you – our subscribers – updated.
To summarize:
Trading capital (our opinion): Short positions (full position) in gold, silver, and mining stocks are justified from the risk/reward perspective with the following stop-loss orders and initial target price levels:
- Gold: initial target price: $1,006; stop-loss: $1,323, initial target price for the DGLD ETN: $86.30; stop-loss for the DGLD ETN $44.35
- Silver: initial target price: $12.13; stop-loss: $18.17, initial target price for the DSLV ETN: $65.88; stop-loss for the DSLV ETN $24.16
- Mining stocks (price levels for the GDX ETF): initial target price: $9.34; stop-loss: $27.47, initial target price for the DUST ETF: $47.90; stop-loss for the DUST ETF $8.50
In case one wants to bet on junior mining stocks' prices (we do not suggest doing so – we think senior mining stocks are more predictable in the case of short-term trades – if one wants to do it anyway, we provide the details), here are the stop-loss details and initial target prices:
- GDXJ ETF: initial target price: $14.13; stop-loss: $41.73
- JDST ETF: initial target price: $61.74; stop-loss: $9.87
Long-term capital (our opinion): No positions
Insurance capital (our opinion): Full position
Plus, you might want to read why our stop-loss orders are usually relatively far from the current price.
Please note that a full position doesn’t mean using all of the capital for a given trade. You will find details on our thoughts on gold portfolio structuring in the Key Insights section on our website.
As a reminder – “initial target price” means exactly that – an “initial” one, it’s not a price level at which we suggest closing positions. If this becomes the case (like it did in the previous trade) we will refer to these levels as levels of exit orders (exactly as we’ve done previously). Stop-loss levels, however, are naturally not “initial”, but something that, in our opinion, might be entered as an order.
Since it is impossible to synchronize target prices and stop-loss levels for all the ETFs and ETNs with the main markets that we provide these levels for (gold, silver and mining stocks – the GDX ETF), the stop-loss levels and target prices for other ETNs and ETF (among other: UGLD, DGLD, USLV, DSLV, NUGT, DUST, JNUG, JDST) are provided as supplementary, and not as “final”. This means that if a stop-loss or a target level is reached for any of the “additional instruments” (DGLD for instance), but not for the “main instrument” (gold in this case), we will view positions in both gold and DGLD as still open and the stop-loss for DGLD would have to be moved lower. On the other hand, if gold moves to a stop-loss level but DGLD doesn’t, then we will view both positions (in gold and DGLD) as closed. In other words, since it’s not possible to be 100% certain that each related instrument moves to a given level when the underlying instrument does, we can’t provide levels that would be binding. The levels that we do provide are our best estimate of the levels that will correspond to the levels in the underlying assets, but it will be the underlying assets that one will need to focus on regarding the sings pointing to closing a given position or keeping it open. We might adjust the levels in the “additional instruments” without adjusting the levels in the “main instruments”, which will simply mean that we have improved our estimation of these levels, not that we changed our outlook on the markets. We are already working on a tool that would update these levels on a daily basis for the most popular ETFs, ETNs and individual mining stocks.
Our preferred ways to invest in and to trade gold along with the reasoning can be found in the how to buy gold section. Additionally, our preferred ETFs and ETNs can be found in our Gold & Silver ETF Ranking.
As always, we'll keep you - our subscribers - updated should our views on the market change. We will continue to send out Gold & Silver Trading Alerts on each trading day and we will send additional Alerts whenever appropriate.
The trading position presented above is the netted version of positions based on subjective signals (opinion) from your Editor, and the Tools and Indicators.
As a reminder, Gold & Silver Trading Alerts are posted before or on each trading day (we usually post them before the opening bell, but we don't promise doing that each day). If there's anything urgent, we will send you an additional small alert before posting the main one.
=====
Latest Free Trading Alerts:
On Friday, crude oil reversed and rebounded sharply as the combination of weaker greenback and fading Brexit fears supported the price. As a result, light crude gained 5% and invalidated earlier breakdown under the short-term support line. Is it enough to encourage oil bulls to act in the coming week?
Oil Trading Alert: Crude Oil Invalidates Breakdown
S&P 500 index extended its short-term consolidation on Friday. Will the downtrend reverse? Is holding short position still justified?
=====
Hand-picked precious-metals-related links:
Brexit polls say remain has a lead, so how are you trading?
Gold Sinks Most in Month as Tide May Be Turning in Brexit Debate
India Gold imports plummet for the fourth consecutive month in May
Gold Speculators Sharply Raise Bullish Net Positions For Second Week
Canada's Kinross suspends work at Mauritania gold mine
=====
In other news:
Britain's rival EU camps resume campaign as polls show momentum for 'In'
Stocks Surge With Pound as Brexit Odds Decline; Rupee Weakens
The Brexit vote could cause a huge buying opportunity: Wells Fargo
El-Erian: Raghuram Rajan’s departure is bad news, and not just for India
Veteran investors know there's one smart way to trade a Trump presidency
A 90-year glance at the two most popular stock market investing strategies
The next president will likely face a recession
BOJ chief says "positive" impact of negative rate on economy emerging
=====
Thank you.
Sincerely,
Przemyslaw Radomski, CFA
Founder, Editor-in-chief, Gold & Silver Fund Manager
Gold & Silver Trading Alerts
Forex Trading Alerts
Oil Investment Updates
Oil Trading Alerts

