

Briefly: In our opinion speculative short positions (full) are currently justified from the risk/reward point of view.
The precious metals sector moved higher last week, but on Friday we saw a major reversal in the case of gold stocks – the HUI Index declined after an initial upswing forming a bearish shooting star candlestick. Was that the end of the rally?
That’s quite possible and likely that the end of the rally is just around the corner, even though gold got a boost today (likely based on the increased interest and the possibility of Brexit and the increased likelihood of the latter). Silver didn’t move higher along with gold and actually silver plunged very temporarily in overnight trading, which is a phenomenon seen quite often right before big declines. Gold moved higher despite the lack of decline in the USD Index, but silver doesn’t confirm this move – it’s likely that the move is driven by a factor that affects only the gold market as gold is viewed more as a “hedge” against risks than silver is. Either way, the move doesn’t appear to be really sustainable. Let’s take a closer look at the charts (charts courtesy of http://stockcharts.com).
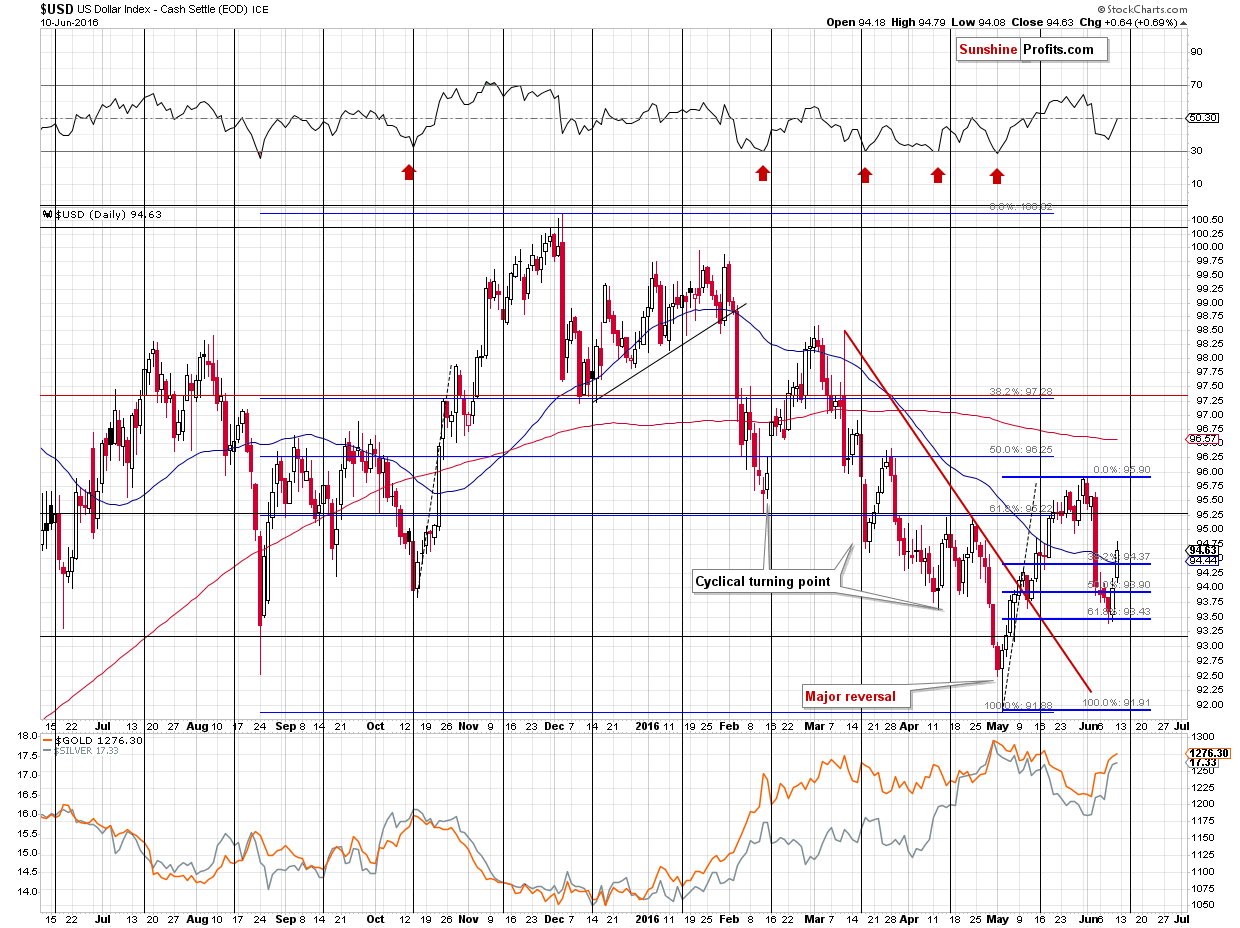
The situation in the USD Index was bullish and it remains to be the case. Gold didn’t reply to the most recent move higher in the USD Index and this is a bullish factor for precious metals, but at the same time, the last 2 days provided us with additional bearish signals from the mining stocks (a small breakout and its invalidation).
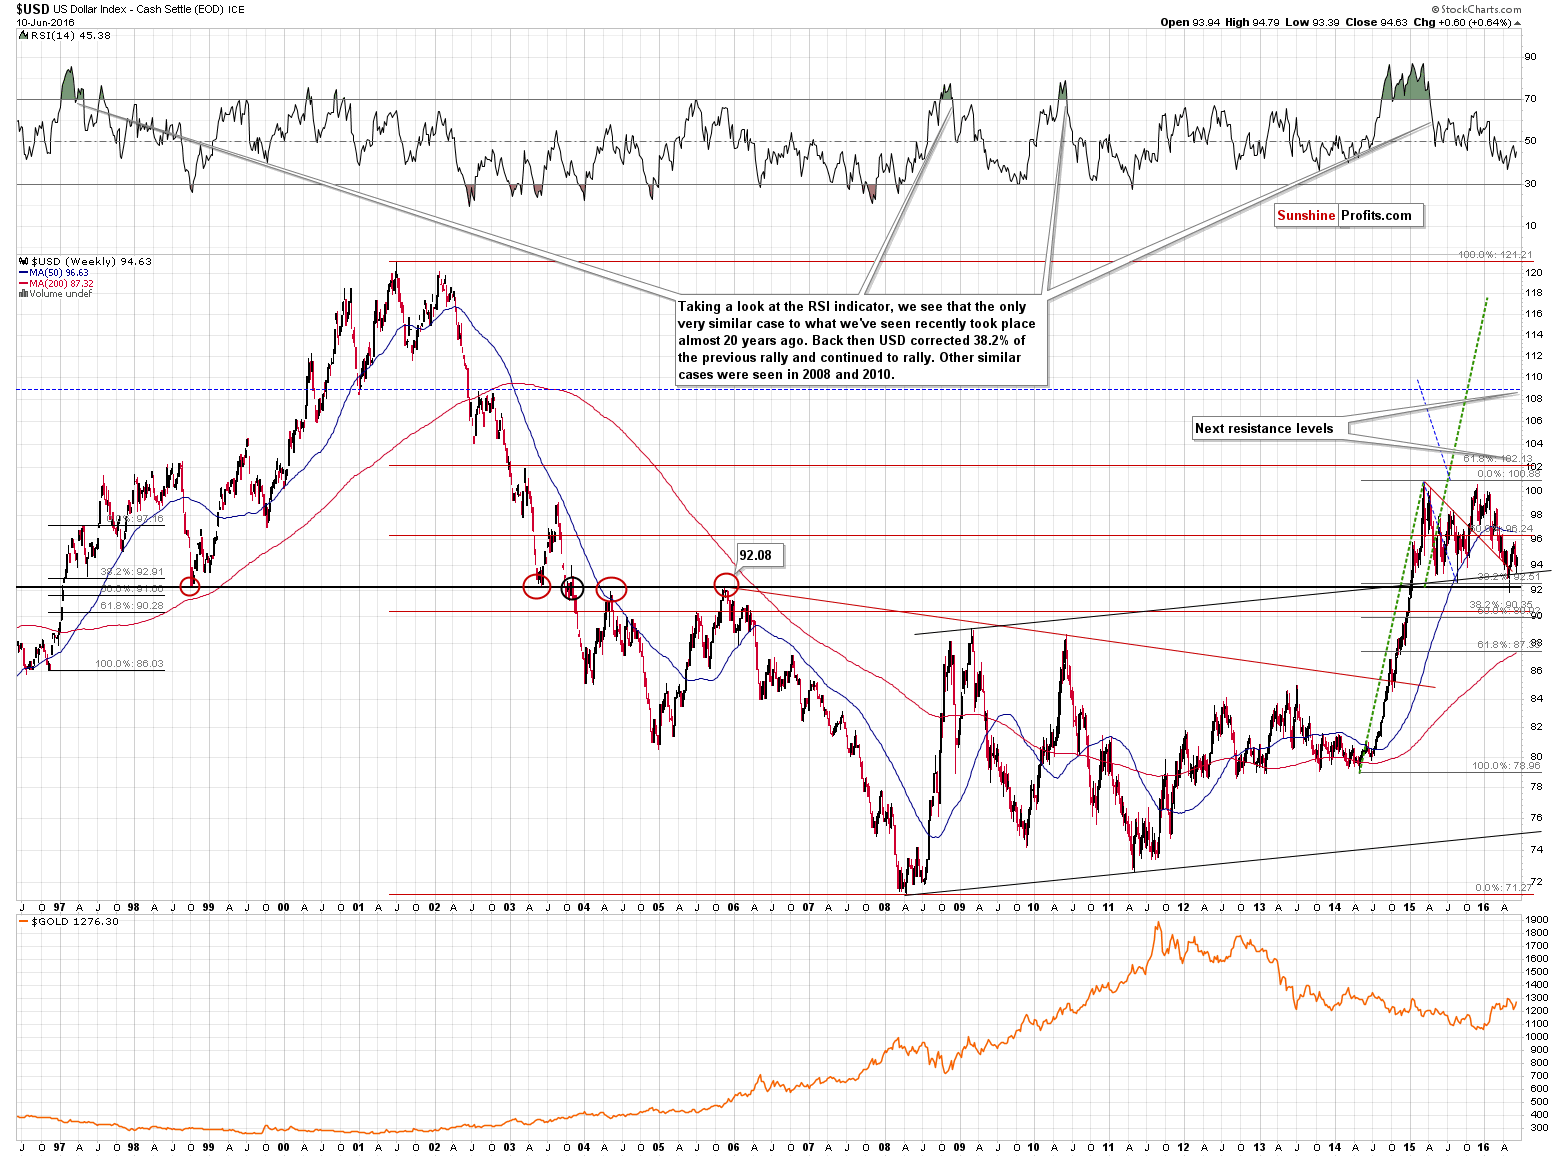
All in all, the USD Index is most likely ending its prolonged consolidation after a breakout above the 92 level about 1.5 years ago and it’s likely to move much higher in the following months.
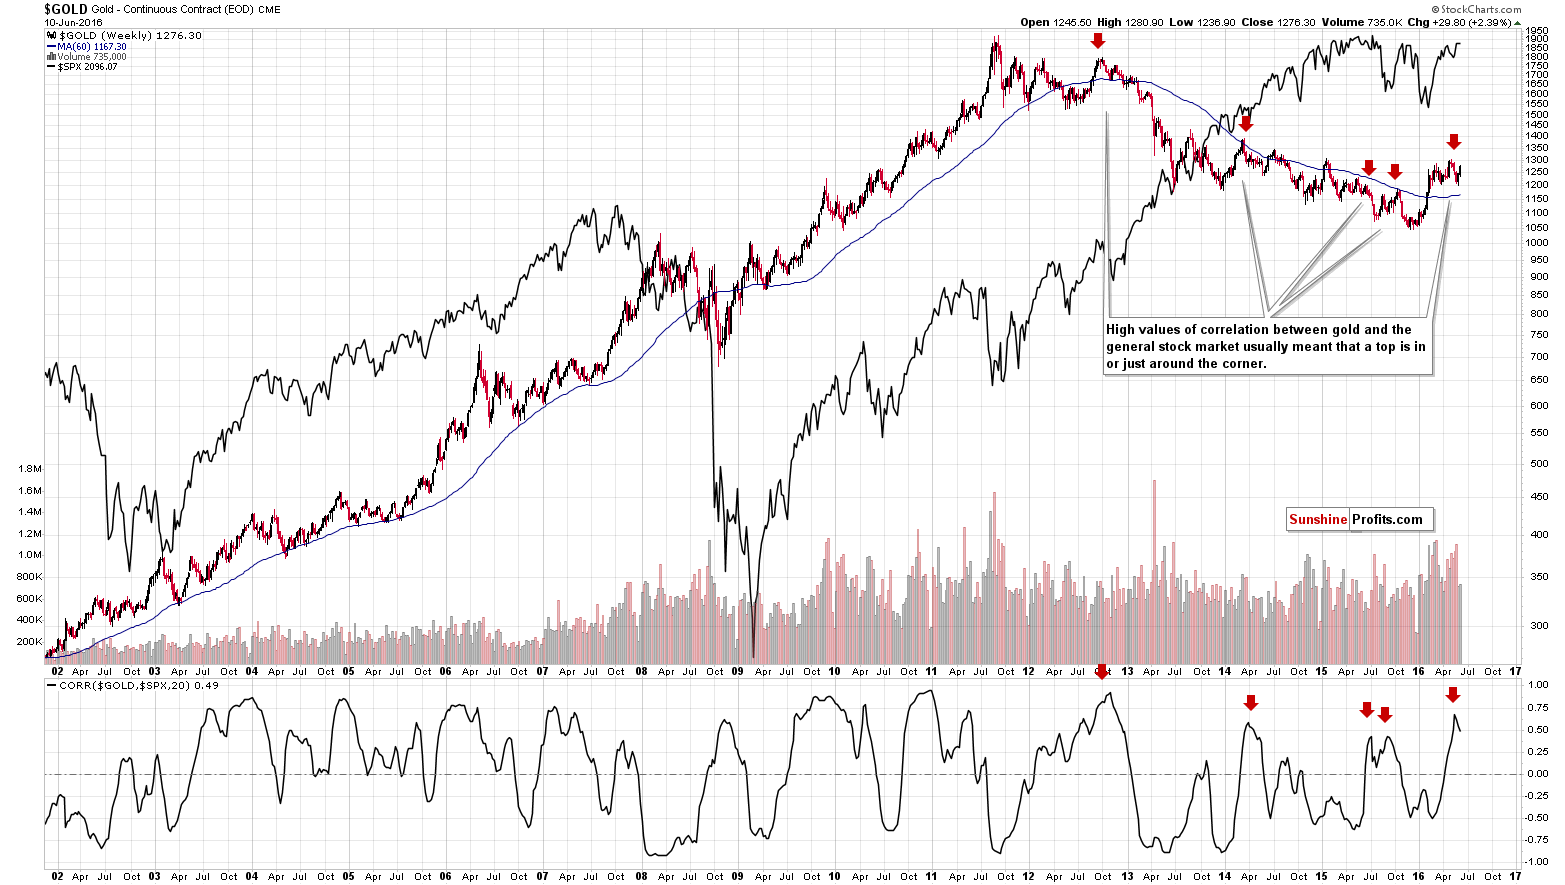
One interesting thing about gold’s long-term chart is its relationship with the general stock market. The two were moving higher together recently for quite a long time and this pushed the 20-week correlation coefficient above 0.7. Now the correlation is declining again. Please note that the times when we saw something similar were followed by declines and thus the implications are bearish for the following weeks.
Another thing that’s worth keeping in mind is the size of the volume – gold moved higher on low volume and that’s a bearish sign.
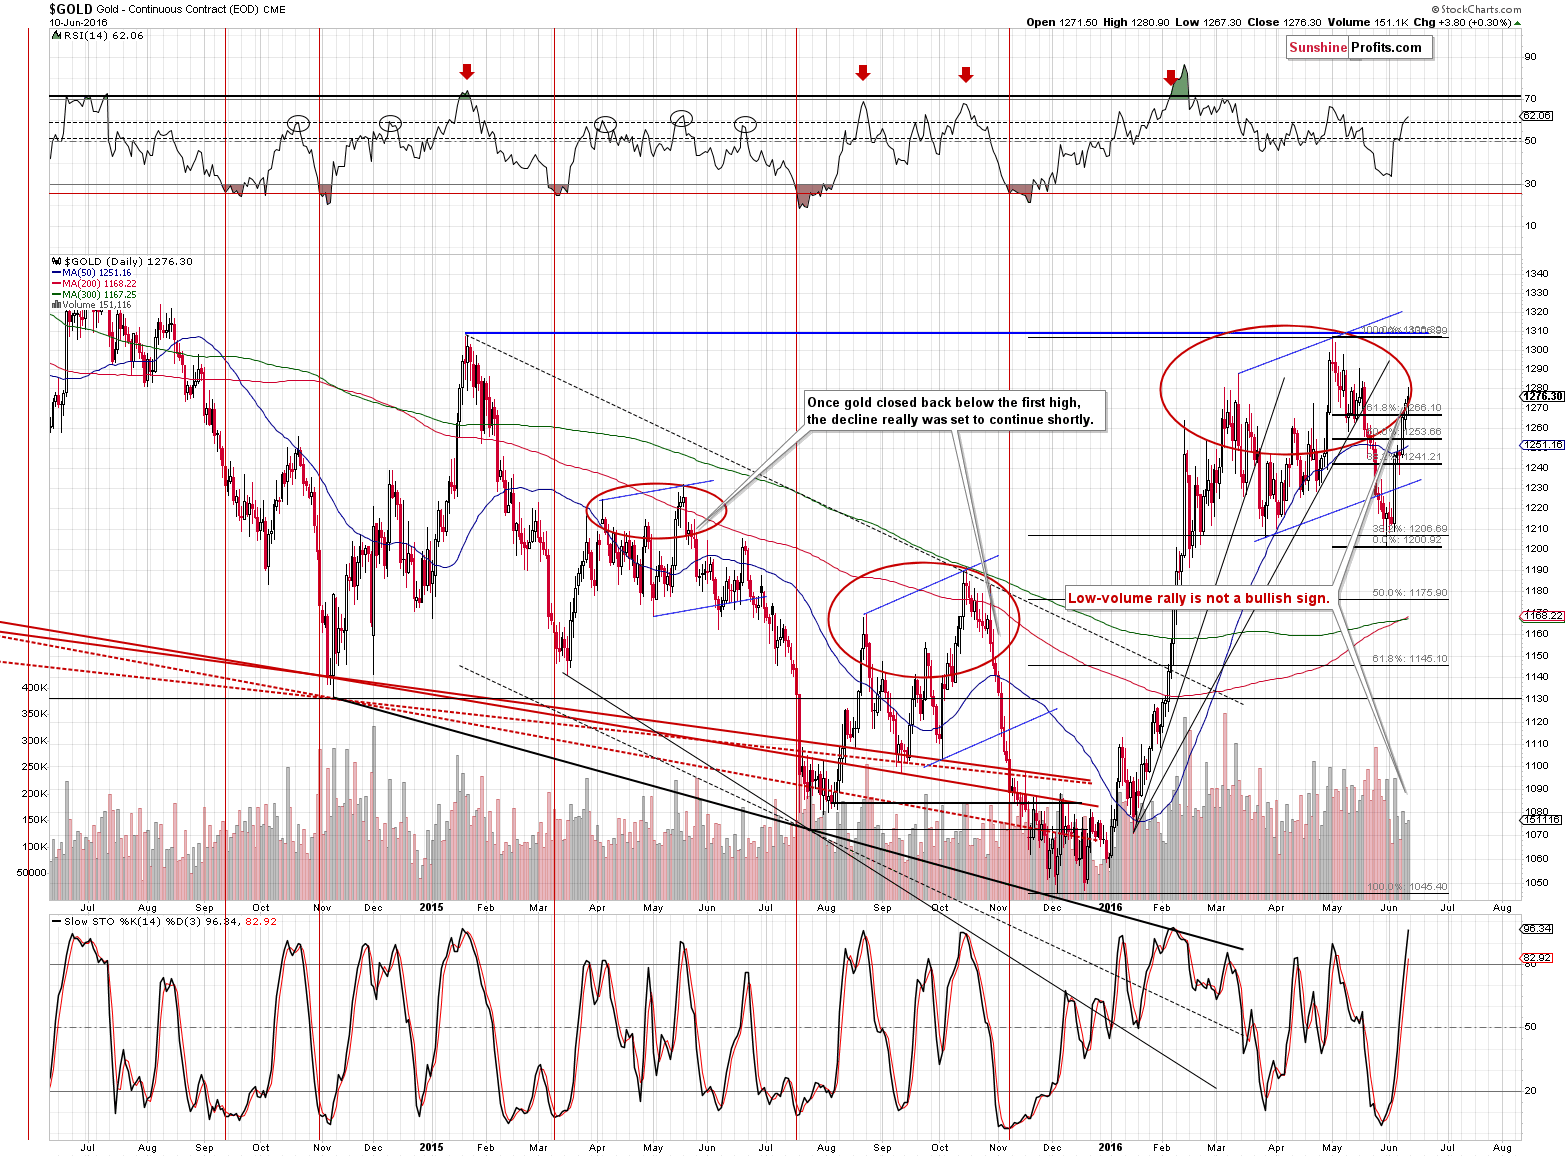
Gold moved higher once again and the volume on which gold is moving higher is low not only on a weekly basis, but we can also see that it’s very low in the case of all daily upswings that we saw last week. Gold moved above the 61.8% Fibonacci retracement, but the way in which it moved higher (with a decline in miners and given low volume) suggests that the outlook didn’t change and that it remains bearish. Gold moved to $1,287 today, which is very close to the March high. Not only is it a resistance level, but a decline from here would create a bearish head-and-shoulders pattern with the March high being the left shoulder and the current top being the right shoulder (the May high being the head).
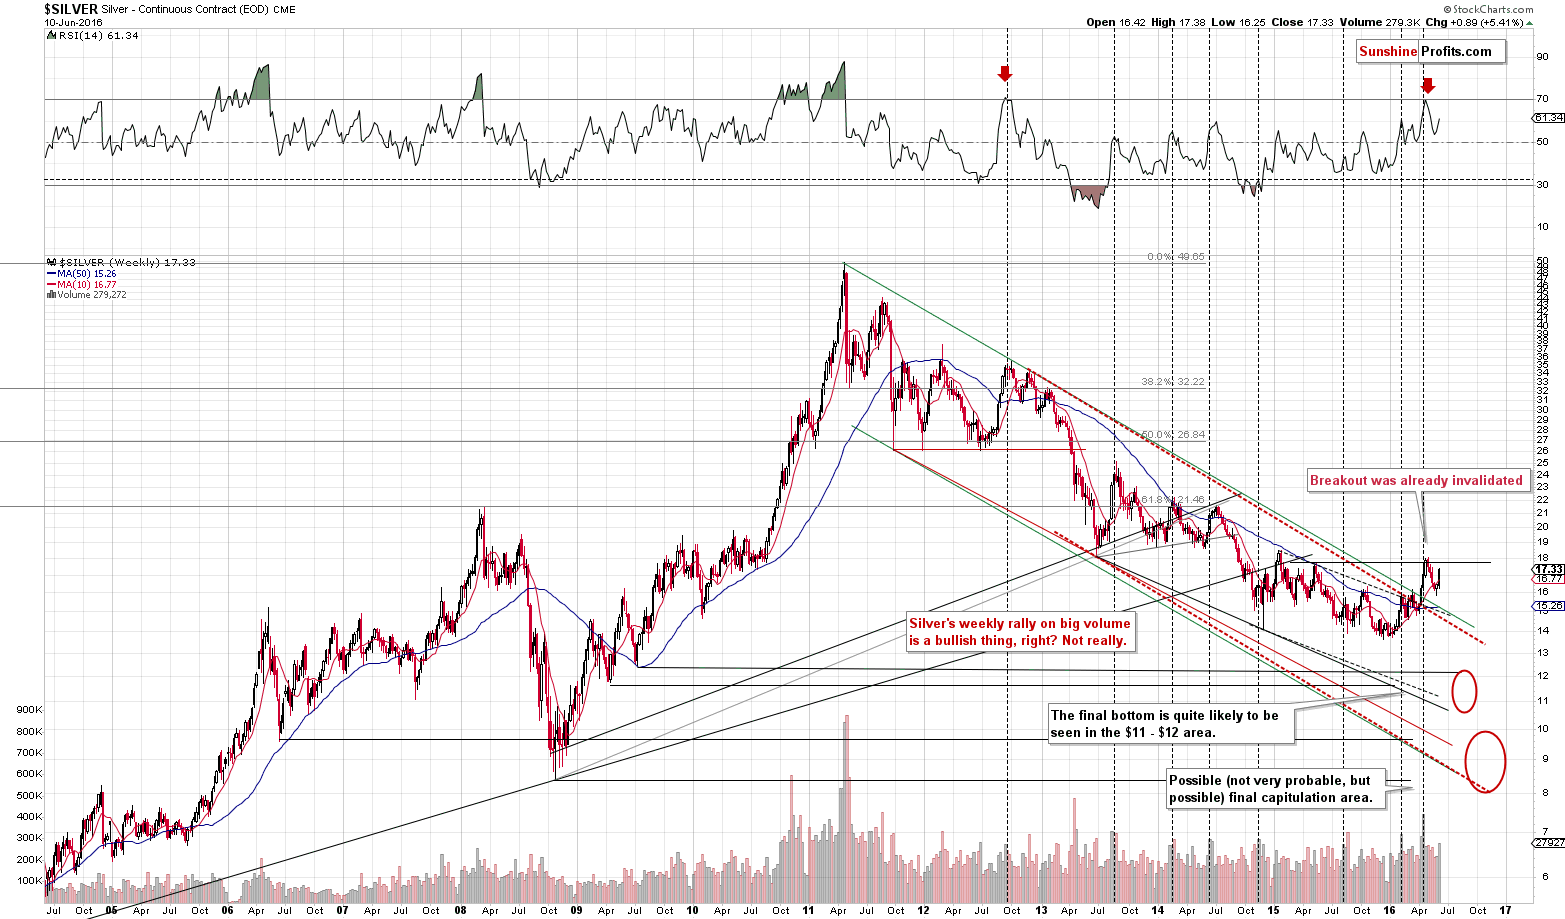
In case of the silver market, we can see a weekly rally on higher volume. It’s not particularly bullish as silver tends to outperform gold right before the tops. Let’s take a look at the context. One of the key technical developments in the recent months was a move above 70 in the RSI indicator. This started a powerful decline when it was seen previously (mid-2012), but the decline was not a straight line – there were a few corrections and the first one was very similar to the most recent upswing in silver. Since silver’s price patterns are similar to the previous decline that had started with the RSI at 70, we are not viewing this move higher as something bullish – it’s more likely a part of a bigger decline.
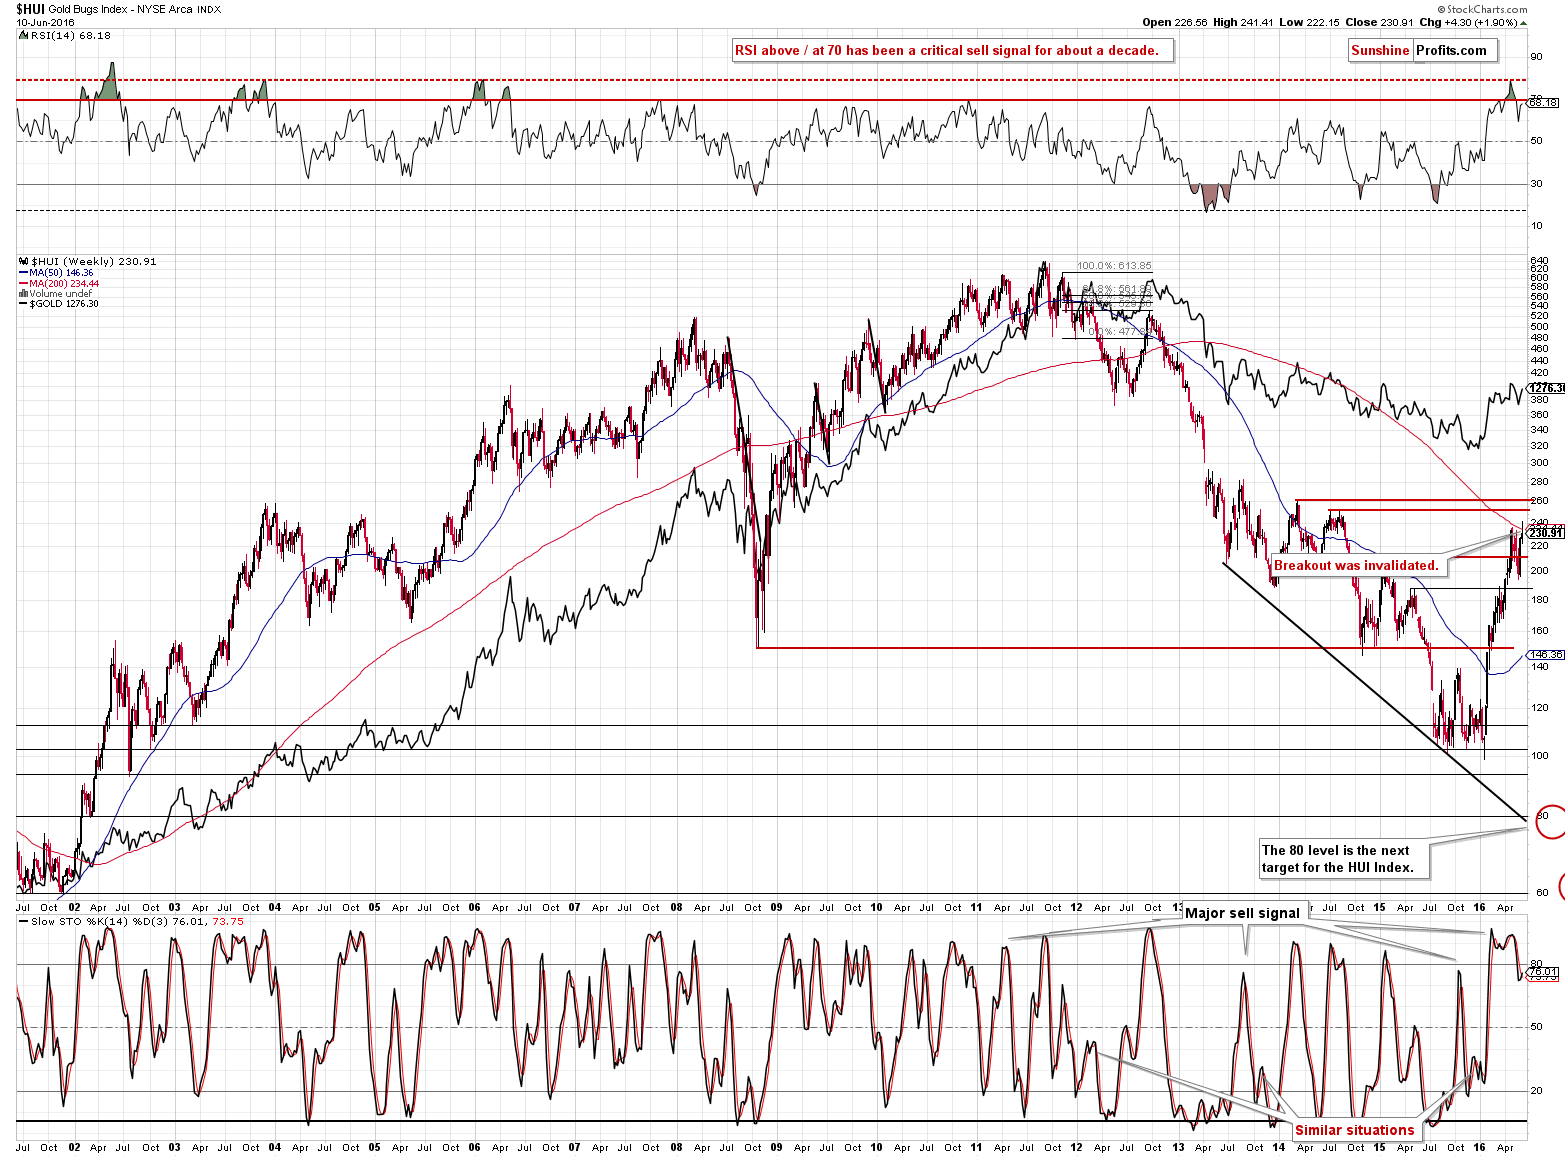
In the case of the HUI Index (proxy for gold stocks), we see that there was no breakout above this year’s high and the previous small breakout was invalidated. Based on gold’s move higher today, we could see another intra-day move higher in mining stocks, but since the previous attempt to move higher was invalidated on Friday, we could see something similar today.
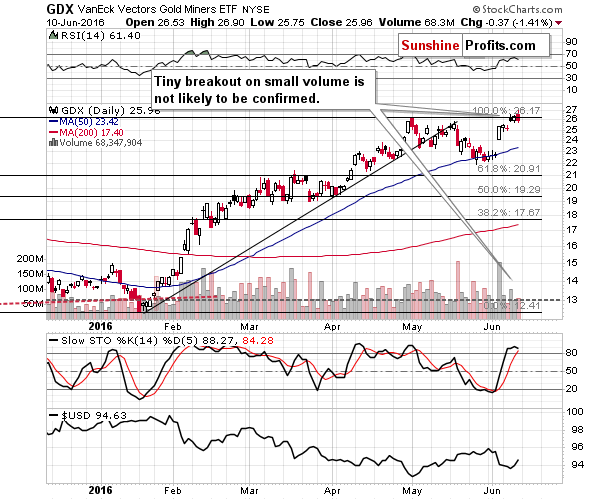
In case of the GDX ETF, we don’t see the same invalidation, but the HUI Index is much more important, so we overall view the previous breakout as invalidated.
Summing up, gold’s move higher despite the USD’s move higher is a new bullish factor, but at the same time gold stocks’ underperformance and the invalidation of the small breakout above the previous 2016 high is a new bearish signal, so overall the situation didn’t improve much. Silver’s mover higher in the recent days is quite in tune with what happened in the early days of the previous major downleg in the white metal and the situation in the USD Index itself didn’t deteriorate. The outlook remains bearish, even though the decline can be delayed by increased tensions over the Brexit vote. We are moving the stop-loss levels for mining stocks a big higher due to the possible intra-day upswing.
As always, we will keep you – our subscribers – updated.
To summarize:
Trading capital (our opinion): Short positions (full position) in gold, silver, and mining stocks are justified from the risk/reward perspective with the following stop-loss orders and initial target price levels:
- Gold: initial target price: $1,006; stop-loss: $1,317, initial target price for the DGLD ETN: $86.30; stop-loss for the DGLD ETN $43.71
- Silver: initial target price: $12.13; stop-loss: $18.17, initial target price for the DSLV ETN: $65.88; stop-loss for the DSLV ETN $24.16
- Mining stocks (price levels for the GDX ETF): initial target price: $9.34; stop-loss: $27.47, initial target price for the DUST ETF: $47.90; stop-loss for the DUST ETF $8.50
In case one wants to bet on junior mining stocks' prices (we do not suggest doing so – we think senior mining stocks are more predictable in the case of short-term trades – if one wants to do it anyway, we provide the details), here are the stop-loss details and initial target prices:
- GDXJ ETF: initial target price: $14.13; stop-loss: $41.73
- JDST ETF: initial target price: $61.74; stop-loss: $9.87
Long-term capital (our opinion): No positions
Insurance capital (our opinion): Full position
Plus, you might want to read why our stop-loss orders are usually relatively far from the current price.
Please note that a full position doesn’t mean using all of the capital for a given trade. You will find details on our thoughts on gold portfolio structuring in the Key Insights section on our website.
As a reminder – “initial target price” means exactly that – an “initial” one, it’s not a price level at which we suggest closing positions. If this becomes the case (like it did in the previous trade) we will refer to these levels as levels of exit orders (exactly as we’ve done previously). Stop-loss levels, however, are naturally not “initial”, but something that, in our opinion, might be entered as an order.
Since it is impossible to synchronize target prices and stop-loss levels for all the ETFs and ETNs with the main markets that we provide these levels for (gold, silver and mining stocks – the GDX ETF), the stop-loss levels and target prices for other ETNs and ETF (among other: UGLD, DGLD, USLV, DSLV, NUGT, DUST, JNUG, JDST) are provided as supplementary, and not as “final”. This means that if a stop-loss or a target level is reached for any of the “additional instruments” (DGLD for instance), but not for the “main instrument” (gold in this case), we will view positions in both gold and DGLD as still open and the stop-loss for DGLD would have to be moved lower. On the other hand, if gold moves to a stop-loss level but DGLD doesn’t, then we will view both positions (in gold and DGLD) as closed. In other words, since it’s not possible to be 100% certain that each related instrument moves to a given level when the underlying instrument does, we can’t provide levels that would be binding. The levels that we do provide are our best estimate of the levels that will correspond to the levels in the underlying assets, but it will be the underlying assets that one will need to focus on regarding the sings pointing to closing a given position or keeping it open. We might adjust the levels in the “additional instruments” without adjusting the levels in the “main instruments”, which will simply mean that we have improved our estimation of these levels, not that we changed our outlook on the markets. We are already working on a tool that would update these levels on a daily basis for the most popular ETFs, ETNs and individual mining stocks.
Our preferred ways to invest in and to trade gold along with the reasoning can be found in the how to buy gold section. Additionally, our preferred ETFs and ETNs can be found in our Gold & Silver ETF Ranking.
As always, we'll keep you - our subscribers - updated should our views on the market change. We will continue to send out Gold & Silver Trading Alerts on each trading day and we will send additional Alerts whenever appropriate.
The trading position presented above is the netted version of positions based on subjective signals (opinion) from your Editor, and the Tools and Indicators.
As a reminder, Gold & Silver Trading Alerts are posted before or on each trading day (we usually post them before the opening bell, but we don't promise doing that each day). If there's anything urgent, we will send you an additional small alert before posting the main one.
=====
Latest Free Trading Alerts:
Next week, Britons will decide whether the United Kingdom will remain within the European Union or leave. What does all this mean for the gold market?
Rising Odds of Brexit and Gold
On Friday, crude oil extended losses as a stronger dollar continued to weigh on the price. Additionally, the Baker Hughes’ report showed another increase in drilling activity, which pushed the black gold lower as well. As a result, light crude lost 3.13% and slipped under the barrier of $50, invalidating earlier breakout. What does it mean for the commodity?
Oil Trading Alert: Crude Oil under $50
S&P 500 index got back below the level of 2,100 on Friday. Is this an uptrend's reversal or just quick downward correction before another leg higher? Is holding short position justified?
Stock Trading Alert: Uptrend's Reversal Or Just Short-Term Correction?
=====
Hand-picked precious-metals-related links:
LAWRIE WILLIAMS: BoAML looks for higher gold price and silver prices but….
Gold Advances to Four-Week High on Brexit Risk, Fed Rate Outlook
=====
In other news:
Next Fed interest rate move could be a cut, Eastspring Investments says
Elusive S&P record looms as investors weigh data, Fed
6 Events That Could Make Soros a Winner
Pound Tumbles on Brexit Fears as Speculators Double Down on Drop
Brexit would cause big problems for German banks: German financial watchdog
China investment slows to 15-year low, more stimulus seen despite debt fears
IMF says China's growing corporate debt pile could become a systemic risk
=====
Thank you.
Sincerely,
Przemyslaw Radomski, CFA
Founder, Editor-in-chief, Gold & Silver Fund Manager
Gold & Silver Trading Alerts
Forex Trading Alerts
Oil Investment Updates
Oil Trading Alerts

