

Briefly:Short positions (full position) in gold, silver, and mining stocks are justified from the risk/reward perspective.
The implications are bearish, just as we described in yesterday’s third alert, especially that the key signal from the HUI Index was also confirmed by other markets. Let’s take a closer look at the charts (charts courtesy of http://stockcharts.com).
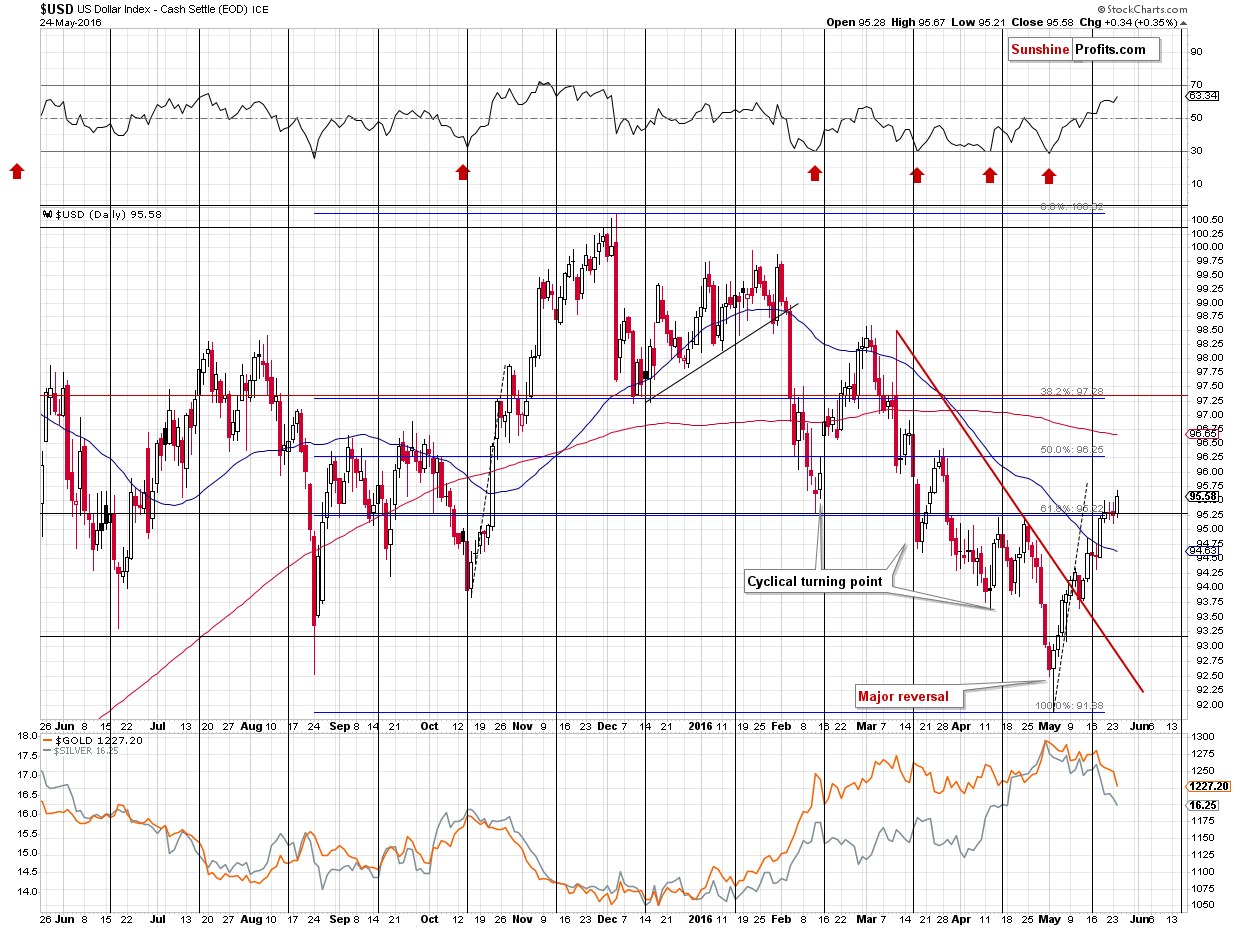
The USD Index broke decisively above the April highs and the 38.2% Fibonacci retracement based on the entire December – May decline. This is a significant and bullish development, especially that the previous few days resembled more a pause than a top (as we described yesterday):
Another thing that time – and the small consolidation – changed is the shape of the top/consolidation. The point is that all local tops since the December 2015 (when the decline had started) were formed quickly and we saw a visible decline no more than 1 day after the top with only one exception in early March 2016, when it took 2 days. We are currently after the third day and the last few days now – in light of the above – look much more like a consolidation than a top.
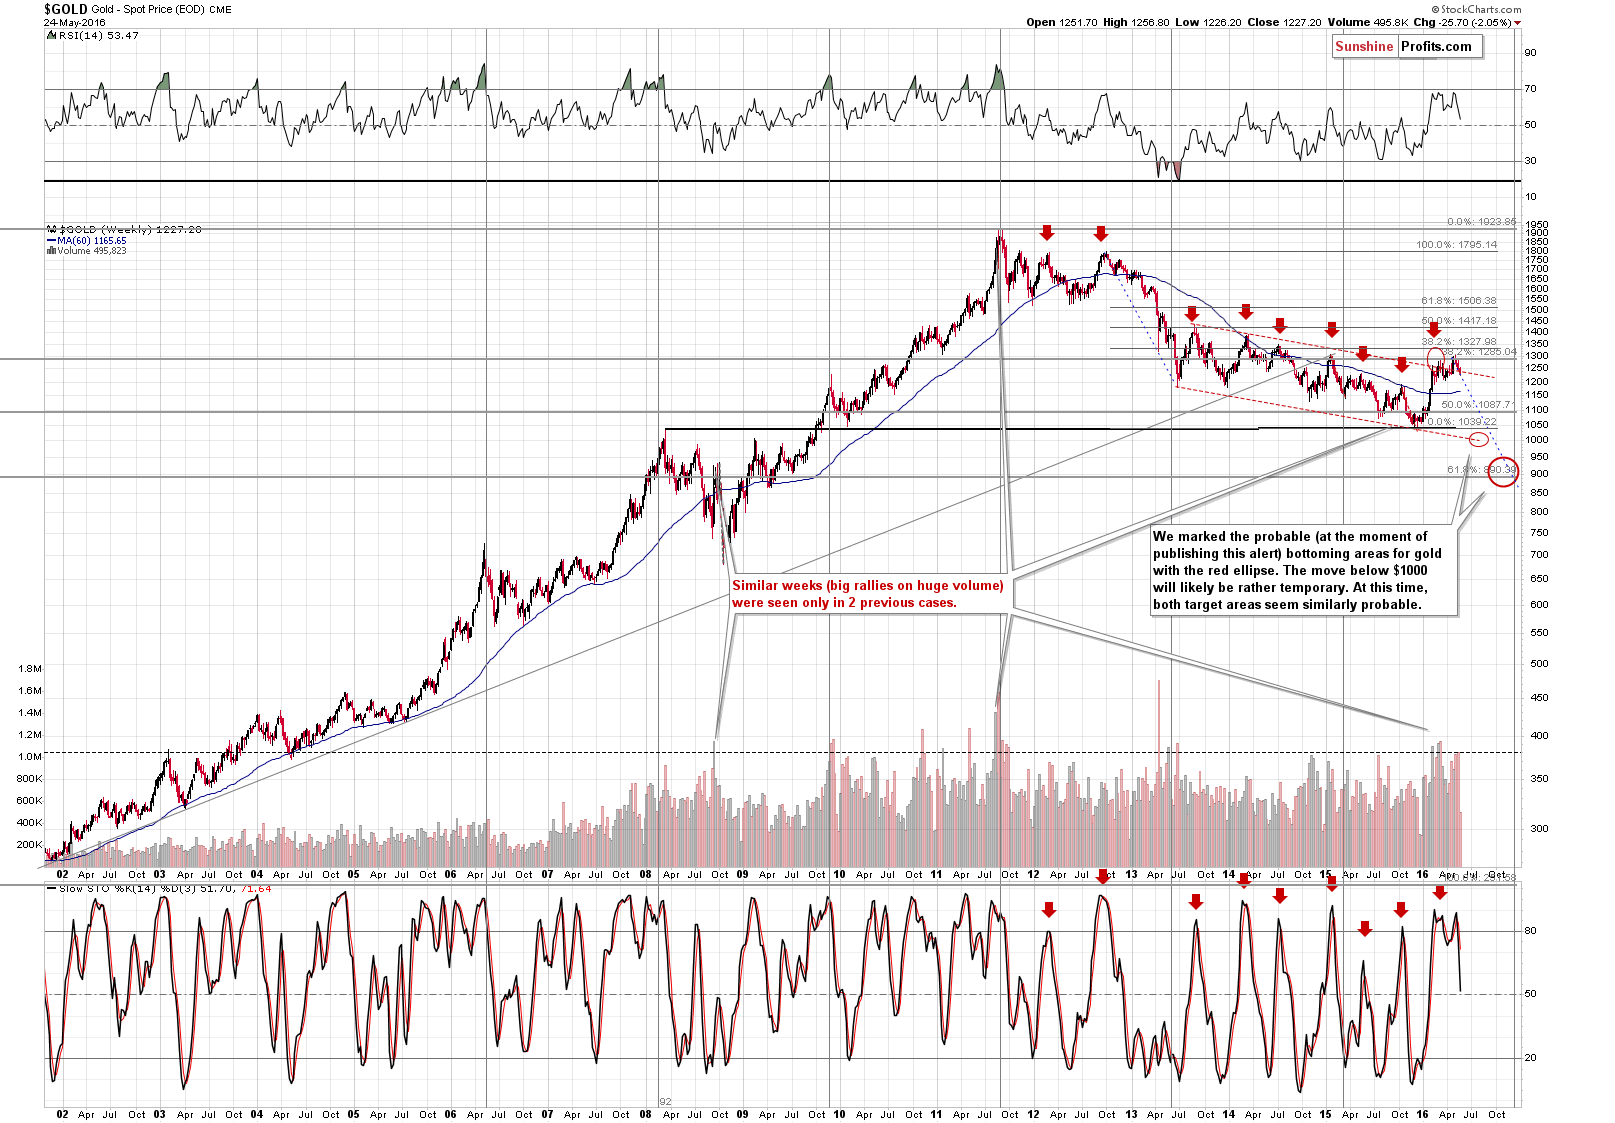
On the long-term gold chart, we can see that gold moved back into the declining trend channel – the previous breakout was also invalidated based on yesterday’s closing prices. Consequently, the move to $1,000 or so, and then (likely after a pause) to about $900 could be underway.
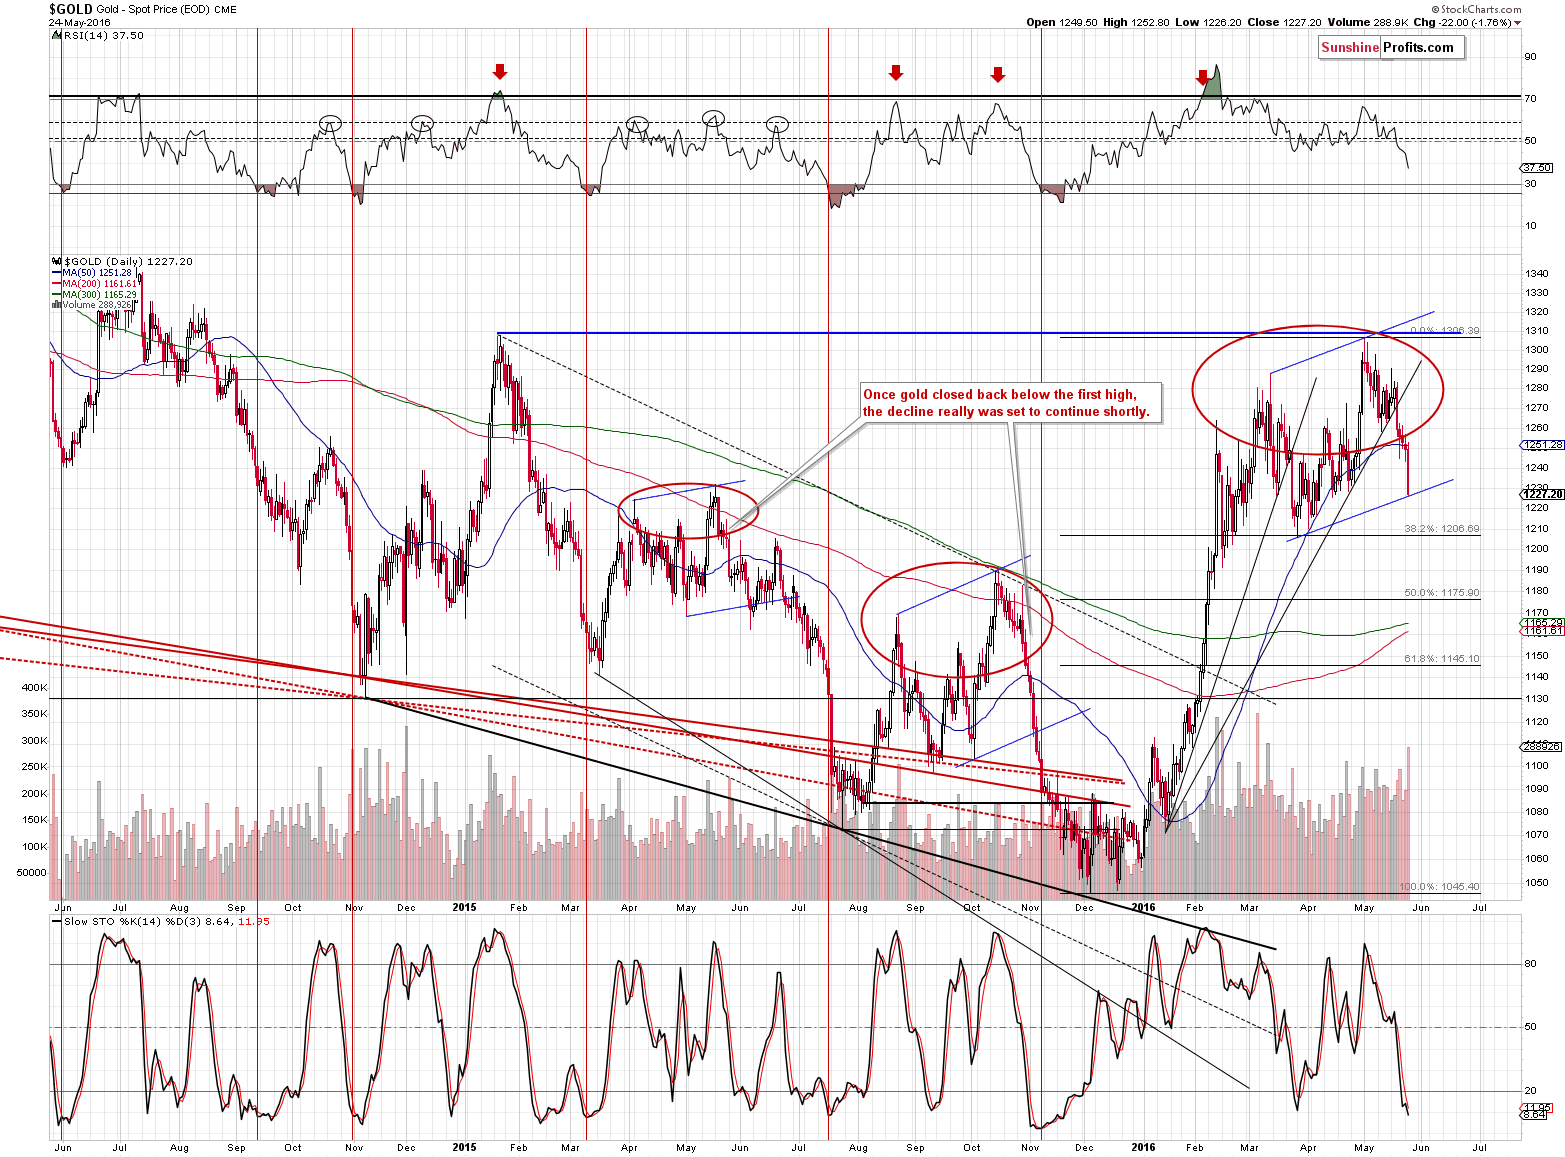
Gold moved sharply lower and the volume that accompanied this move was huge, which has bearish implications. Gold moved to the support line based on the previous highs and the March low (marked in blue), but it’s not a very bullish sign. An analogous line in early November 2015 didn’t stop the decline at all and the one that could be drawn in late May / early June 2015 resulted in only a small corrective upswing, after which the decline resumed.
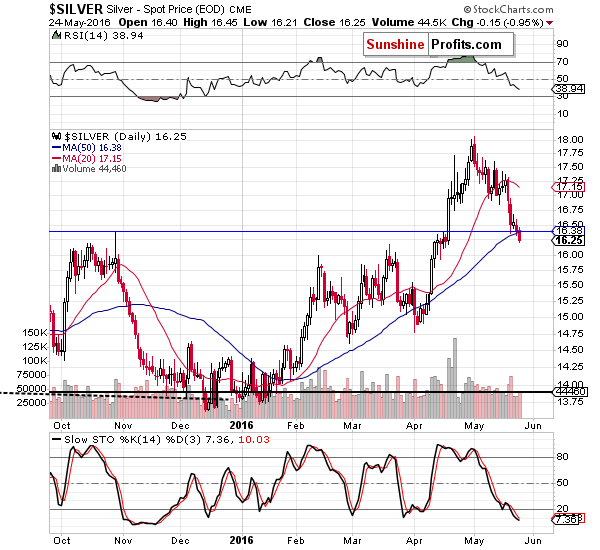
Silver declined below the October 2015 high in terms of intra-day prices, but not yet in terms of daily closing prices. Still, yesterday’s intra-day move higher while gold didn’t rally could be viewed as a bearish confirmation and a sign that a decline will continue.
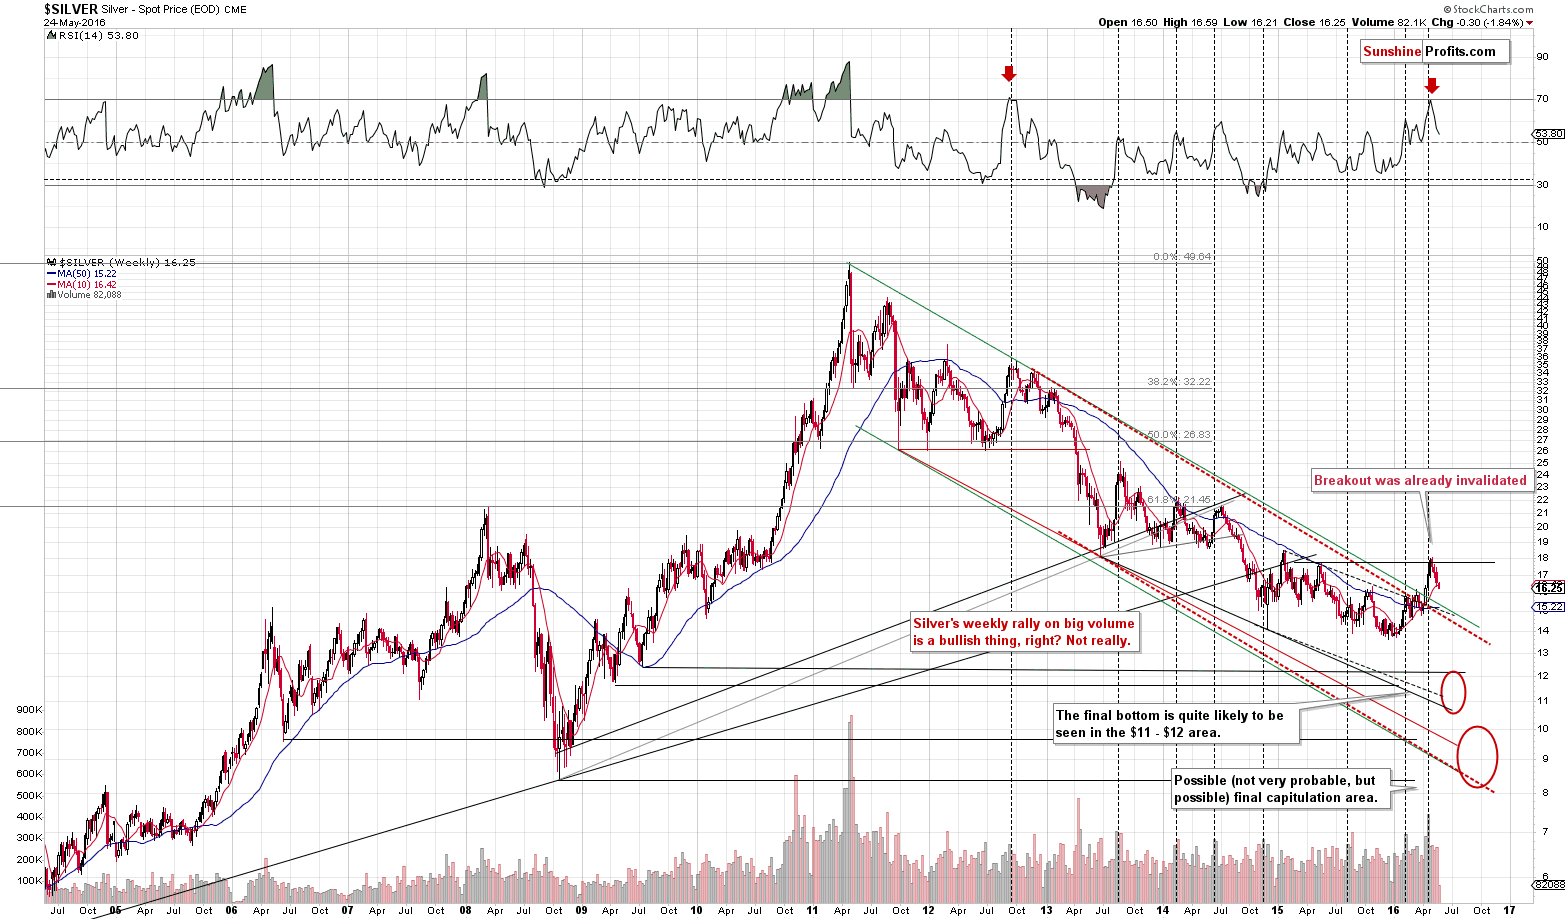
On the long-term silver chart, we clearly see that the decline continued after the breakout above the 2015 high was invalidated.
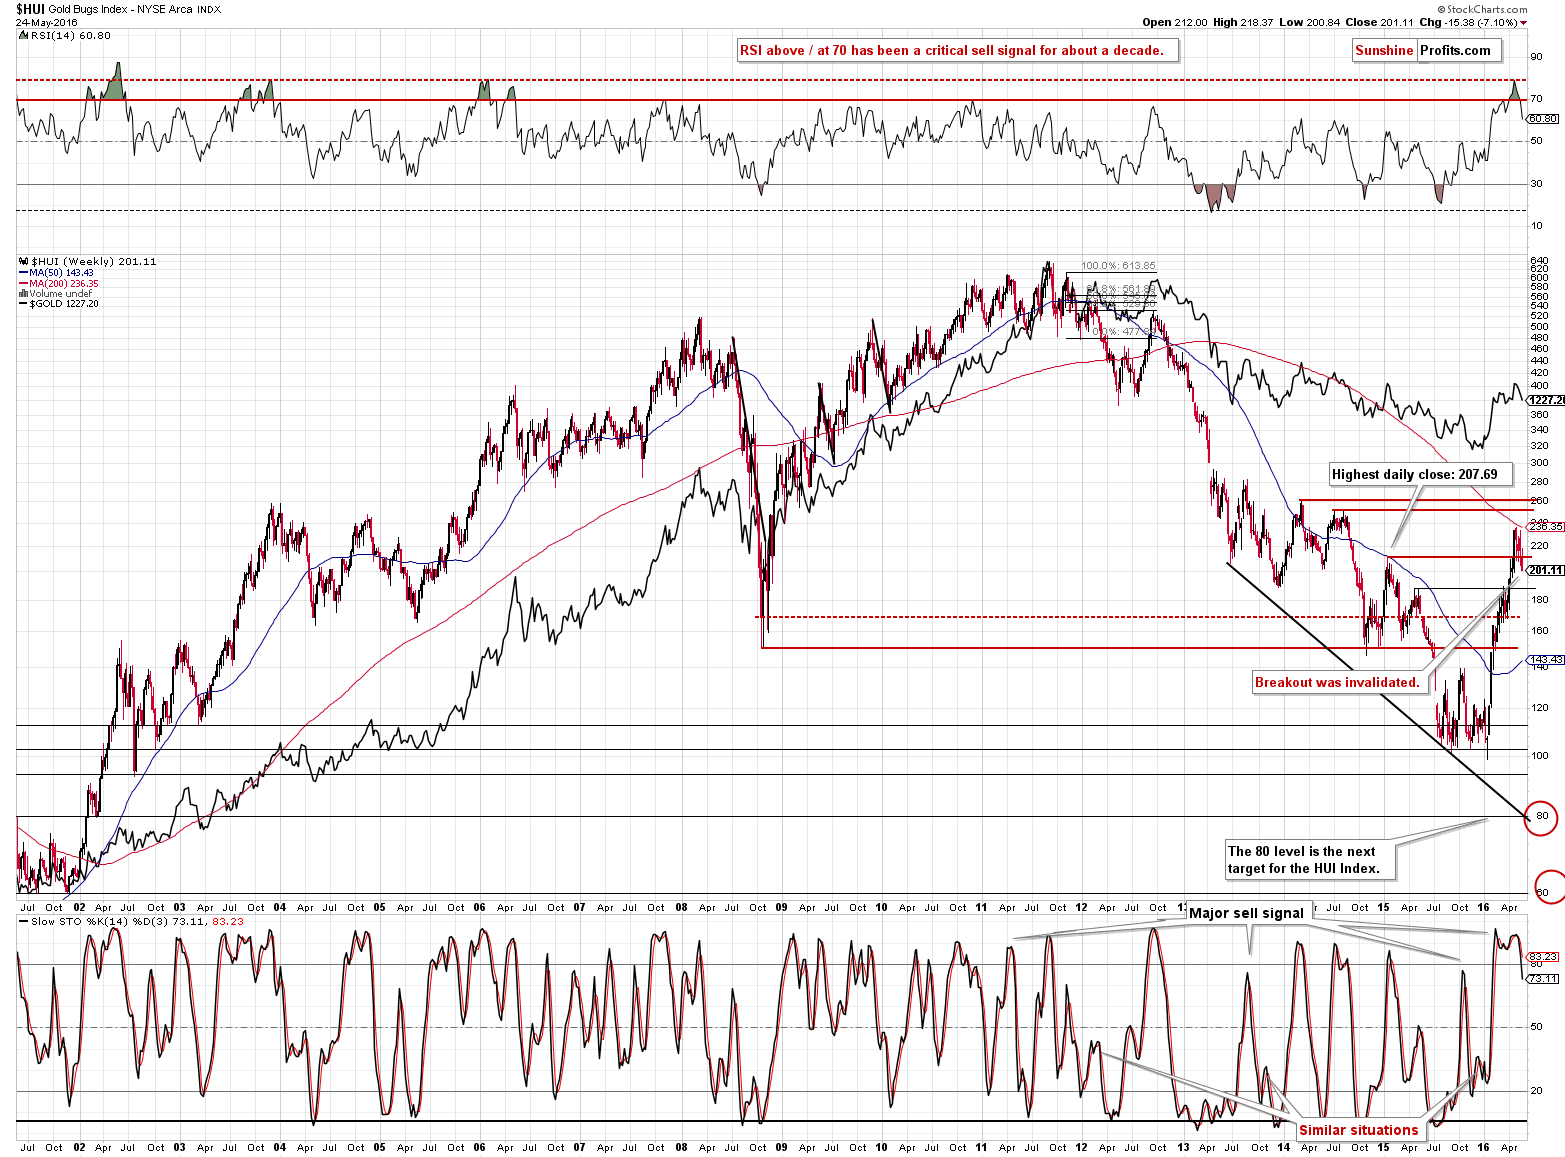
Speaking of invalidations of breakouts above the 2015 highs – the HUI Index did just that. The breakout itself was a bullish development, but we expected it to be invalidated as the situation in gold, silver and the USD Index didn’t support a continuation of the rally in miners. However, there was a chance that miners would rally even higher – to 240-260 or so before declining again. Based on yesterday’s invalidation of the breakout above the 2015 high (in terms of both intra-day prices and closing prices), the risk of such a rally is now very low. At the same time, the probability that the decline will continue has increased.
The Stochastic indicator is now very likely to flash a sell signal based on the weekly closing prices and this already has bearish implications. The week is not over yet, but the sell signal is so clear (the black line is well below the red one) that it would take a big rally in the HUI Index today, tomorrow and/or on Friday to invalidate it. Such a rally seems unlikely.
Summing up, the short-term outlook changed substantially yesterday (the medium-term outlook didn’t as it had been bearish previously) based on the invalidation of the breakout above the 2015 highs in gold stocks and due to gold’s move back into the declining trend channel. The breakout in the USD Index and the intra-day outperformance in silver serve as additional bearish signals. Consequently, we view short positions as justified from the risk to reward point of view. As discussed yesterday, we are updating the stop-loss levels and target prices for the leveraged ETNs.
As always, we will keep you – our subscribers – updated.
To summarize:
Trading capital (our opinion): Short positions (full position) in gold, silver, and mining stocks are justified from the risk/reward perspective with the following stop-loss orders and initial target price levels:
- Gold: initial target price: $1,006; stop-loss: $1,317, initial target price for the DGLD ETN: $86.30; stop-loss for the DGLD ETN $43.71
- Silver: initial target price: $12.13; stop-loss: $18.17, initial target price for the DSLV ETN: $65.88; stop-loss for the DSLV ETN $24.16
- Mining stocks (price levels for the GDX ETF): initial target price: $9.34; stop-loss: $26.47, initial target price for the DUST ETF: $47.90; stop-loss for the DUST ETF $8.11
In case one wants to bet on junior mining stocks' prices (we do not suggest doing so – we think senior mining stocks are more predictable in the case of short-term trades – if one wants to do it anyway, we provide the details), here are the stop-loss details and initial target prices:
- GDXJ ETF: initial target price: $14.13; stop-loss: $40.13
- JDST ETF: initial target price: $61.74; stop-loss: $9.38
Long-term capital (our opinion): No positions
Insurance capital (our opinion): Full position
Plus, you might want to read why our stop-loss orders are usually relatively far from the current price.
Please note that a full position doesn’t mean using all of the capital for a given trade. You will find details on our thoughts on gold portfolio structuring in the Key Insights section on our website.
As a reminder – “initial target price” means exactly that – an “initial” one, it’s not a price level at which we suggest closing positions. If this becomes the case (like it did in the previous trade) we will refer to these levels as levels of exit orders (exactly as we’ve done previously). Stop-loss levels, however, are naturally not “initial”, but something that, in our opinion, might be entered as an order.
Since it is impossible to synchronize target prices and stop-loss levels for all the ETFs and ETNs with the main markets that we provide these levels for (gold, silver and mining stocks – the GDX ETF), the stop-loss levels and target prices for other ETNs and ETF (among other: UGLD, DGLD, USLV, DSLV, NUGT, DUST, JNUG, JDST) are provided as supplementary, and not as “final”. This means that if a stop-loss or a target level is reached for any of the “additional instruments” (DGLD for instance), but not for the “main instrument” (gold in this case), we will view positions in both gold and DGLD as still open and the stop-loss for DGLD would have to be moved lower. On the other hand, if gold moves to a stop-loss level but DGLD doesn’t, then we will view both positions (in gold and DGLD) as closed. In other words, since it’s not possible to be 100% certain that each related instrument moves to a given level when the underlying instrument does, we can’t provide levels that would be binding. The levels that we do provide are our best estimate of the levels that will correspond to the levels in the underlying assets, but it will be the underlying assets that one will need to focus on regarding the sings pointing to closing a given position or keeping it open. We might adjust the levels in the “additional instruments” without adjusting the levels in the “main instruments”, which will simply mean that we have improved our estimation of these levels, not that we changed our outlook on the markets. We are already working on a tool that would update these levels on a daily basis for the most popular ETFs, ETNs and individual mining stocks.
Our preferred ways to invest in and to trade gold along with the reasoning can be found in the how to buy gold section. Additionally, our preferred ETFs and ETNs can be found in our Gold & Silver ETF Ranking.
As always, we'll keep you - our subscribers - updated should our views on the market change. We will continue to send out Gold & Silver Trading Alerts on each trading day and we will send additional Alerts whenever appropriate.
The trading position presented above is the netted version of positions based on subjective signals (opinion) from your Editor, and the Tools and Indicators.
As a reminder, Gold & Silver Trading Alerts are posted before or on each trading day (we usually post them before the opening bell, but we don't promise doing that each day). If there's anything urgent, we will send you an additional small alert before posting the main one.
=====
Latest Free Trading Alerts:
Recent Manufacturing Data and Gold
Last week, important reports on industrial production were released. What do they mean for the gold market?
Bitcoin Trading Alert: Bitcoin Stays below $450
We saw a move below $450 on Thursday and both the magnitude and the volume of the move were significant in comparison to what we had seen before. What implications might this move have for the Bitcoin market?
Forex Trading Alert: Will EUR/USD Continue Declines?
Earlier today, the German ZEW showed that its economic sentiment index declined sharply to 6.4 in May, missing expectations for an increase to 12. Thanks to these disappointing reading, the euro moved lower against the greenback and approached the next support zone. Will it stop further declines in the coming days.
=====
Hand-picked precious-metals-related links:
Get into gold now! Prices could hit $1,900: Boockvar
Gold drops to 7-week low on Fed rate hike prospects
=====
In other news:
Russia 'frees Ukrainian prisoner Savchenko in swap'
Signals from the U.S. Yield Curve: World Can’t Handle Fed Rate Hikes
=====
Thank you.
Sincerely,
Przemyslaw Radomski, CFA
Founder, Editor-in-chief, Gold & Silver Fund Manager
Gold & Silver Trading Alerts
Forex Trading Alerts
Oil Investment Updates
Oil Trading Alerts

