

Briefly: In our opinion small (half of the regular size) speculative long positions are currently justified from the risk/reward point of view.
Gold declined last week as the USD Index rallied and investors changed their views on the likelihood that the interest rates will be increased next month. What’s going to be the next big move?
In our opinion, the really big move is most likely to be to the downside, but a move higher before the decline starts still appears to be in the cards.
In Thursday’s and Friday’s alerts we wrote the following:
If we get a confirmed breakdown below the above, we might re-open the short positions, but it’s more likely that we’ll see a pullback in the USD and a corrective upswing in metals and miners. Ideally, we would then like to see a move higher in metals and miners on low volume ending with daily outperformance of silver.
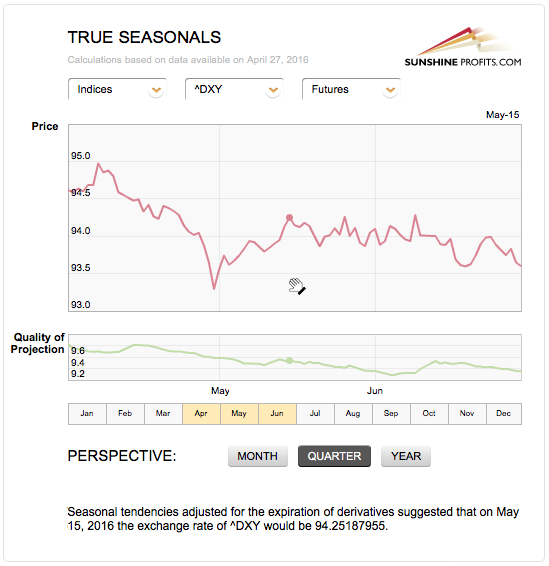
What we saw yesterday [on Thursday] was the opposite of the above. We saw quick and sharp underperformance in the case of silver, outperformance in mining stocks and strength in them. We additionally have a reversal in gold and the USD is practically right at its resistance levels, and the True Seasonal patterns favor a corrective downswing in the USD and a corrective rally in metals and miners.
On Friday, the metals and the USD more or less repeated the above, so the implications remain in place. Let’s take a closer look (charts courtesy of http://stockcharts.com).
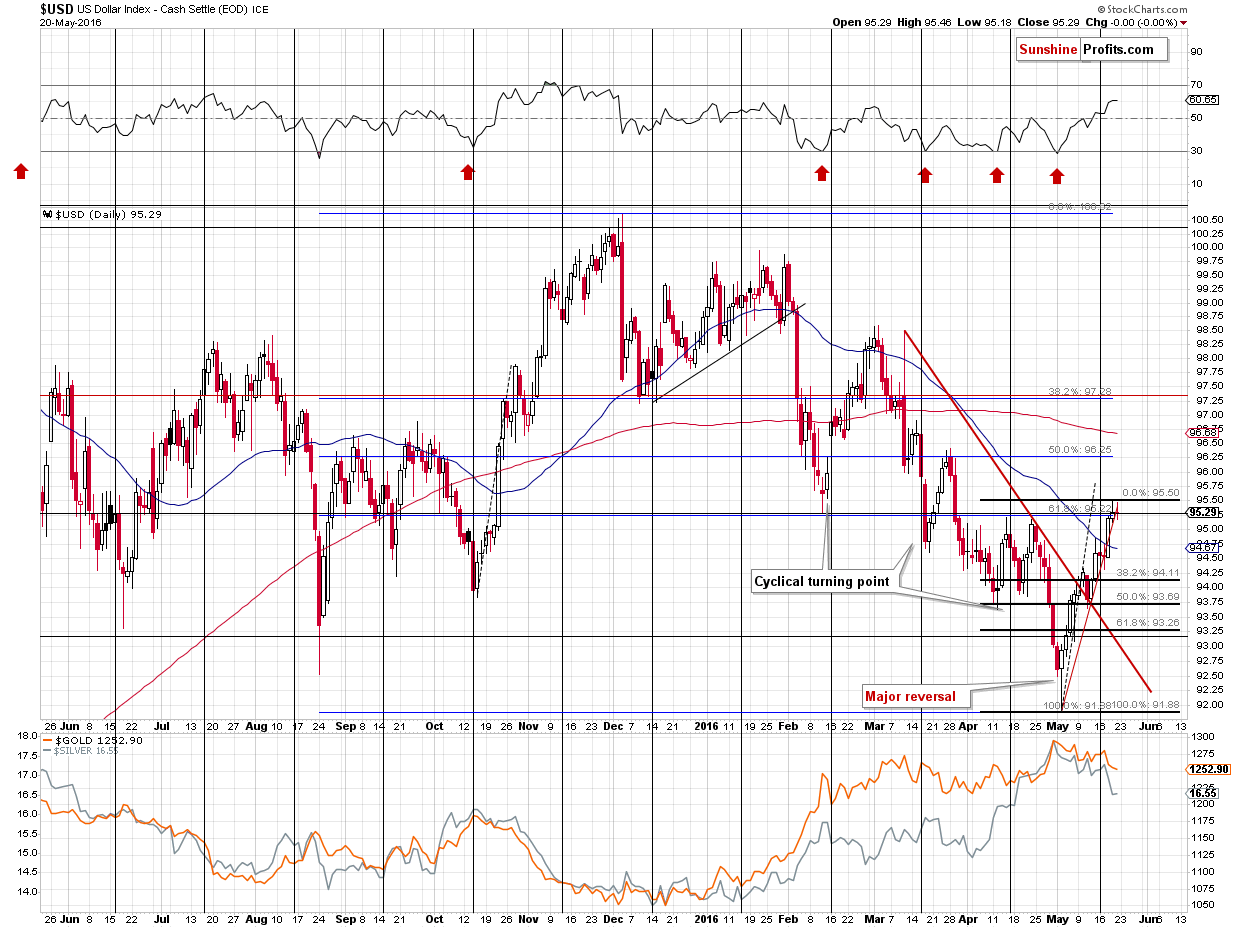
On Thursday, the USD Index rallied and closed only slightly above the April highs and formed a shooting start (reversal) candlestick. This suggested that the breakout will be invalidated shortly and that a move lower will follow. On Friday, we saw another attempt to move higher, but the USD finally closed more or less unchanged. The intra-day high was lower than the one on Thursday. Overall, since nothing really changed, the implications of Thursday’s session remain in place.
Even more importantly, the USD encountered another resistance – the 38.2% Fibonacci retracement level based on the entire December 2015 – May 2016 decline. This makes a corrective downswing quite likely from here, especially given the current seasonal tendencies for the USD Index.
How low is the USD Index likely to correct? Most likely to the 94 level – that’s where we currently have the 38.2% Fibonacci retracement (and this technique tends to work particularly well for currencies) and that’s more or less the level to which the USD declined after topping in April.
Moreover, since the USD Index had such a quick run-up this month, it’s simply natural to expect some kind of correction.
Again, we don’t think that the move lower would be anything more than just a pullback – we remain bullish on the USD Index also for the medium term.
Why is the latter the case?
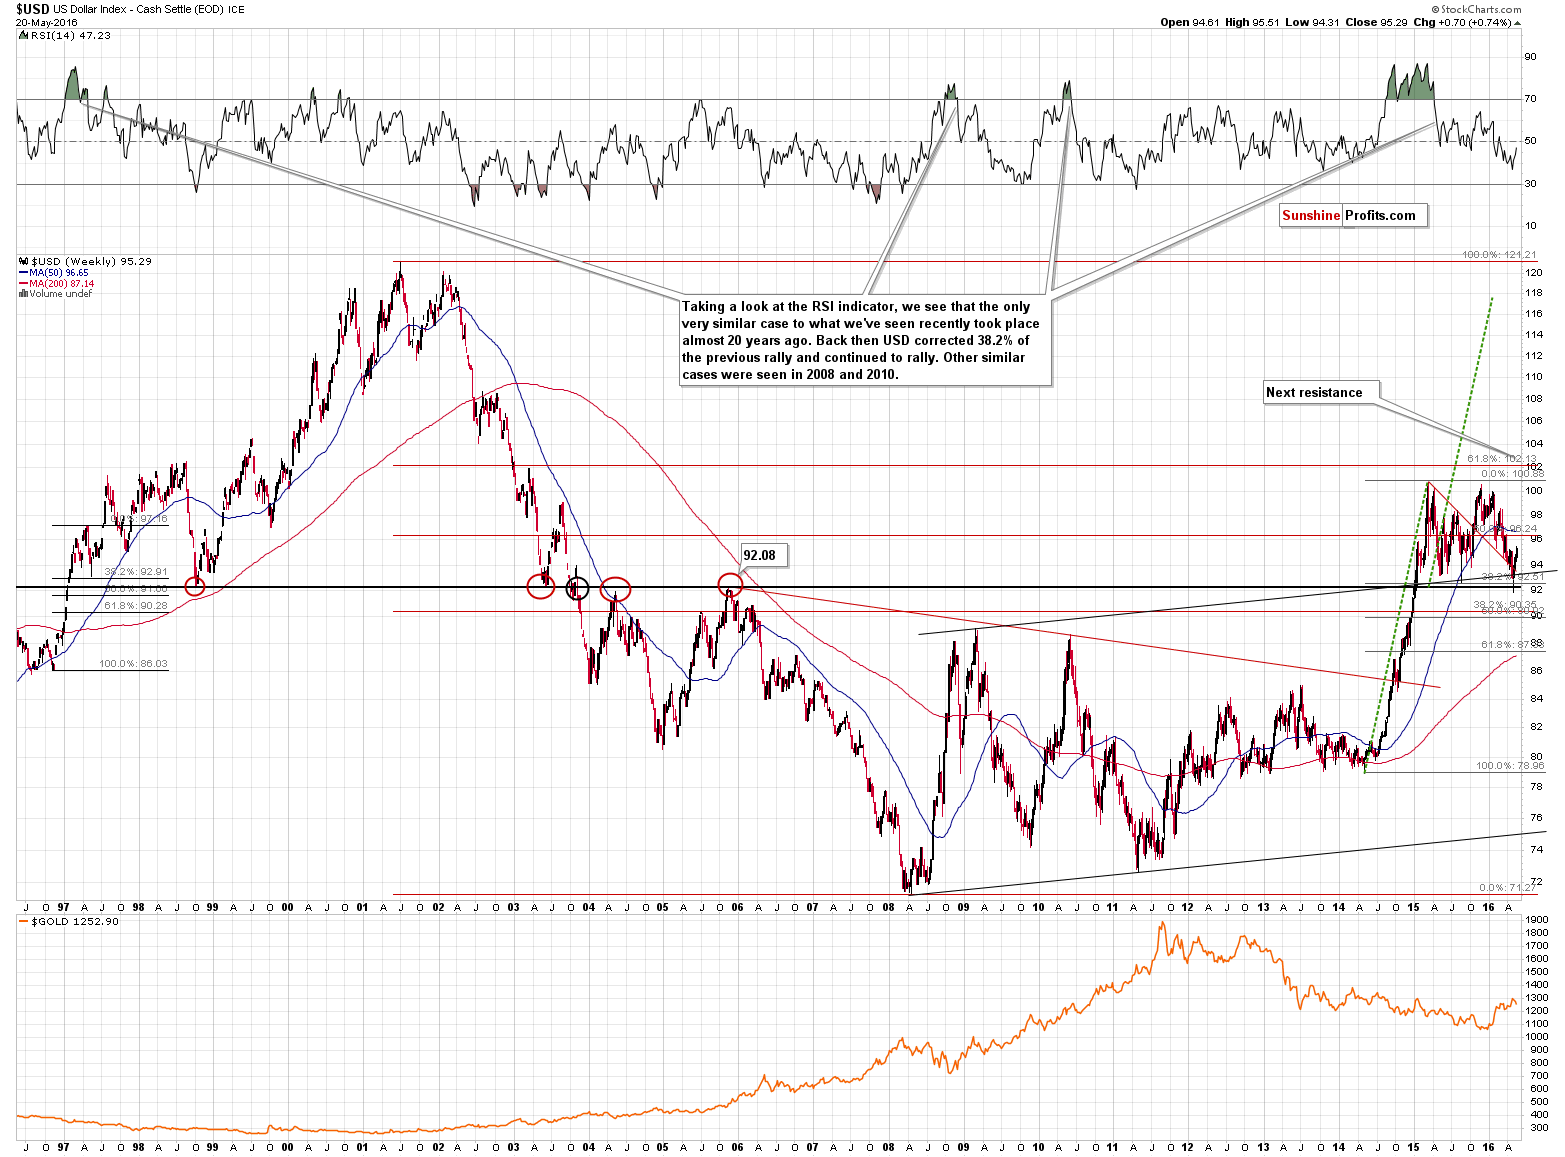
Because the long-term chart clearly remains bullish. The USD Index seems to have finished a big (more than a year long) correction and is ready to rally much higher. This chart is also good for showing that changes in interest rates don’t have to be seen for major moves to materialize. Were the rates increased in 2014? No, and yet the USD Index managed to soar very significantly in the second half of the year.
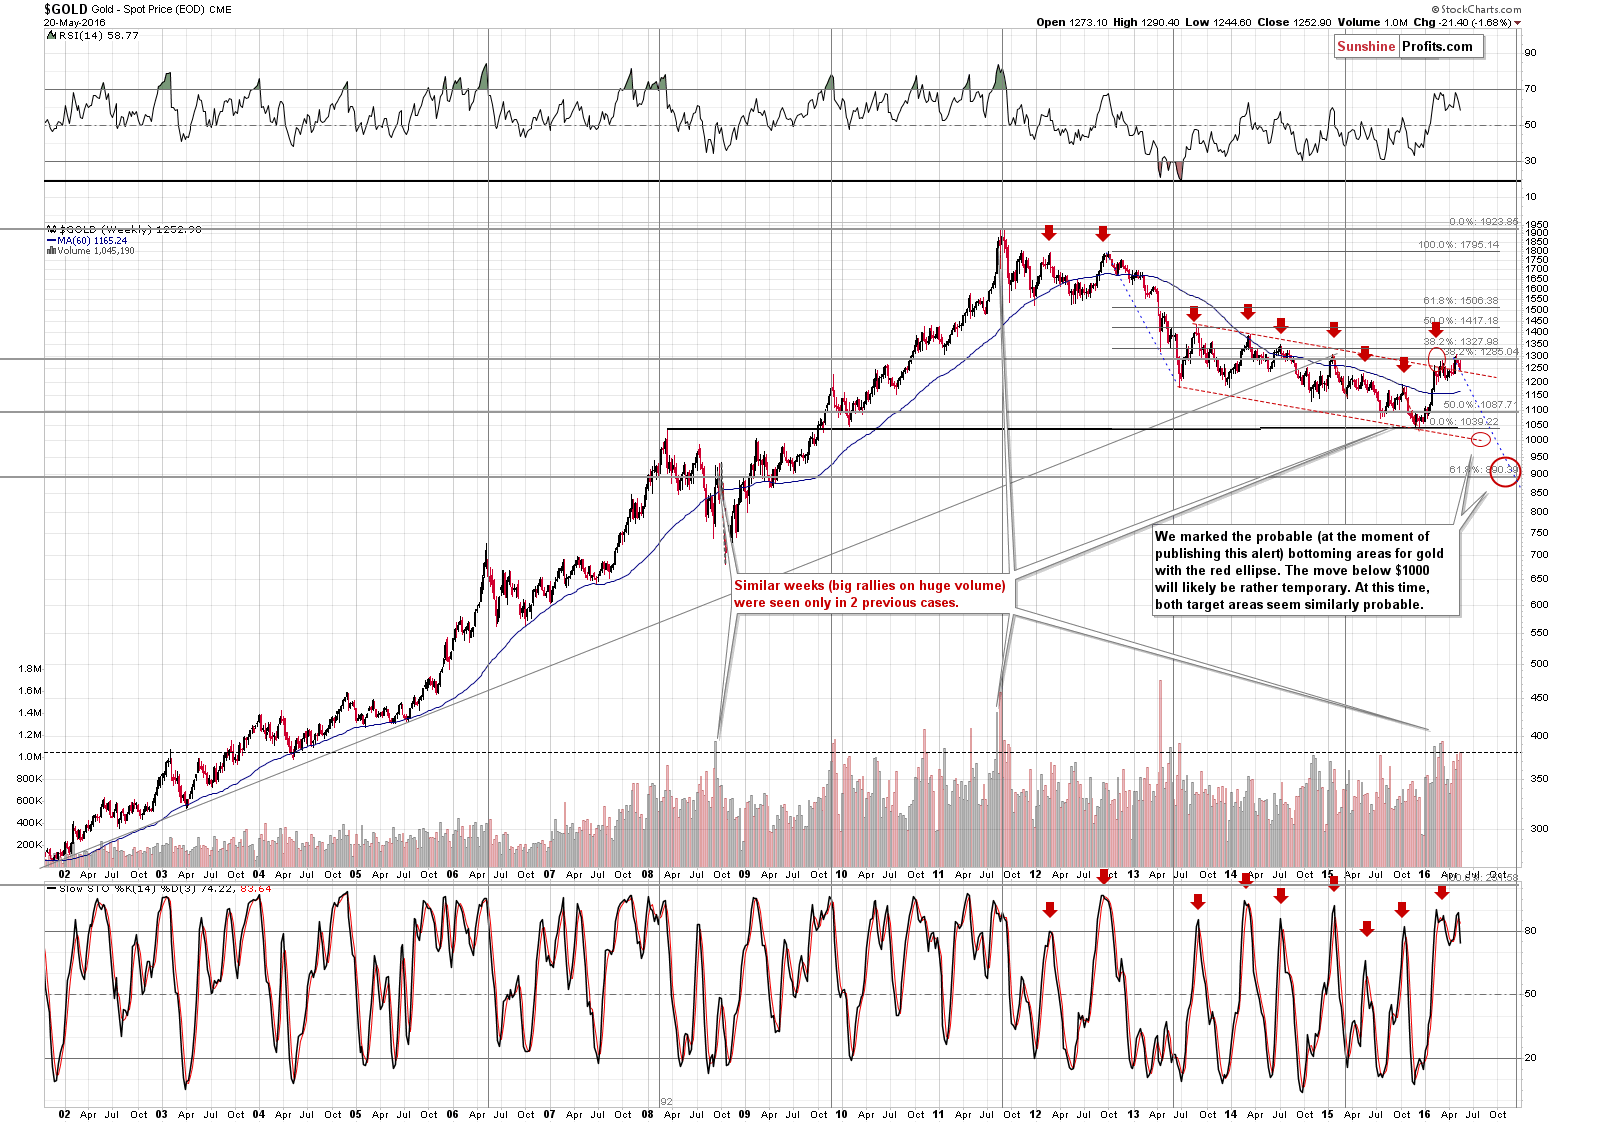
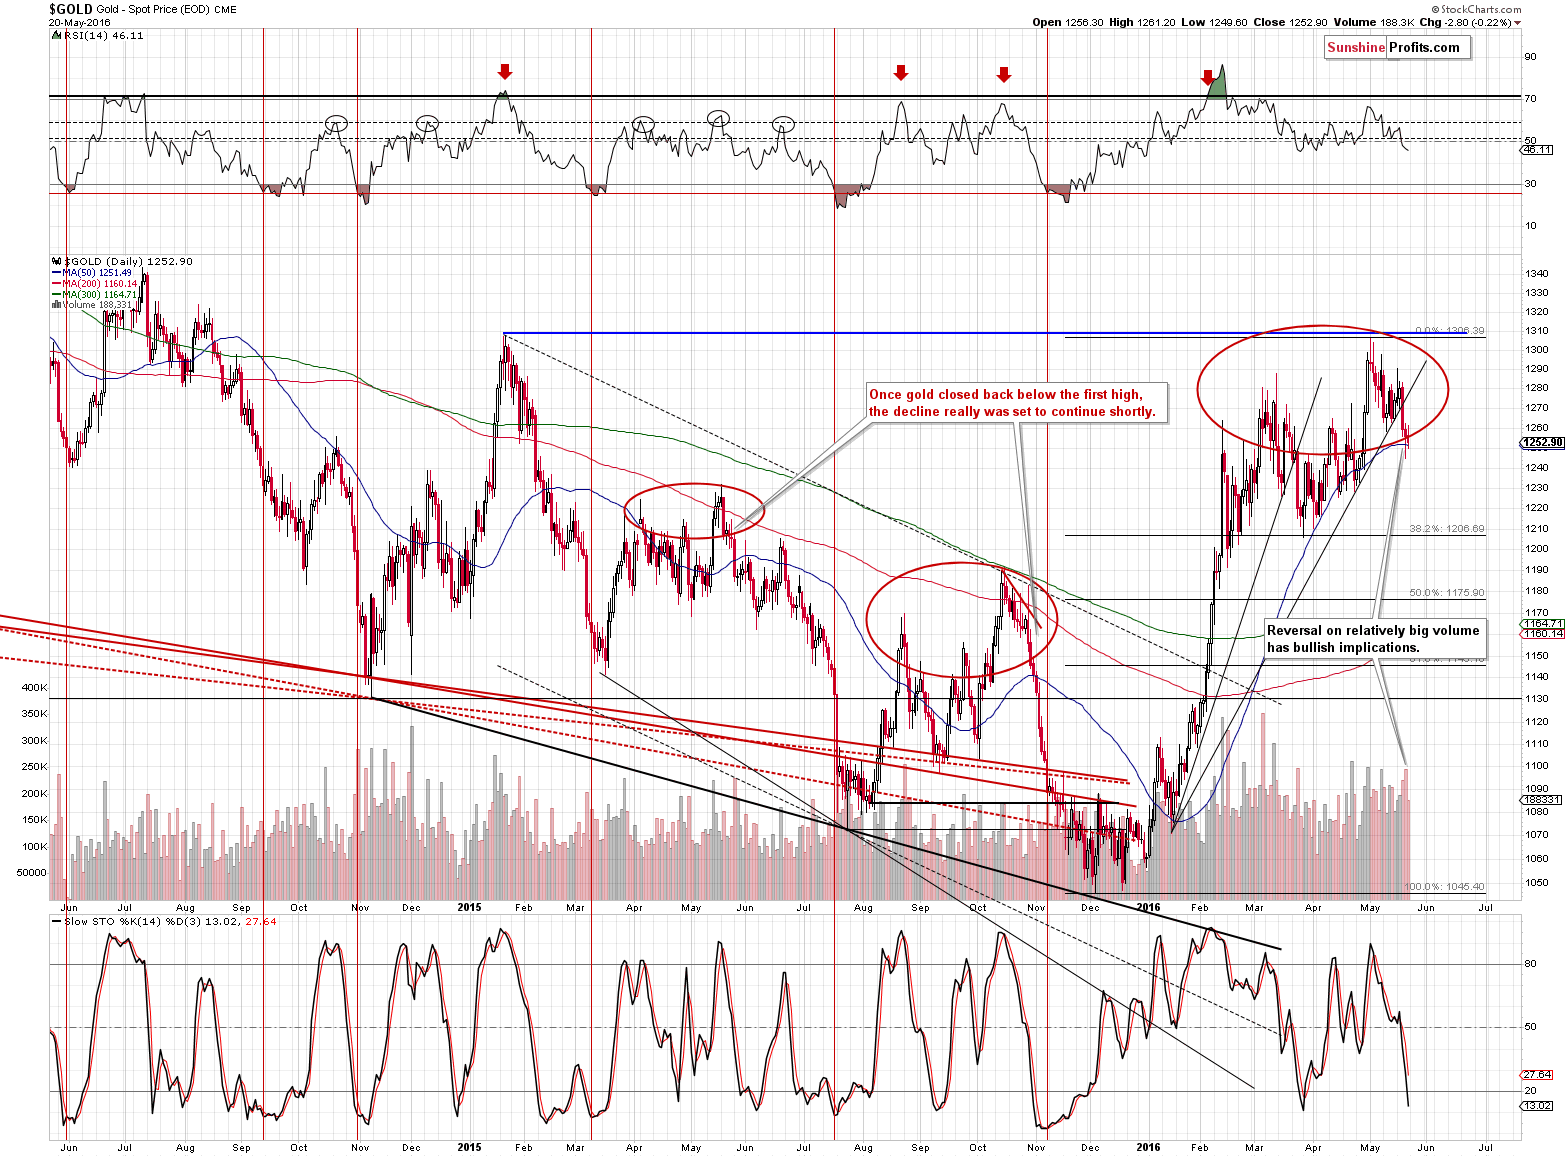
Gold moved and closed the week more or less at the upper border of the declining trend channel, so we could see a correction based on that. The main trend remains down, though and the sell signal from the Stochastic indicator based on weekly closing prices confirms it.
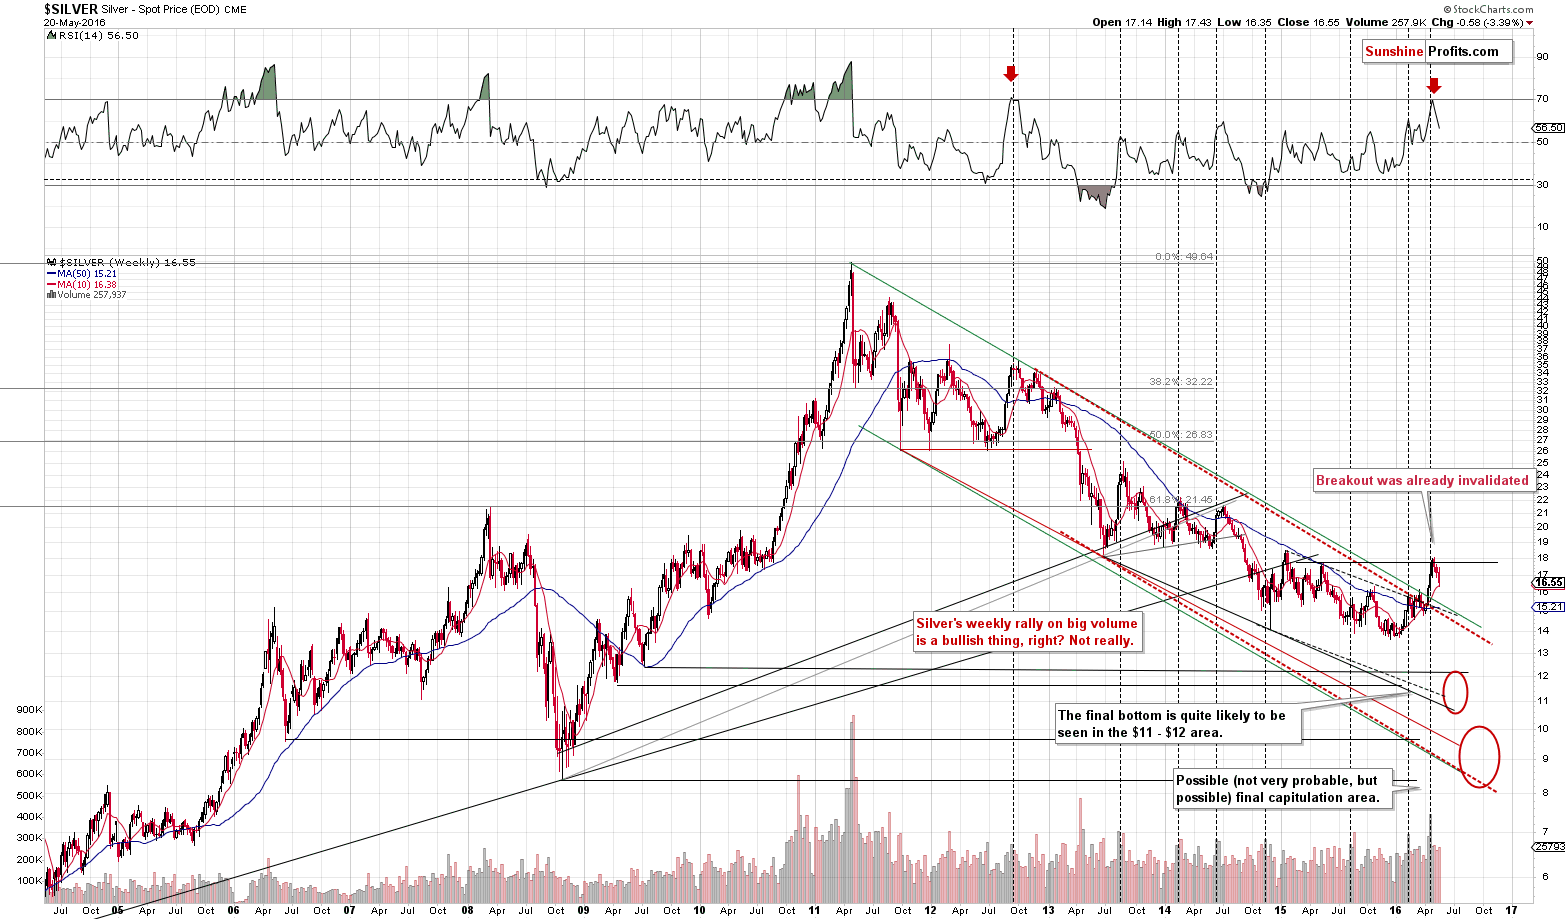
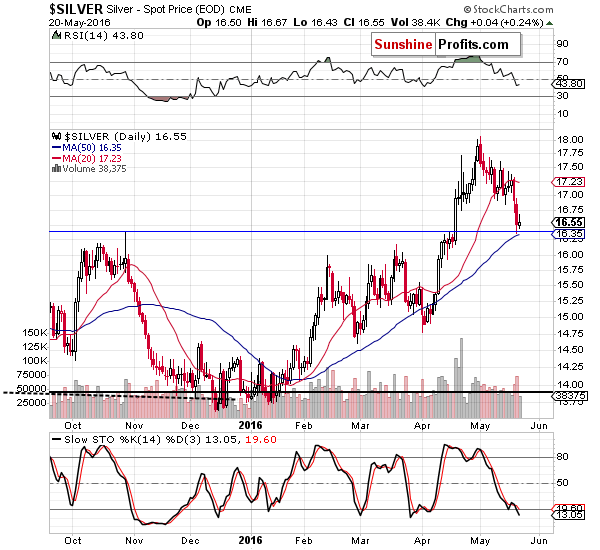
We see that silver declined more than the rest of the sector, but that’s not necessarily a bearish sign. Silver closed the week very close to its 50-day moving average, which could trigger a corrective bounce, but is not likely to change the main trend.
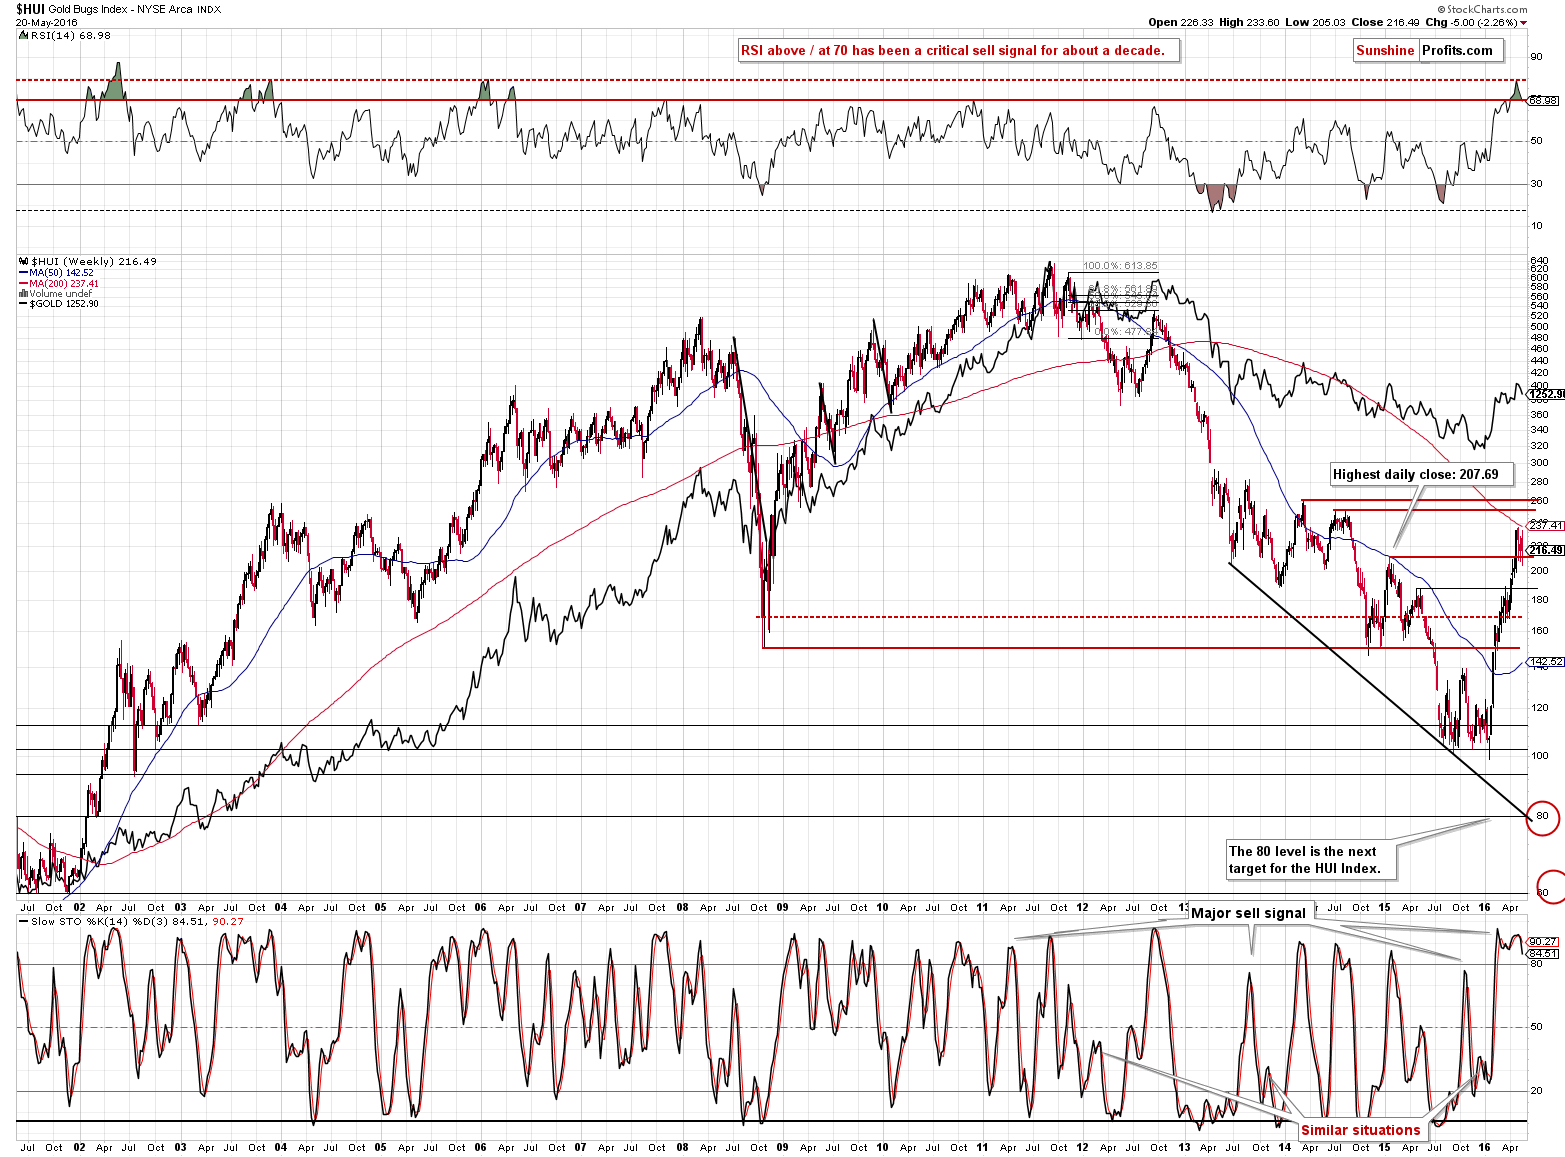
We don’t view the HUI’s breakout above the 2015 high as confirmed either as once again (the same was the case last week) we saw an intra-day move back below the intra-day high of 2015, so in a way the breakout was invalidated. It wasn’t the case when looking at daily closing prices, though, so the outlook didn’t deteriorate, but we wouldn’t say that it improved either.
Given the lack of action on Friday, our previous comments on the short-term charts remain up-to-date:
Gold and silver both declined on significant volume yesterday after having moved higher on relatively low volume. Both markets confirm that the current big move is down. So, have we missed entering at the top? Most likely – based on the situation in the USD Index – no, but even if that is the case, the vast majority of the decline is still ahead. Moving back to the short-term outlook, metals didn’t show that they stopped responding to the USD’s signals yesterday – they declined as the USD rallied, nothing more.
Silver underperformed in a clear way yesterday, which is the opposite of the bearish confirmation that we wanted to see as a bearish confirmation – we just saw a bullish one.
Moreover, silver didn’t stop at some random level – it stopped at the October 2015 high. Consequently, we might expect a corrective bounce here.
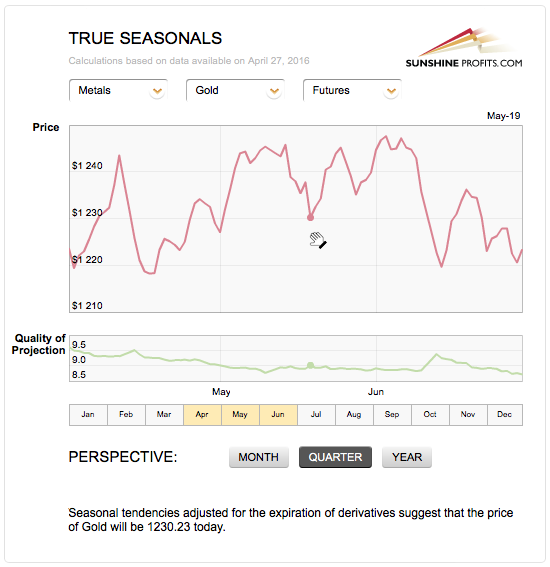
The True Seasonal patterns for gold suggest that a short-term bottom was just formed and a second-half-of-May corrective upswing is coming. Will the gold market wait with the decline until early June? Possibly, but if we see strong bearish confirmations (like silver’s short-term outperformance) within a week or so, we will not wait until next month to re-enter the short positions.
At this time, silver’s performance and other signals point to higher prices in the short term, not lower ones.
As far as mining stocks are concerned, we wrote the following yesterday:
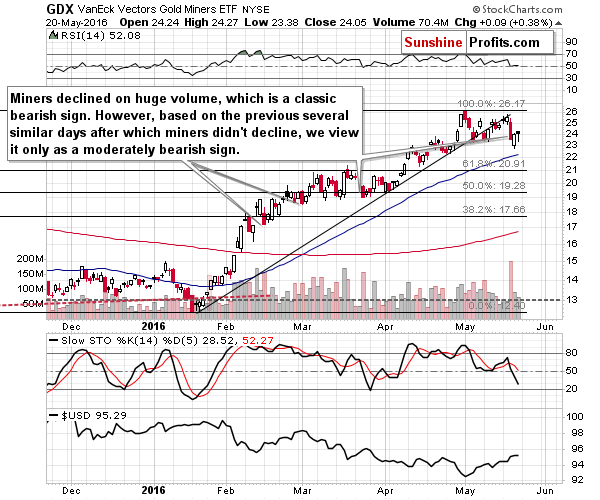
Miners plunged on huge volume. This is a classic bearish sign, however, based on the previous several similar days after which miners didn't decline, we view it only as a moderately bearish sign, especially that miners didn’t move below their May lows (let alone both April highs).
If we get a confirmed breakdown below the above, we might re-open the short positions, but it’s more likely that we’ll see a pullback in the USD and a corrective upswing in metals and miners.
The history repeated itself and instead of the “classic” decline, the big decline was followed by a significant reversal. Mining stocks’ strong performance is even more significant given that both gold and the general stock market finally closed lower.
The breakdown below the previous May lows was not only not confirmed – it was quickly invalidated.
There are two additional – and important – things that make us think that corrections in the USD and metals are likely to be seen.
On Friday, mining stocks refused to move lower as well, ending the session a bit higher, despite declines early in the session.
The breakdown in the gold to oil ratio continues to have important implications for the following weeks and months:
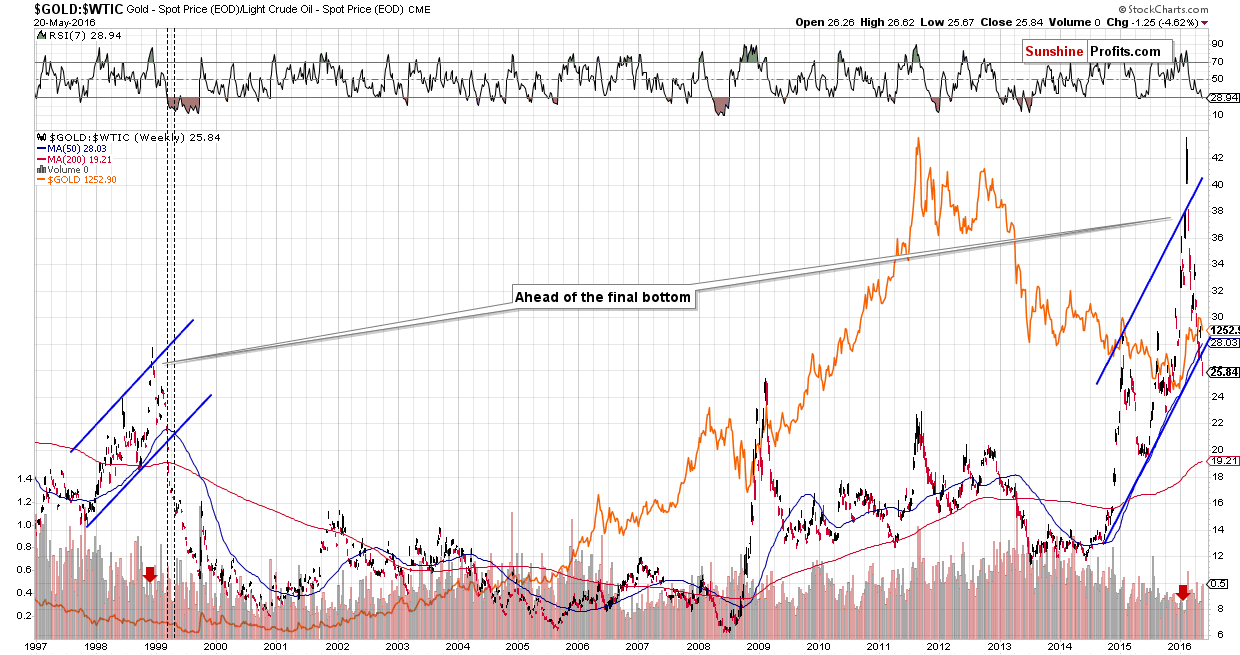
Several weeks ago we featured this ratio (when it moved above the upper border of the trend channel) and we wrote that this breakout was likely to be invalidated and that it was something that indicated that the final bottom was likely still ahead. The breakout was indeed invalidated and we just saw a breakdown in the ratio. There was only one similar case to the current one – 1999.
What happened previously? Gold moved somewhat higher and after a few weeks the final decline – to the final lows – started. This scenario appears quite likely based on the signals that we have right now in other short- and long-term charts.
Another thing that we would like to cover is the issue of a possible interest rate hike in June. This issue is quite controversial as on the same day we received 2 e-mails: one from a subscriber that was 100% sure that there would be no rate hike before the Brexit is decided, and a second one asking if we are crazy not shorting the market yet as the Fed will raise rates in June or July.
As we wrote recently, nothing really changed regarding the issue of interest rates. An interest rate hike in June is unlikely (but not impossible), but the key thing is that an increase in the rates is not required for gold to move lower, just like it was not necessary for gold to slide from $1,900 to $1,300.
Moving back to the short-term issues, people have just reacted to news (the FOMC minutes) that was released recently, but in fact, was something that reflected a past meeting – so, it was already outdated and, in light of the weak data that we saw after the meeting, the Fed’s approach could have changed. You will find more details in this article. So, what happened that was irrational in light of the above and as such, is likely to be reversed? On a short-term basis (again, this doesn’t change the main trend), it was the decline in metals that was most likely the exaggeration. Consequently, the move lower is likely to be reversed in the following days (again, the medium-term downtrend is not likely to be affected).
Before summarizing, we would like to reply to the question that we were asked this week – “what would change our mind regarding the medium-term trend”. In other words, what would make us think that getting back in the precious metals market with the long-term investment capital was justified from the risk to reward point of view (which in a way corresponds to calling the bottom, but is a much more researched and – over time – profitable approach).
Unfortunately, there are too many combinations of factors that could result in the change of the approach and it is not possible to list all of them, but we’ll list a few of them:
- The USD Index could break and confirm the breakdown below the 91 and gold, silver and mining stocks would respond to this breakdown by rallying strongly – this would likely change the outlook regardless of what happens in other markets.
- The USD Index would keep on rallying and the precious metals sector would start to rally along with it and this would be seen for at least a few weeks. In this case, we would also need to see a confirmation in the form of a breakout in gold (at least above $1,327, preferably above $1,417) and a breakout in silver (above $18.50, preferably above $21.50).
- Metals and miners continue to decline, gold moves below $1,000 – or even below $900, silver moves below $12, or even below $10 and the HUI Index moves to about 80, or even 60 and we get a confirmation in the form of massive hate toward the precious metals sector in the media (we can currently read quite bullish articles). In this, most likely, scenario it is important to monitor the USD Index as the bottom in metals or miners is likely to be seen along with a top (either a final or a temporary one) in the USD Index. This could be preceded by the metals’ lack of reaction (or a limited one) to gains in the USD.
- The USD Index does nothing special form the long-term point of view (no breakout above 100 and no breakdown below 91) but metals and miners continue to rally and gold and silver confirm breakouts above $1,417 and $21.50, respectively. This would need to be confirmed by signs from volume, other markets and ratios.
Summing up, the medium-term outlook for the precious metals sector remains bearish, however, it seems that a corrective upswing is quite likely to be seen shortly. Consequently, we think that small speculative long positions are now justified from the risk to reward point of view, but we continue to think that there will be a better opportunity to enter the market with the long-term investment capital than the current situation.
Only a small long position is justified as ultimately it is a position against the medium-term trend and thus it is quite risky.
We are moving the stop-loss level for silver a bit lower as the white metal moved lower in today’s pre-market trading. If the position was closed, it seems that re-opening it with a stop-loss a bit lower is justified from the risk to reward point of view.
As always, we will keep you – our subscribers – updated.
To summarize:
Trading capital (our opinion): Long positions (50% of the full position) in gold, silver and mining stocks are justified from the risk/reward perspective with the following stop-loss orders and initial target price levels:
- Gold: initial target price: $1,296; stop-loss: $1,238, initial target price for the UGLD ETN: $12.78; stop-loss for the UGLD ETN $11.17
- Silver: initial target price: $17.58; stop-loss: $16.13, initial target price for the USLV ETN: $18.23; stop-loss for the USLV ETN $14.06
- Mining stocks (price levels for the GDX ETF): initial target price: $26.08; stop-loss: $22.88, initial target price for the NUGT ETF: $110.91; stop-loss for the NUGT ETF $76.76
In case one wants to bet on junior mining stocks' prices (we do not suggest doing so – we think senior mining stocks are more predictable in the case of short-term trades – if one wants to do it anyway, we provide the details), here are the stop-loss details and initial target prices:
- GDXJ ETF: initial target price: $39.60; stop-loss: $34.23
- JNUG ETF: initial target price: $175.32; stop-loss: $114.24
Long-term capital (our opinion): No positions
Insurance capital (our opinion): Full position
Plus, you might want to read why our stop-loss orders are usually relatively far from the current price.
Please note that a full position doesn’t mean using all of the capital for a given trade. You will find details on our thoughts on gold portfolio structuring in the Key Insights section on our website.
As a reminder – “initial target price” means exactly that – an “initial” one, it’s not a price level at which we suggest closing positions. If this becomes the case (like it did in the previous trade) we will refer to these levels as levels of exit orders (exactly as we’ve done previously). Stop-loss levels, however, are naturally not “initial”, but something that, in our opinion, might be entered as an order.
Since it is impossible to synchronize target prices and stop-loss levels for all the ETFs and ETNs with the main markets that we provide these levels for (gold, silver and mining stocks – the GDX ETF), the stop-loss levels and target prices for other ETNs and ETF (among other: UGLD, DGLD, USLV, DSLV, NUGT, DUST, JNUG, JDST) are provided as supplementary, and not as “final”. This means that if a stop-loss or a target level is reached for any of the “additional instruments” (DGLD for instance), but not for the “main instrument” (gold in this case), we will view positions in both gold and DGLD as still open and the stop-loss for DGLD would have to be moved lower. On the other hand, if gold moves to a stop-loss level but DGLD doesn’t, then we will view both positions (in gold and DGLD) as closed. In other words, since it’s not possible to be 100% certain that each related instrument moves to a given level when the underlying instrument does, we can’t provide levels that would be binding. The levels that we do provide are our best estimate of the levels that will correspond to the levels in the underlying assets, but it will be the underlying assets that one will need to focus on regarding the sings pointing to closing a given position or keeping it open. We might adjust the levels in the “additional instruments” without adjusting the levels in the “main instruments”, which will simply mean that we have improved our estimation of these levels, not that we changed our outlook on the markets. We are already working on a tool that would update these levels on a daily basis for the most popular ETFs, ETNs and individual mining stocks.
Our preferred ways to invest in and to trade gold along with the reasoning can be found in the how to buy gold section. Additionally, our preferred ETFs and ETNs can be found in our Gold & Silver ETF Ranking.
As always, we'll keep you - our subscribers - updated should our views on the market change. We will continue to send out Gold & Silver Trading Alerts on each trading day and we will send additional Alerts whenever appropriate.
The trading position presented above is the netted version of positions based on subjective signals (opinion) from your Editor, and the Tools and Indicators.
As a reminder, Gold & Silver Trading Alerts are posted before or on each trading day (we usually post them before the opening bell, but we don't promise doing that each day). If there's anything urgent, we will send you an additional small alert before posting the main one.
=====
Latest Free Trading Alerts:
Stock Trading Alert: Stocks Extended Their Rebound On Friday - Will They Continue Higher?
S&P 500 index extended its Thursday's rebound on Friday, as investors' sentiment further improved. Is this a new uptrend or just an upward correction following April - May move down?
The gold standard has been making headlines recently. What does it mean for the gold market?
=====
Hand-picked precious-metals-related links:
This could send gold tumbling below $1,000 again, Citi says
Buy gold ... but only after this happens: Gartman
=====
In other news:
Russia and Vladimir Putin sued over downing of MH17 over Ukraine
China’s growth problems will not be cured by retail therapy
=====
Thank you.
Sincerely,
Przemyslaw Radomski, CFA
Founder, Editor-in-chief, Gold & Silver Fund Manager
Gold & Silver Trading Alerts
Forex Trading Alerts
Oil Investment Updates
Oil Trading Alerts

