

Briefly: In our opinion, speculative short positions (150% of the full position) in gold and silver and small (50% of the full position) short position in mining stocks are justified from the risk/reward point of view.
Yesterday, mining stocks did not only join the metals in their decline – they were declining much faster. Just when everyone thought that miners could only go up – they are down 10% so far this week. Still, miners haven’t moved below their 2015 high just yet, so what we saw could still be just a verification of the breakout. What’s next?
The outlook didn’t change yesterday and our reply to the above question remains unchanged as well:
The decline in the precious metals sector is likely to continue as the signals that we saw (for instance, the sell signal generated by the RSI in the silver to gold ratio) were not of short-term, but medium-term meaning.
Let’s take a closer look at what happened yesterday and discuss what’s happening today (charts courtesy of http://stockcharts.com).
In yesterday’s alert, we wrote the following:
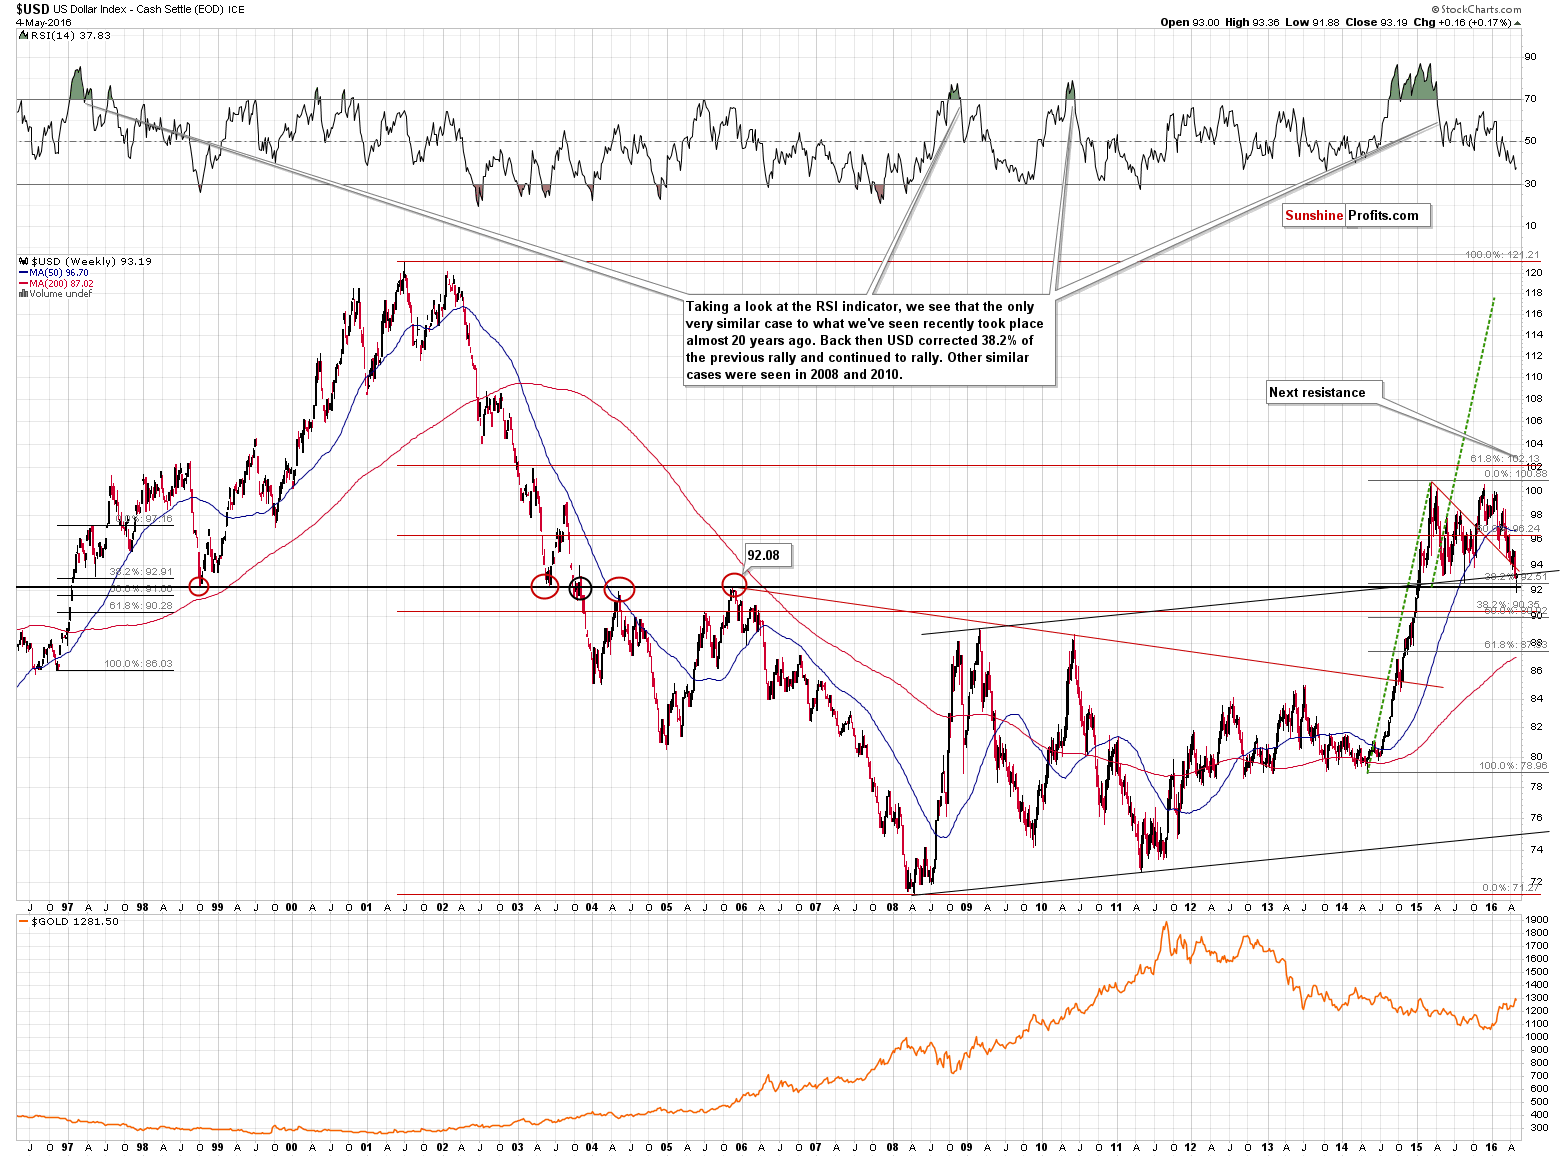
The second thing is even more important for us, precious metals investors. Please note that this year’s move higher in gold (lower part of the chart) has been a reflection of the decline in the USD Index. It was not until the USD Index started to slide that gold started to rally. Gold is now a bit (from the long-term perspective) below the level it reached in early 2015 and USD is a bit above this level. More or less what’s been going on in gold within the past year or so can be explained by the moves in the USD Index. Why is this so important? Because the very limited potential for additional declines in the USD Index implies very limited (again, from the long-term perspective) potential for a move higher in gold.
In early 2015, USD broke through all these important resistances in a sharp, volatile fashion and the fact that it’s been consolidating for many months is not surprising – it’s quite natural. Was the breakout invalidated? No. Are the support levels close? Yes. This means that the USD Index is likely to rally – if not right away, then relatively soon. This means that gold is likely to decline – and decline significantly, just as the USD Index is likely to rally significantly. The moves that follow consolidations tend to be similar to the moves that preceded it and this provides with an upside target of 118 in the USD Index.
(…)
With the situation in the USD Index being as it is, being invested in the precious metals market appears very risky.
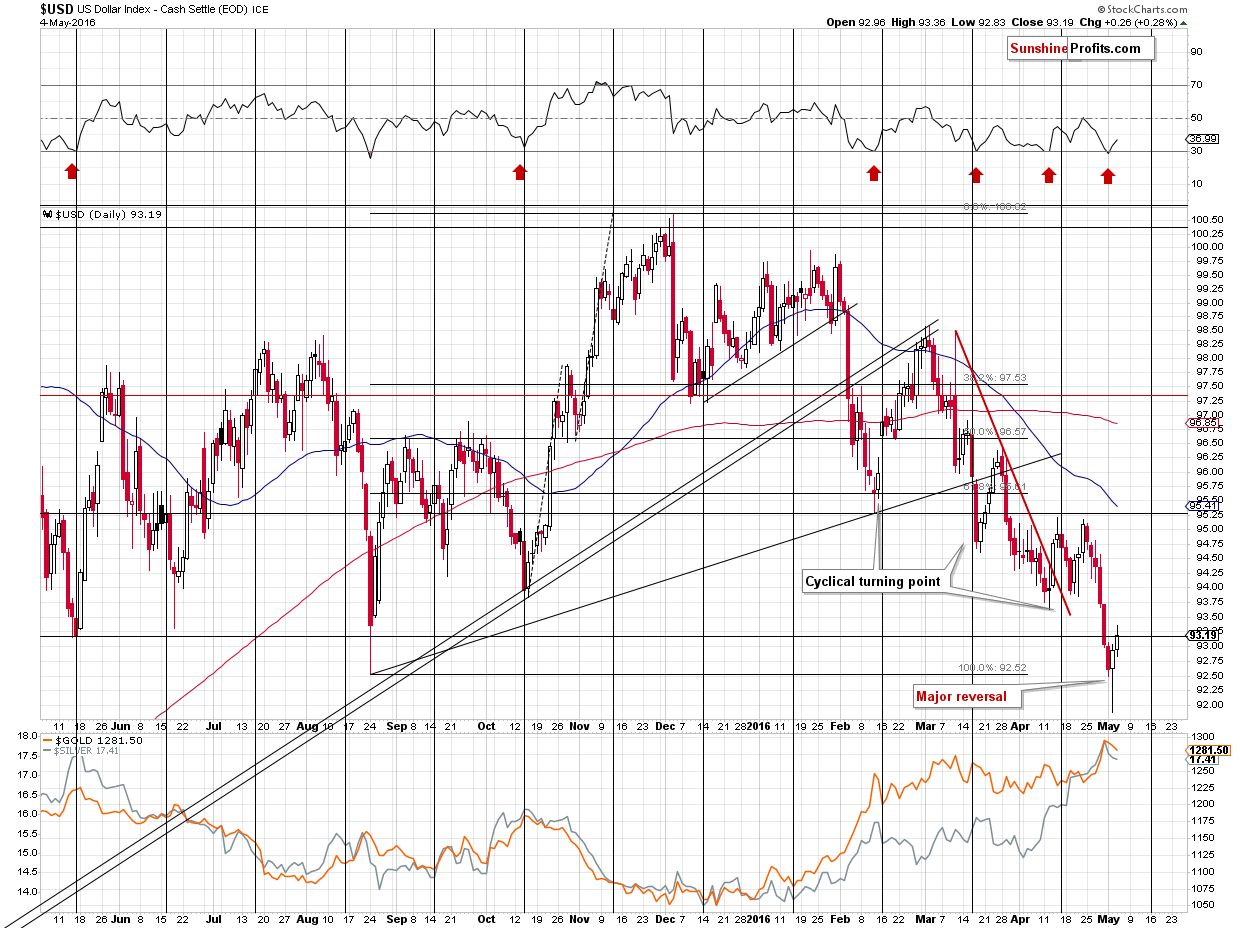
Moreover, please note that while USD is well below its early-March low, gold is only a little above its early-March high. Gold is not responding to USD’s decline strongly, which suggests that gold “wants” to decline, but declining USD is not “allowing” it to.
The USD Index moved briefly below 92 today only to rise back above it later on. This means that the lowest of the above-mentioned support levels was reached, temporarily broken and then we saw this breakouts invalidation. This is a bullish combination.
When we wrote the above, the USD was only a little above 92 and it managed to close at almost 93, reversing in a clear, very important, and bullish way. Moreover, the USD continued to move higher today and is at 93.12 at the moment of writing these words (about a full index point higher than 24 hours ago).
The level that was reached and temporarily broken is also very important. That was the final of the strong, long-term support levels, which means that it is very likely that the decline is now over. This, of course, doesn’t guarantee there will be no additional daily downswings, but it’s unlikely that we would see a move below this week’s low anytime soon.
As of this moment, the USD Index moved (a little, but still) higher this week and gold declined about $17. The implications for the precious metals sector are bearish.
Based on this week’s reversal and the subsequent rally, the most important breakdowns were invalidated and the situation is improving virtually every hour. The final of the breakdowns that we would like to see invalidated is the one below the declining red support line. With the USD Index at 93.5 (at the moment of writing these words) it looks like the mentioned final breakdown is going to be invalidated this week. This would in turn send a powerful buy signal to many market participants.
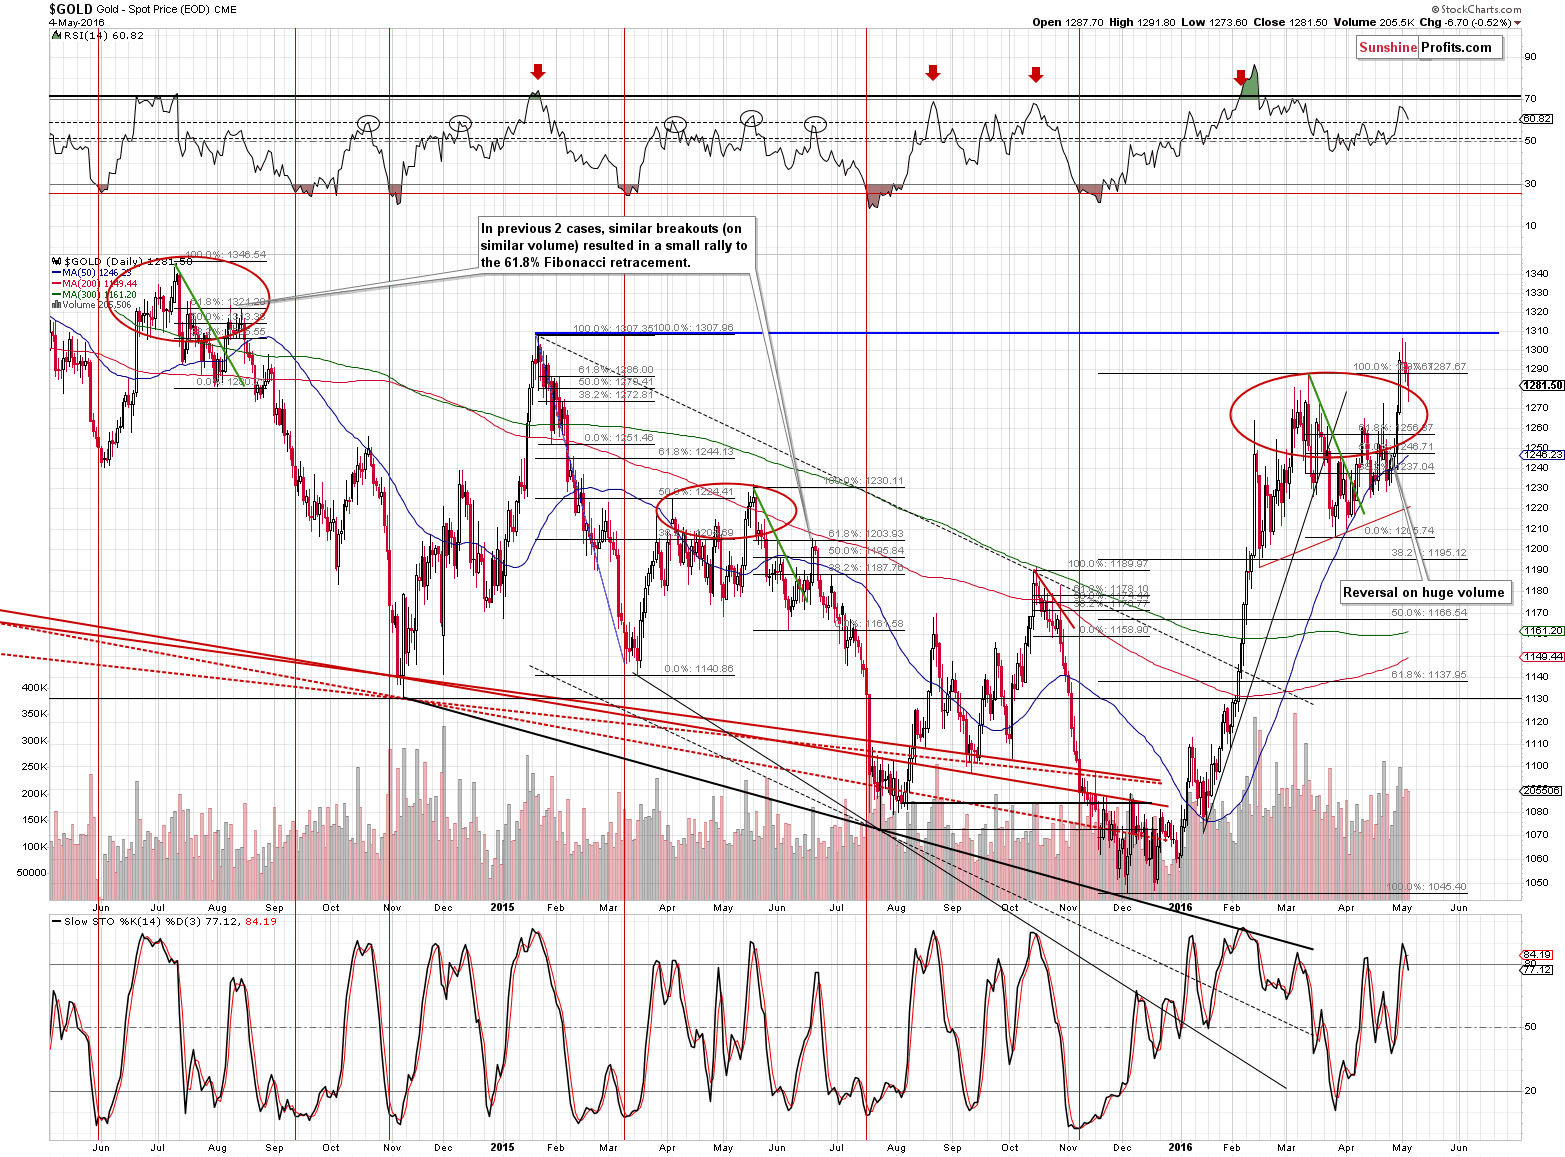
Gold declined yesterday, but the decline was not huge – the yellow metal didn’t close the day below the March high, so we didn’t get an additional sell signal. Consequently, our previous comments remain up-to-date:
(…) Once we see a close below the highest close of March ($1,273.10), more traders will view the breakout as invalidated and will likely close long positions and open short ones, thus contributing to the acceleration in the decline. We don’t think that waiting for this sign is necessary in light of the bearish signs that we already saw.
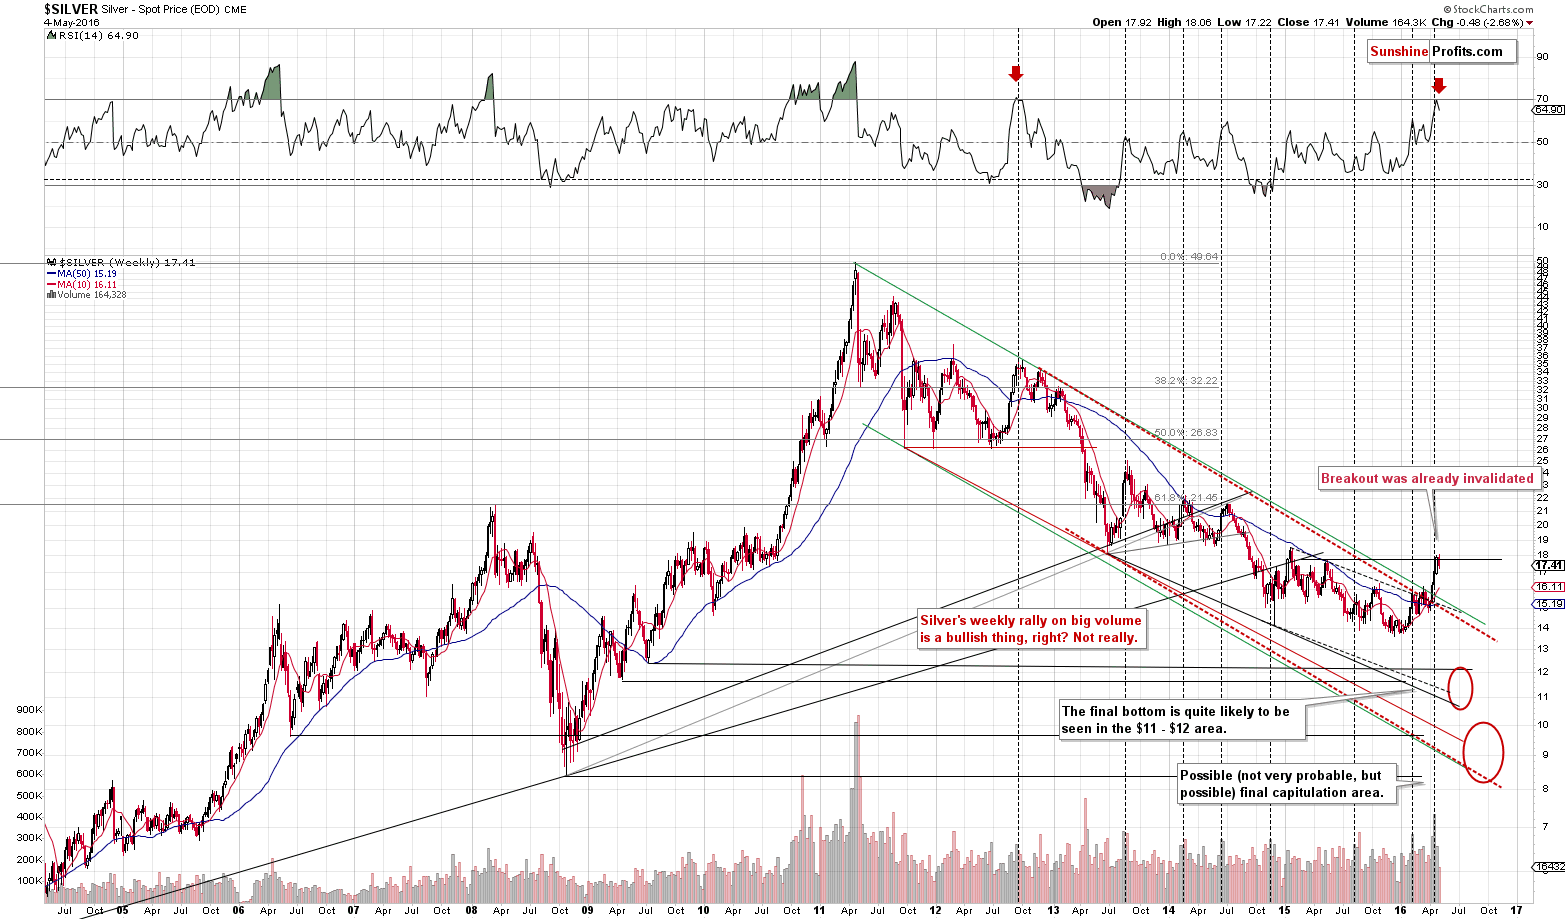
Not much changed in the case of silver either. Our yesterday’s comments remain up-to-date:
Our previous comments about the bearish implications of high volume in silver remain up-to-date. (…) We didn’t have to wait for long for the breakout to be invalidated. The implications are bearish and we can say the same about the recent move in the RSI indicator.
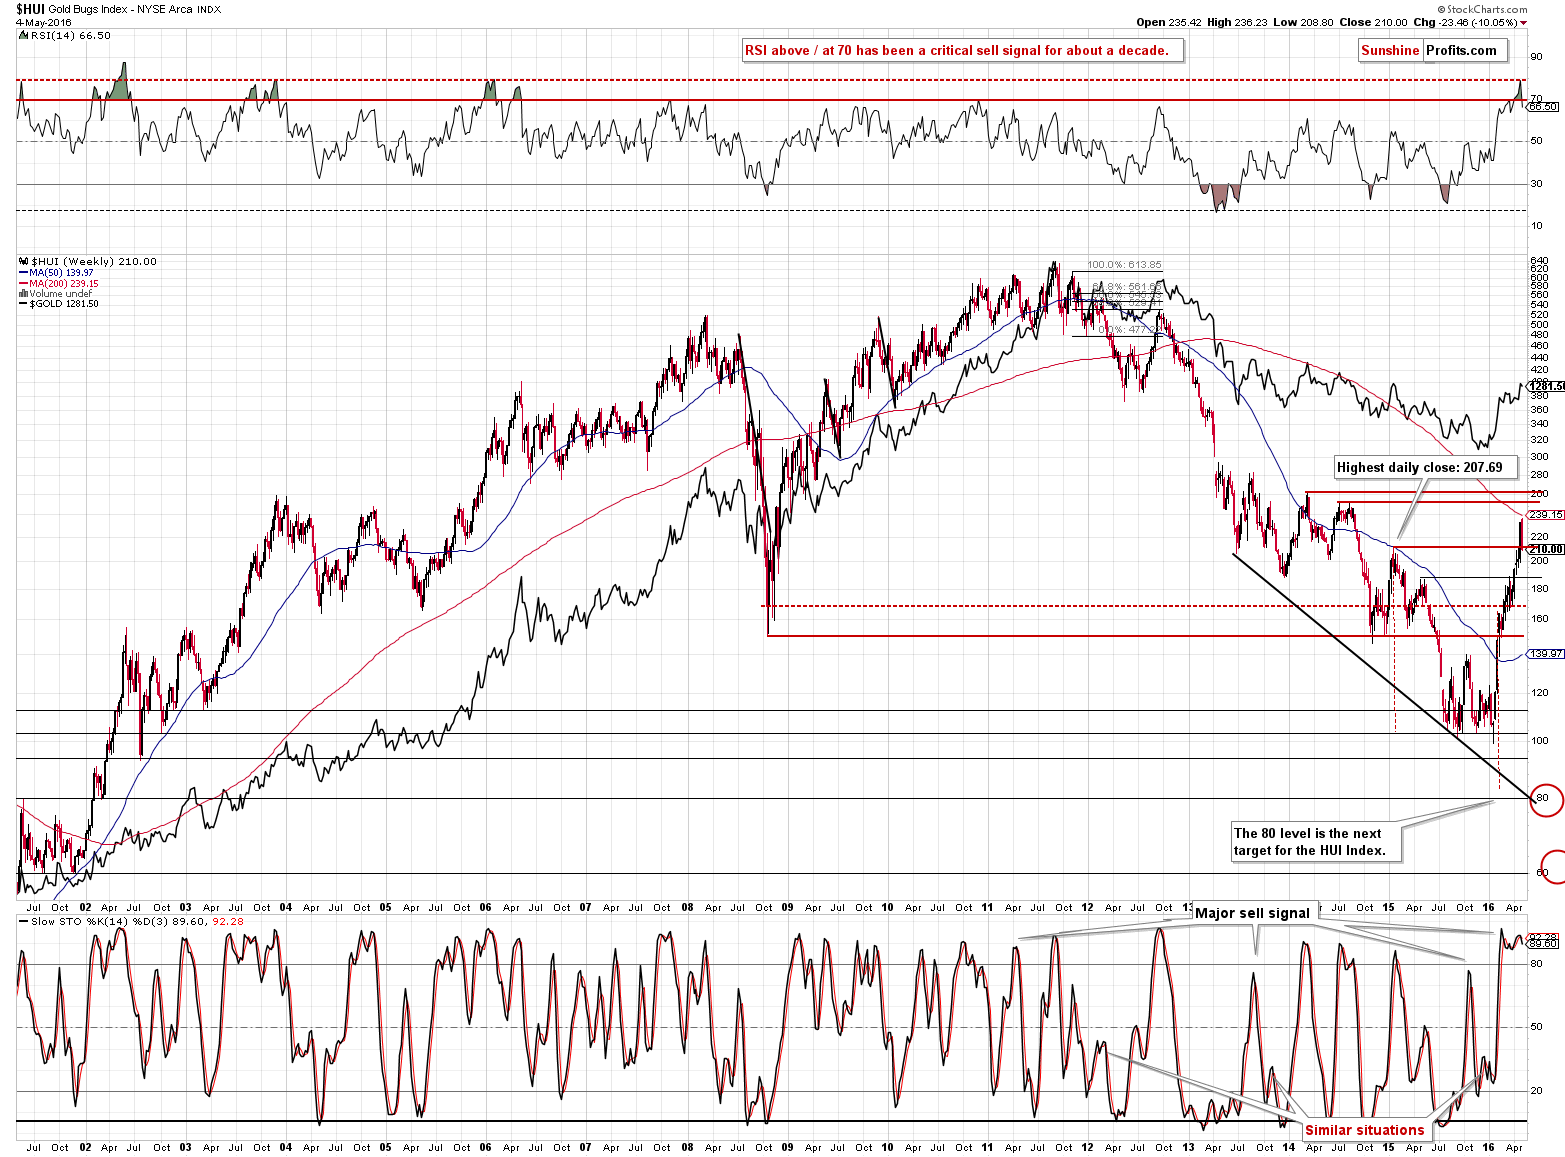
Moving back to the key question of today’s alert: “What about mining stocks?” The top has most likely been formed and the size of yesterday’s slide (especially given a rather small move lower in gold) confirms it. However, since gold stocks didn’t break back below the 2015 high the technical situation didn’t change that much. The HUI Index is quite close to this level so it could be the case that we’ll see breakdown today. Once that happens, we’ll likely increase the size of the short position in mining stocks. We will most likely wait for the daily close, but if something else convinces us that increasing the position in the miners is a good idea, we’ll let you know.
Summing up, the USD Index reversed in a profound way, it’s continuing to move higher and the implications of this move are very bullish for the USD Index and very bearish for the precious metals sector. The previous strength of mining stocks relative to metals is not only absent – miners are not underperforming in a quite visible way, but that is not enough to materially change the risk to reward ratio. It seems better to wait for the mining stocks to close back below their 2015 high before increasing the size of the short position.
As always, we will keep you – our subscribers – updated.
To summarize:
Trading capital (our opinion): Short positions (150% of the full position) in gold and silver and small (50% of the full position) short position in mining stocks are justified from the risk/reward perspective with the following stop-loss orders and initial target price levels:
- Gold: initial target price: $973; stop-loss: $1,317, initial target price for the DGLD ETN: $89.05; stop-loss for the DGLD ETN $46.25
- Silver: initial target price: $12.13; stop-loss: $18.17, initial target price for the DSLV ETN: $61.16; stop-loss for the DSLV ETN $26.34
- Mining stocks (price levels for the GDX ETF): initial target price: $9.34; stop-loss: $26.47, initial target price for the DUST ETF: $4.27; stop-loss for the DUST ETF $1.16 (the price for DUST is dependent not only on the prices of mining stocks themselves, but also on the way mining stocks decline and the real price that DUST will achieve will likely be much higher than this target, but the conservative pricing models don’t take - and generally can’t take - the above into account)
In case one wants to bet on junior mining stocks' prices (we do not suggest doing so – we think senior mining stocks are more predictable in the case of short-term trades – if one wants to do it anyway, we provide the details), here are the stop-loss details and initial target prices:
- GDXJ ETF: initial target price: $14.13; stop-loss: $39.43
- JDST ETF: initial target price: $5.78; stop-loss: $1.60
Long-term capital (our opinion): No positions
Insurance capital (our opinion): Full position
Plus, you might want to read why our stop-loss orders are usually relatively far from the current price.
Please note that a full position doesn’t mean using all of the capital for a given trade. You will find details on our thoughts on gold portfolio structuring in the Key Insights section on our website.
As a reminder – “initial target price” means exactly that – an “initial” one, it’s not a price level at which we suggest closing positions. If this becomes the case (like it did in the previous trade) we will refer to these levels as levels of exit orders (exactly as we’ve done previously). Stop-loss levels, however, are naturally not “initial”, but something that, in our opinion, might be entered as an order.
Since it is impossible to synchronize target prices and stop-loss levels for all the ETFs and ETNs with the main markets that we provide these levels for (gold, silver and mining stocks – the GDX ETF), the stop-loss levels and target prices for other ETNs and ETF (among other: UGLD, DGLD, USLV, DSLV, NUGT, DUST, JNUG, JDST) are provided as supplementary, and not as “final”. This means that if a stop-loss or a target level is reached for any of the “additional instruments” (DGLD for instance), but not for the “main instrument” (gold in this case), we will view positions in both gold and DGLD as still open and the stop-loss for DGLD would have to be moved lower. On the other hand, if gold moves to a stop-loss level but DGLD doesn’t, then we will view both positions (in gold and DGLD) as closed. In other words, since it’s not possible to be 100% certain that each related instrument moves to a given level when the underlying instrument does, we can’t provide levels that would be binding. The levels that we do provide are our best estimate of the levels that will correspond to the levels in the underlying assets, but it will be the underlying assets that one will need to focus on regarding the sings pointing to closing a given position or keeping it open. We might adjust the levels in the “additional instruments” without adjusting the levels in the “main instruments”, which will simply mean that we have improved our estimation of these levels, not that we changed our outlook on the markets. We are already working on a tool that would update these levels on a daily basis for the most popular ETFs, ETNs and individual mining stocks.
Our preferred ways to invest in and to trade gold along with the reasoning can be found in the how to buy gold section. Additionally, our preferred ETFs and ETNs can be found in our Gold & Silver ETF Ranking.
As always, we'll keep you - our subscribers - updated should our views on the market change. We will continue to send out Gold & Silver Trading Alerts on each trading day and we will send additional Alerts whenever appropriate.
The trading position presented above is the netted version of positions based on subjective signals (opinion) from your Editor, and the Tools and Indicators.
As a reminder, Gold & Silver Trading Alerts are posted before or on each trading day (we usually post them before the opening bell, but we don't promise doing that each day). If there's anything urgent, we will send you an additional small alert before posting the main one.
=====
Latest Free Trading Alerts:
Eurozone growth will be slower than expected in 2016. What does it mean for the gold market?
Sluggish Growth in Eurozone and Gold
S&P 500 index remains relatively close to the level of 2,050, as it corrects its two-month long rally after bouncing off resistance level at around 2,100. Is this a new downtrend, or just a downward correction before another leg up?
Stock Trading Alert: Stocks Extended Their Short-Term Downtrend But Will They Continue Lower?
Earlier today, the USD Index extended gains as yesterday’s positive data (which showed that U.S. trade deficit narrowed to $40.44 billion in March and the Institute of Supply Management‘s index increased to a four-month high of 55.7 in the previous month) continued to support the greenback. Thanks to these circumstances, USD/CHF moved higher once again and approached the first resistance area. Will it encourage currency bears to act in the coming days?
Forex Trading Alert: USD/CHF vs. Resistance
=====
Hand-picked precious-metals-related links:
Gold falls for fourth straight session on dollar rebound
Gold rally stalls despite weak US jobs data
India's gold imports go down by 67.3% due to jewellers' strike
Impala Wins $201 Million Court Order Against Metal Recycler
Operational ‘wrinkles’ take shine off Randgold’s results
Druckenmiller Loads Up on Gold, Saying Bull Market Exhausted
=====
In other news:
The Exchange podcast: ‘Europe is a cesspool of deflationary forces’
On Bull-Market Brink, Citi Sees Commodity Gains as Goldman Jeers
Is China fueling a new commodities bubble?
=====
Thank you.
Sincerely,
Przemyslaw Radomski, CFA
Founder, Editor-in-chief, Gold & Silver Fund Manager
Gold & Silver Trading Alerts
Forex Trading Alerts
Oil Investment Updates
Oil Trading Alerts

