

Briefly: In our opinion, speculative short positions (150% of the full position) in gold and silver and small (50% of the full position) short position in mining stocks are justified from the risk/reward point of view.
To a large extent both the precious metals sector and the USD Index performed as we expected them to – PMs declined while the USD rallied sharply after the temporary breakdown was invalidated. What’s next?
The decline in the precious metals sector is likely to continue as the signals that we saw (for instance, the sell signal generated by the RSI in the silver to gold ratio) were not of short-term, but medium-term meaning.
Let’s take a closer look at what happened yesterday and discuss what’s happening today (charts courtesy of http://stockcharts.com).
In yesterday’s alert, we wrote the following:
The second thing is even more important for us, precious metals investors. Please note that this year’s move higher in gold (lower part of the chart) has been a reflection of the decline in the USD Index. It was not until the USD Index started to slide that gold started to rally. Gold is now a bit (from the long-term perspective) below the level it reached in early 2015 and USD is a bit above this level. More or less what’s been going on in gold within the past year or so can be explained by the moves in the USD Index. Why is this so important? Because the very limited potential for additional declines in the USD Index implies very limited (again, from the long-term perspective) potential for a move higher in gold.
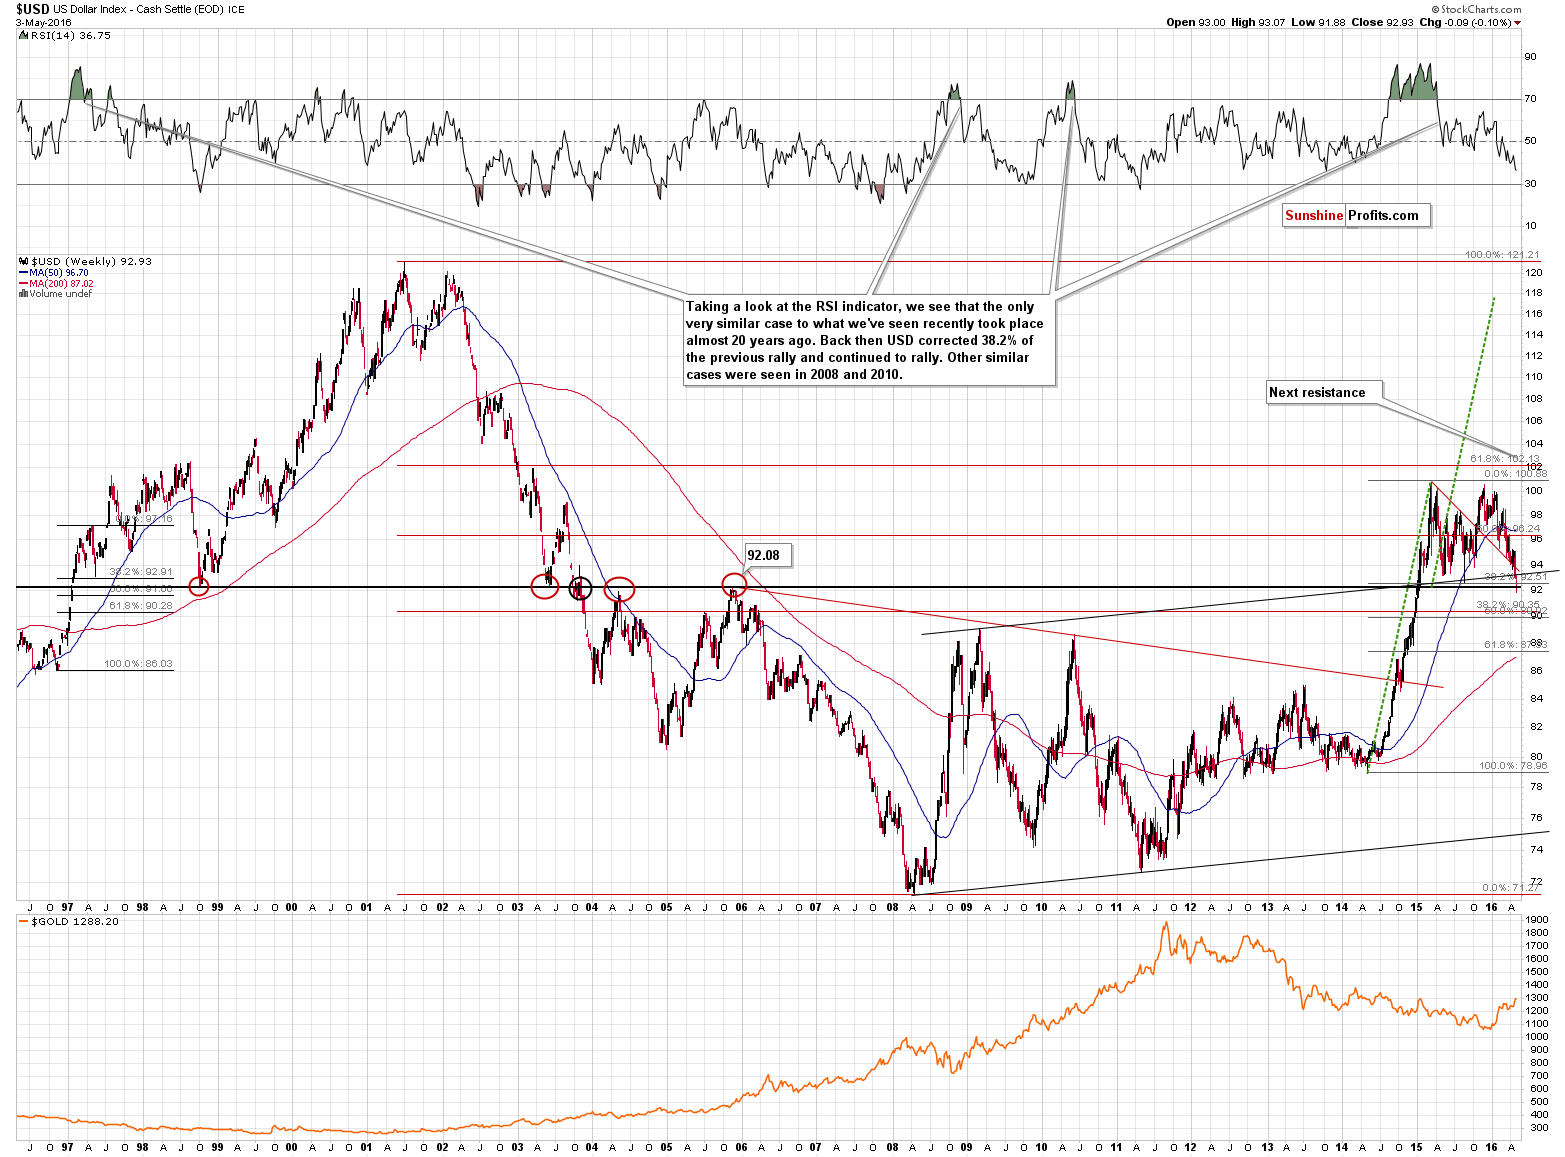
In early 2015, USD broke through all these important resistances in a sharp, volatile fashion and the fact that it’s been consolidating for many months is not surprising – it’s quite natural. Was the breakout invalidated? No. Are the support levels close? Yes. This means that the USD Index is likely to rally – if not right away, then relatively soon. This means that gold is likely to decline – and decline significantly, just as the USD Index is likely to rally significantly. The moves that follow consolidations tend to be similar to the moves that preceded it and this provides with an upside target of 118 in the USD Index.
(…)
With the situation in the USD Index being as it is, being invested in the precious metals market appears very risky.
Moreover, please note that while USD is well below its early-March low, gold is only a little above its early-March high. Gold is not responding to USD’s decline strongly, which suggests that gold “wants” to decline, but declining USD is not “allowing” it to.
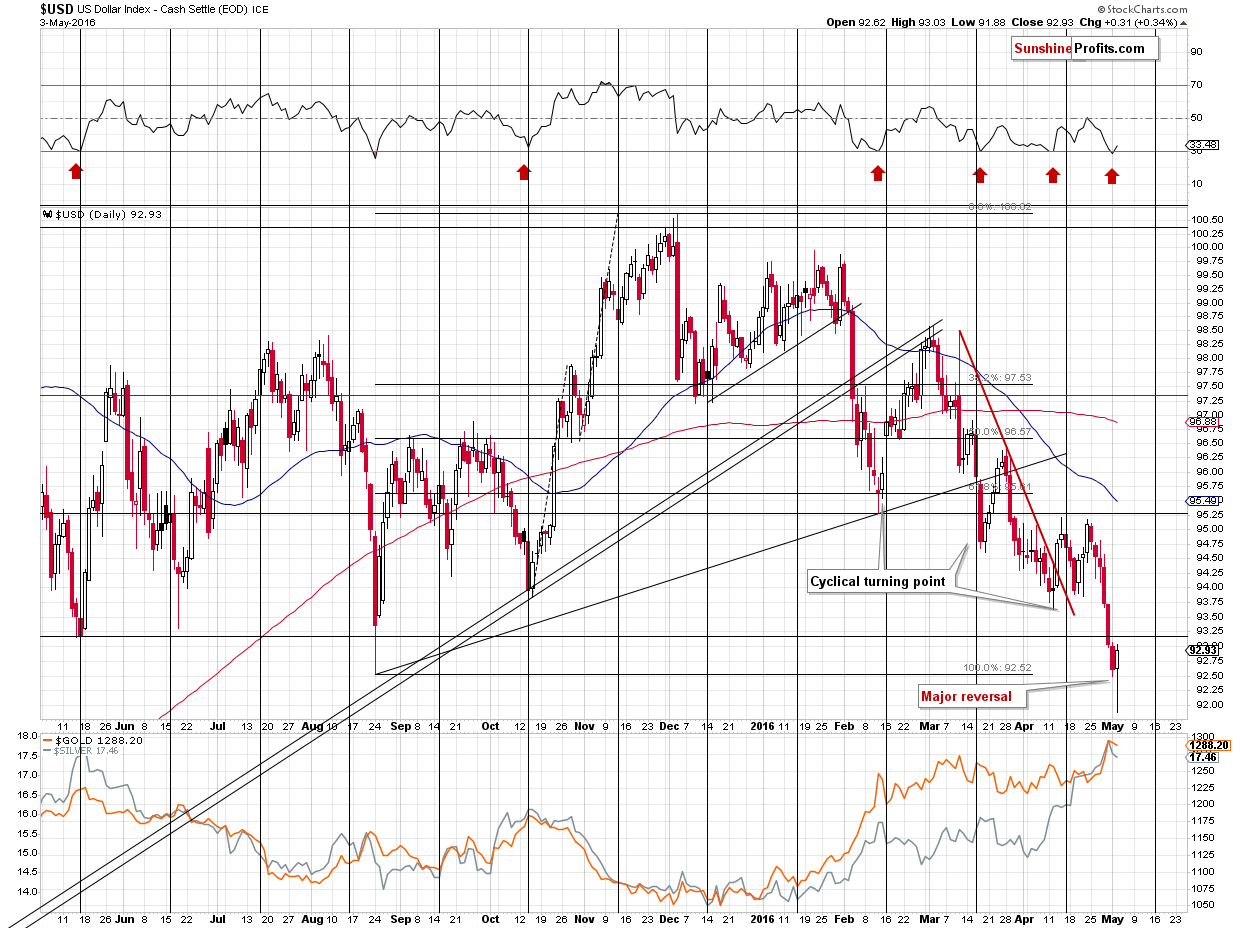
The USD Index moved briefly below 92 today only to rise back above it later on. This means that the lowest of the above-mentioned support levels was reached, temporarily broken and then we saw this breakouts invalidation. This is a bullish combination.
When we wrote the above, the USD was only a little above 92 and it managed to close at almost 93, reversing in a clear, very important, and bullish way. Moreover, the USD continued to move higher today and is at 93.12 at the moment of writing these words (about a full index point higher than 24 hours ago).
The level that was reached and temporarily broken is also very important. That was the final of the strong, long-term support levels, which means that it is very likely that the decline is now over. This, of course, doesn’t guarantee there will be no additional daily downswings, but it’s unlikely that we would see a move below this week’s low anytime soon.
As of this moment, the USD Index moved (a little, but still) higher this week and gold declined about $17. The implications for the precious metals sector are bearish.
The USD Index wasn’t the only market that was reversing.
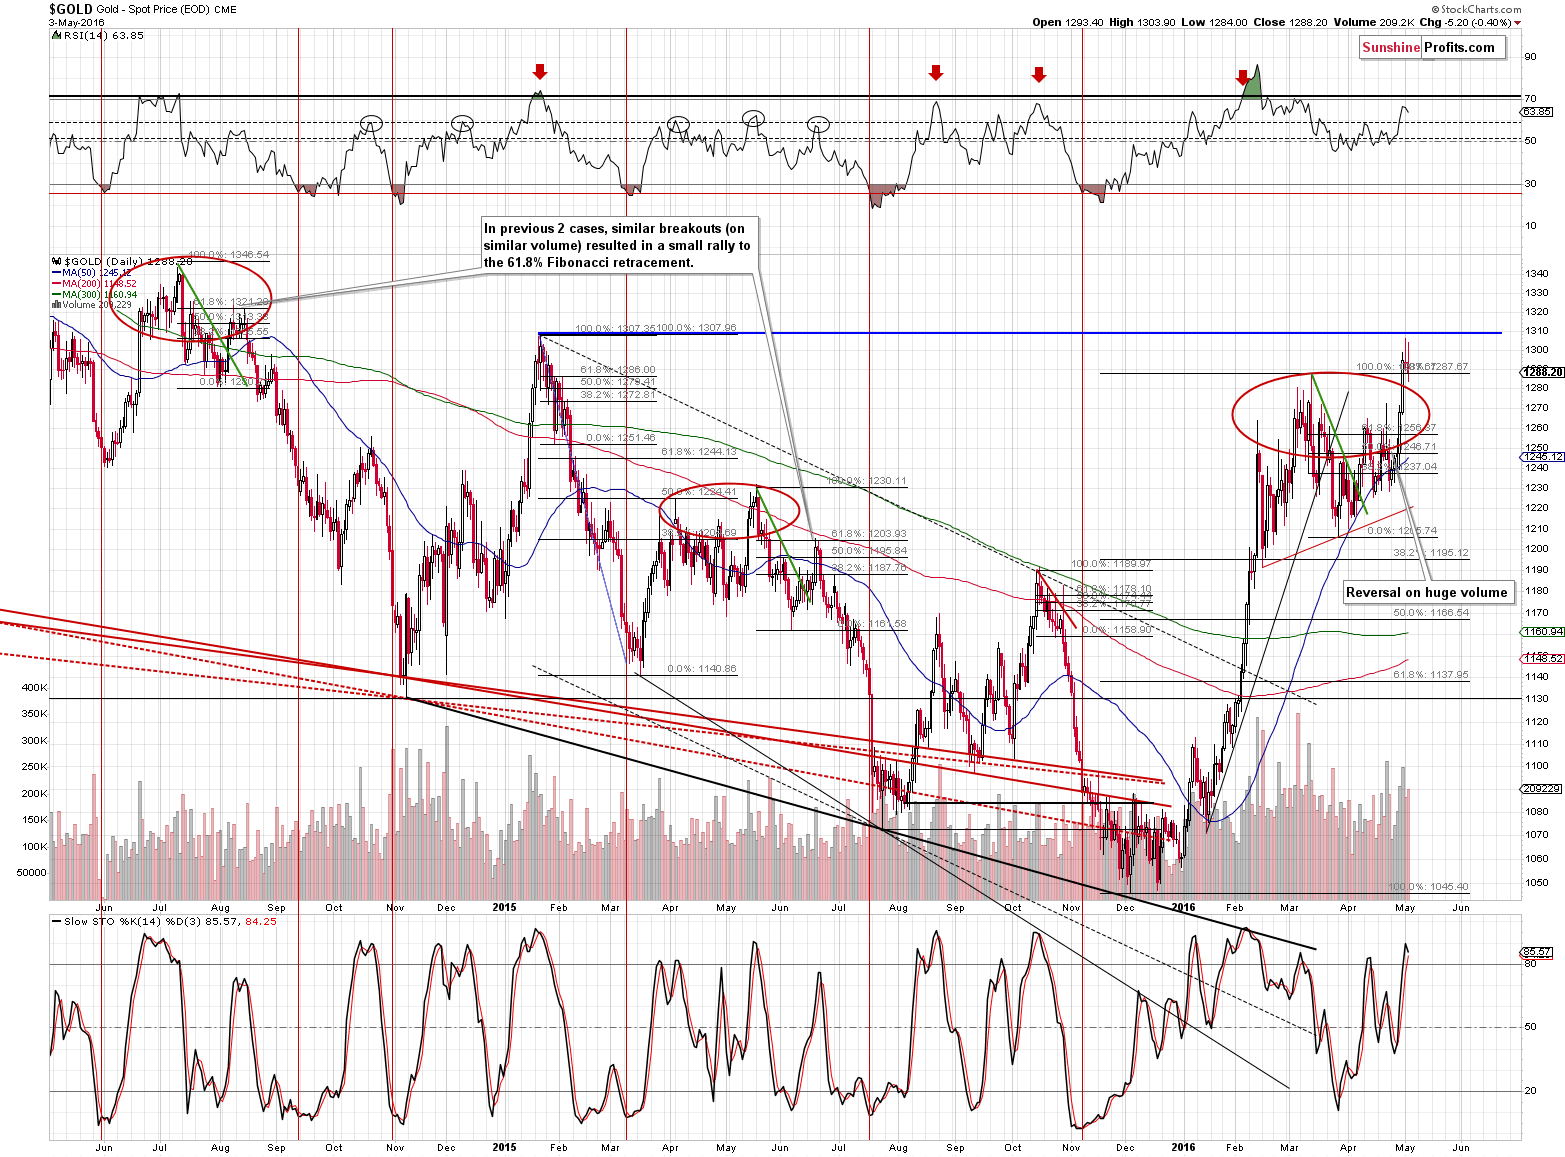
Gold reversed as well. Again. The reversal is naturally a bearish phenomenon, but let’s focus on something subtler – the intra-day high. Despite a massive slide in the USD Index early on (well below the previous lows and well below 92), gold didn’t rally above the 2015 high or even Monday’s intra-day high. That’s a clear sign of underperformance and a sign that a decline is to follow. At the moment of writing these words, gold is back below the March high. Once we see a close below the highest close of March ($1,273.10), more traders will view the breakout as invalidated and will likely close long positions and open short ones, thus contributing to the acceleration in the decline. We don’t think that waiting for this sign is necessary in light of the bearish signs that we already saw.
Our yesterday’s comments remain up-to-date:
It generally didn’t. Gold moved a few dollar’s higher, temporarily above $1,300, which almost immediately caused a few bullish articles to be posted (like this one). This happened after a quite big move higher in both: gold and USD, so it’s not likely that this article covers something that is going to make the prices move even more. It is, however, a reflection of how bullish the investment public is about gold and how bearish it is about USD.
(…)
Besides, last year – in May – gold moved above the previous high just to start a $150 decline shortly thereafter. Consequently, Friday’s small breakout does not have meaningful bullish consequences.
Extreme optimism (gold) and pessimism (USD) plus a reversal in gold yesterday plus lack of reaction today (repeat of previous days’ signals but this time it’s much stronger as gold moved very little) is a very bearish combination for the yellow metal and the rest of the precious metals sector.
In yesterday’s alert we wrote the following about silver:
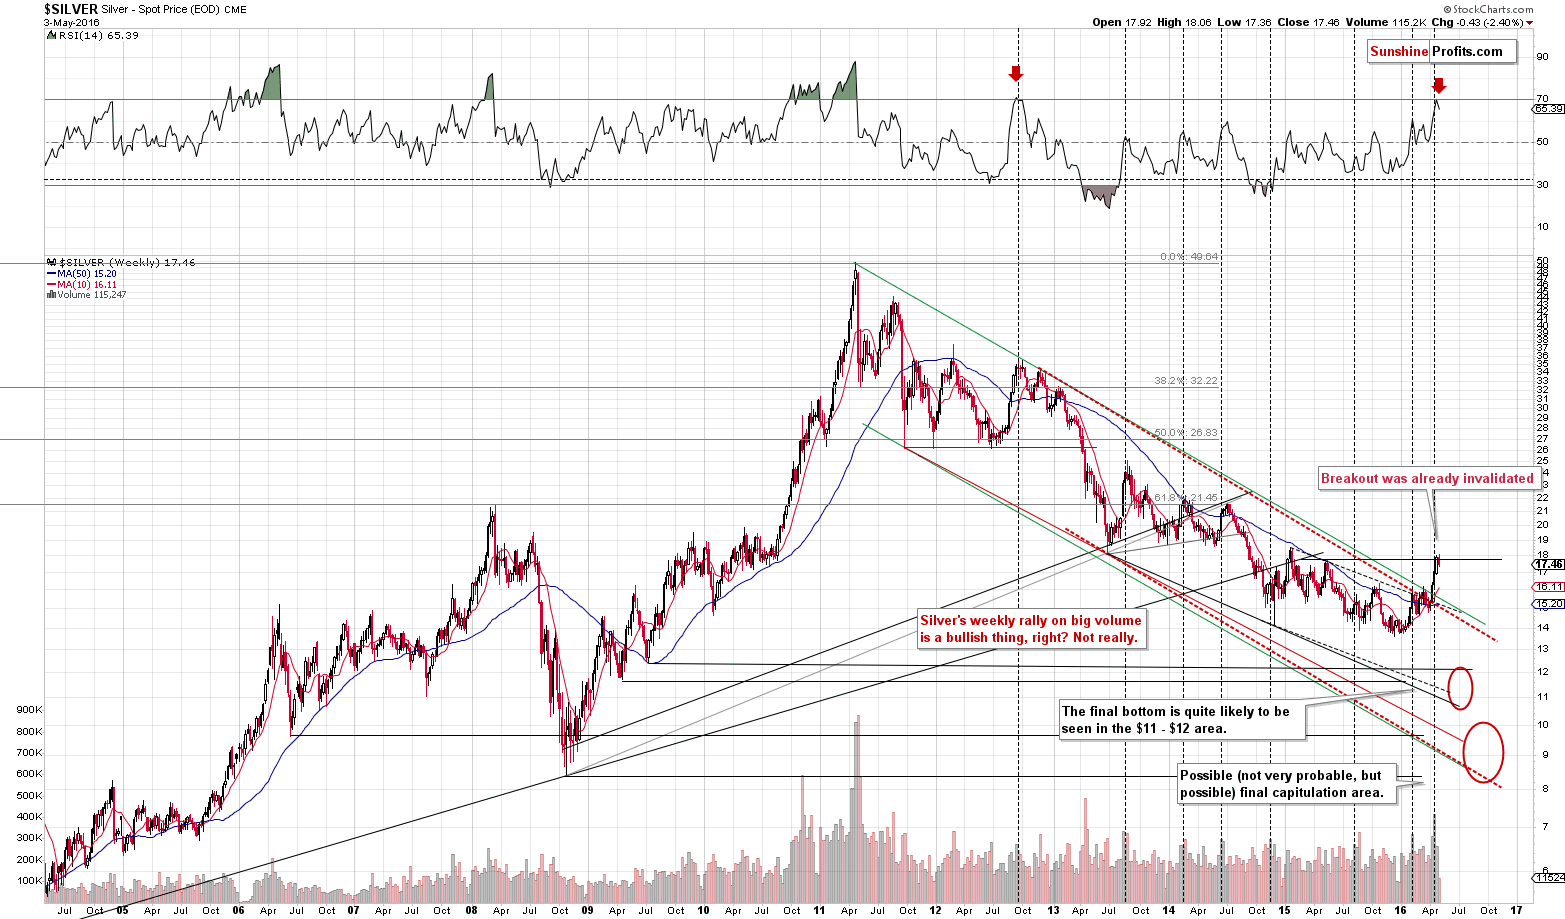
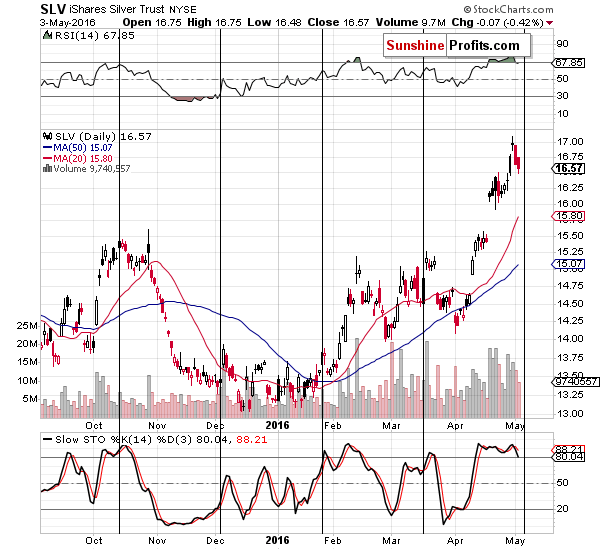
Meanwhile, silver also moved a bit higher yesterday on Friday and it closed several cents above the May 2015 high, but it already moved back below this level (below $17.77) earlier today, so the breakout is definitely not confirmed. Our previous comments about the bearish implications of high volume in silver remain up-to-date.
We didn’t have to wait for long for the breakout to be invalidated. The implications are bearish and we can say the same about the recent move in the RSI indicator. There’s also an additional thing that silver’s decline caused.
The invalidation of the breakout was followed by more declines and the above remains up-to-date.
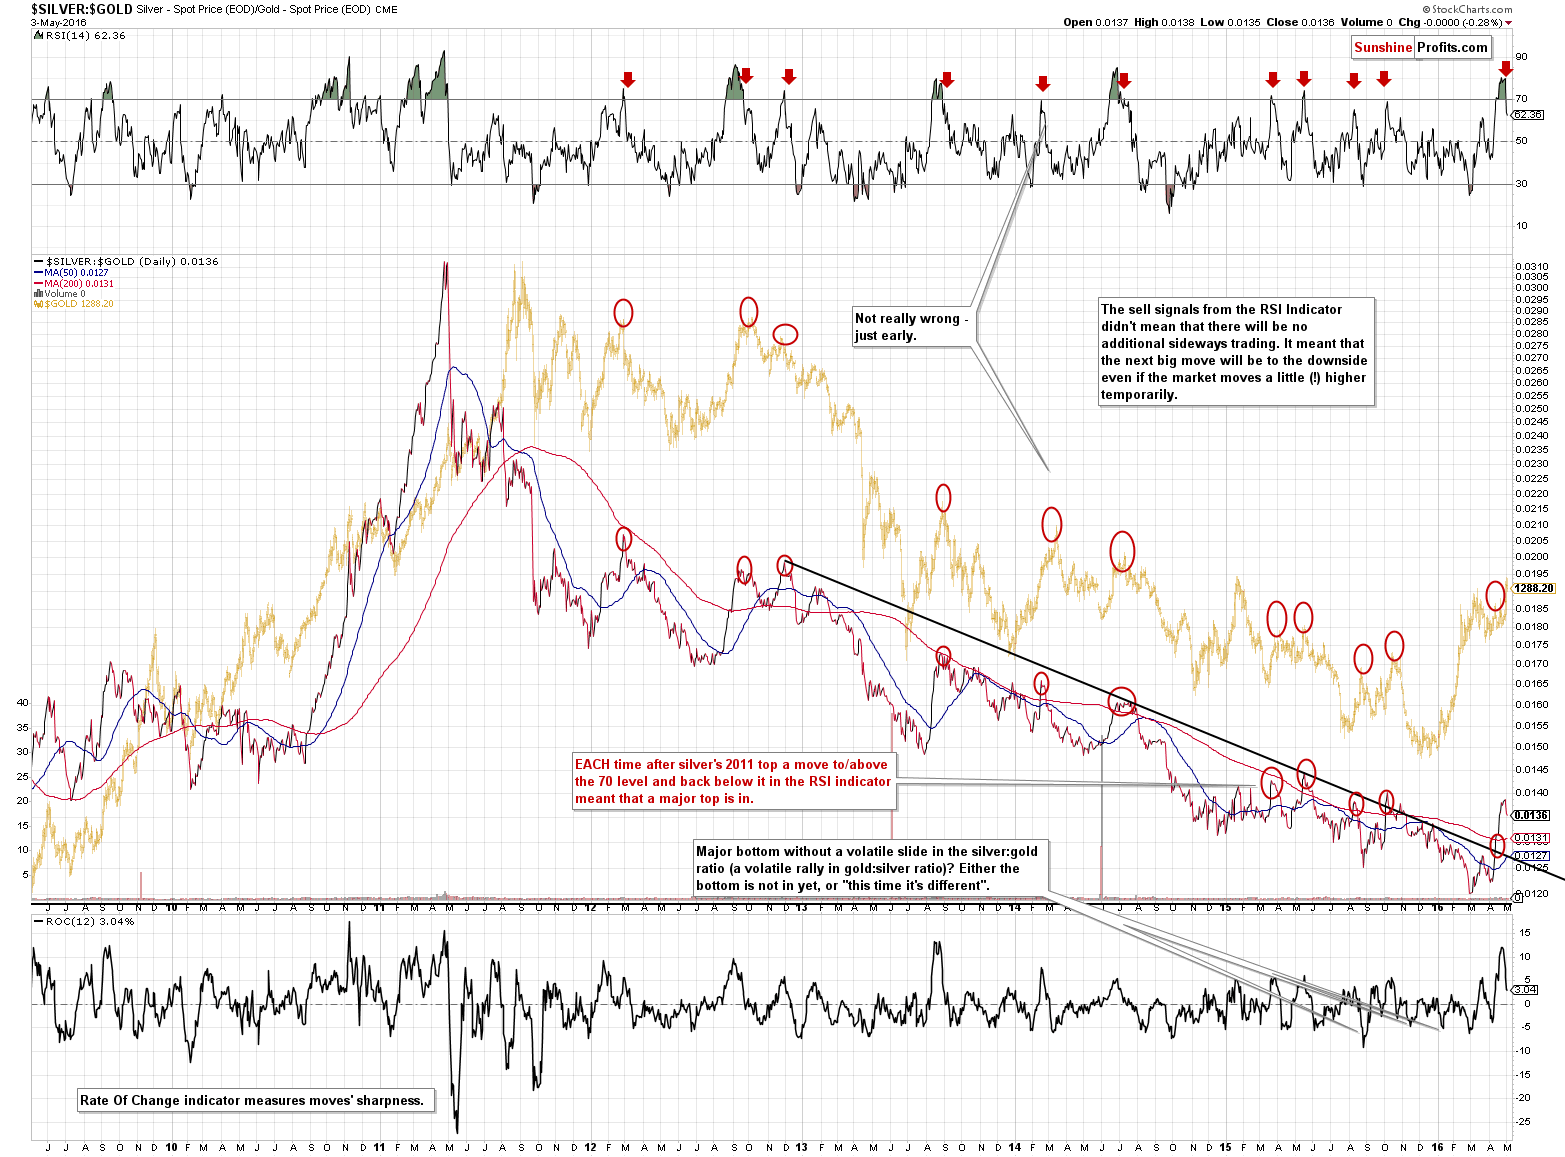
The RSI indicator based on the silver to gold ratio moved below 70, which served as a great sell / top-is-at-hand signal many times in the past. The implications are bearish also this time.
There is also an additional bearish factor present in silver – the cyclical turning point (vertical lines on the above chart) is only a few days away and since it works on a near-to basis, the reversal is likely already behind us.
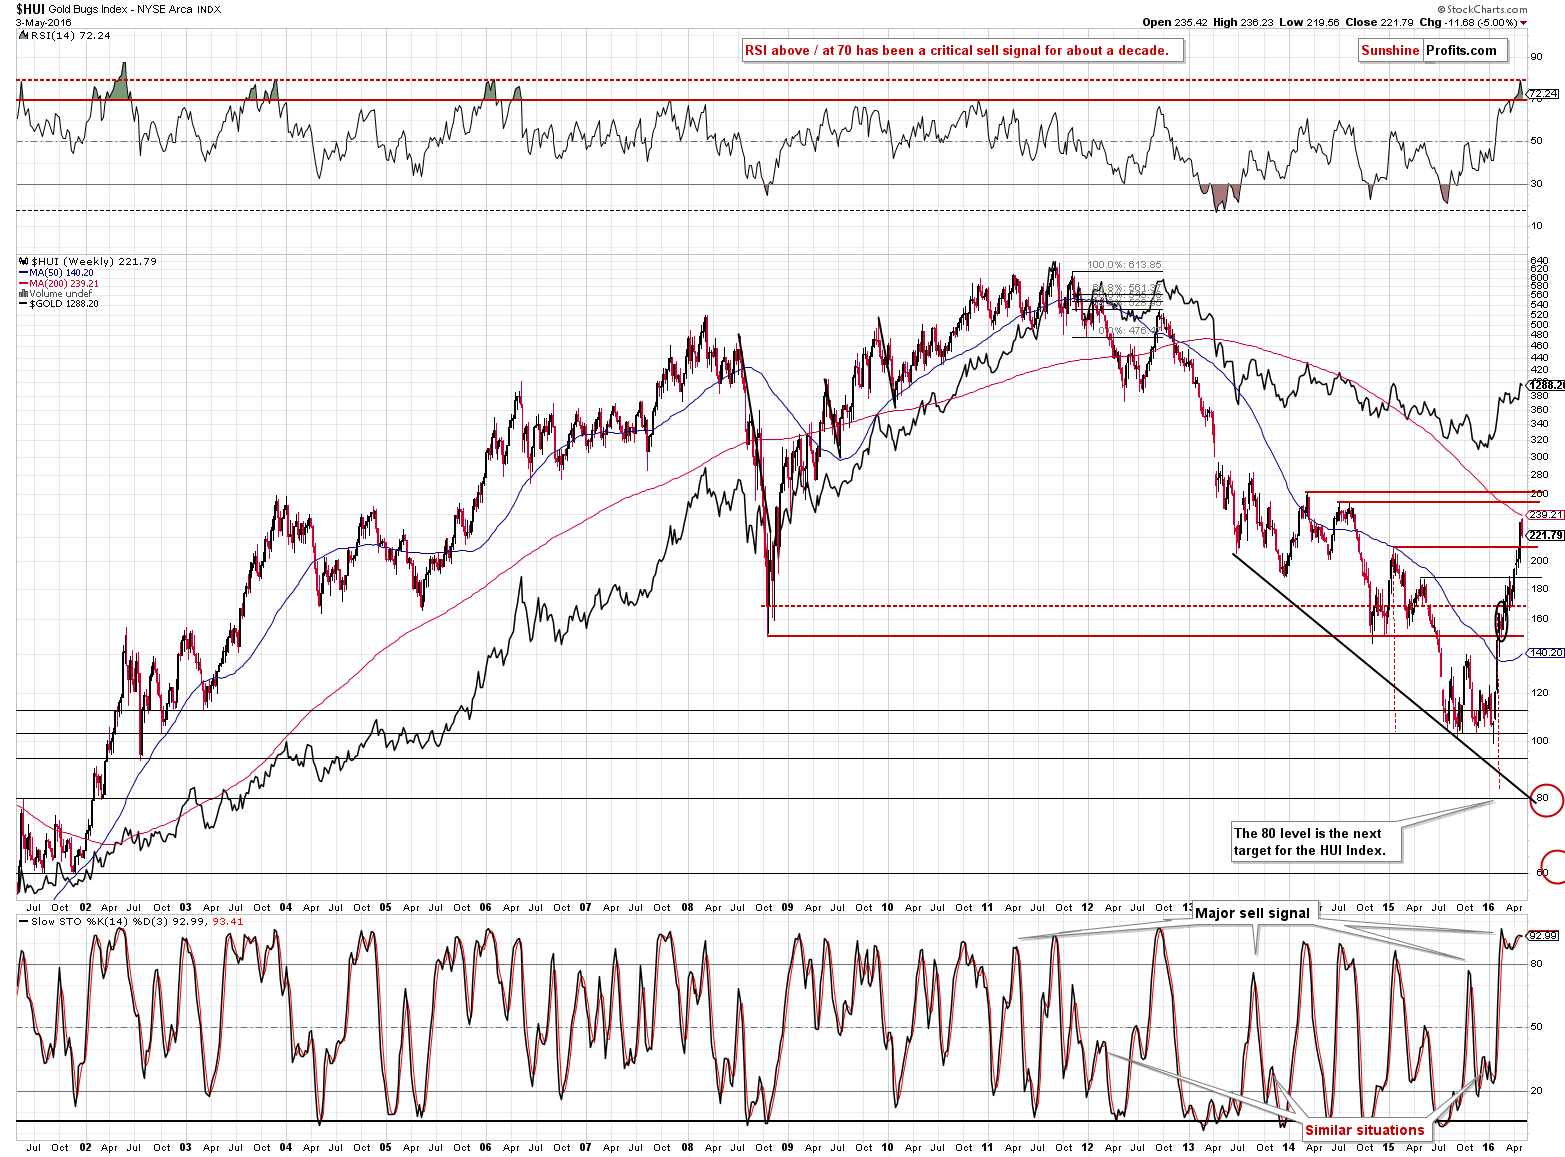
As far as gold stocks are concerned, to a large extent our yesterday’s comments remain up-to-date:
(...) we see that they didn’t move to their previous 2014 high yet. But they don’t have to. It’s true that the 2014 highs create important resistance levels, but let’s keep in mind that the HUI Index usually reversed before moving back to the previous top:
- Second half of 2012 – HUI declined before reaching the early 2012 top
- Early 2014 top – HUI declined before reaching the mid-2013 top
- mid-2014 tops – HUI declined before reaching the early 2014 top.
Consequently, gold stocks can move lower right away based on the RSI reading, proximity to the 2014 highs and – most importantly – the situation in the USD Index. Plus, the situation in the junior mining stock that we discussed yesterday.
Still, based on the recent strength in miners and today’s pre-market move higher in the GDX ETF we are not yet re-opening the short position in the mining stocks, but we expect it to do so relatively soon.
The mentioned strength in mining stocks turned out to be a very temporary phenomenon – GDX declined yesterday much more than GLD did. Consequently, the outlook for mining stocks deteriorated and we decided to open small short positions in this part of the precious metals sector. We are not opening a bigger position yet, because the miners’ charts themselves don’t provide us with enough sell signals. However, it is very likely that if the USD rallies and gold and silver decline, mining stocks will decline as well. We will likely increase the size of this position when the risk to reward ratio improves further.
Summing up, the USD Index reversed in a profound way and the implications of this move are very bullish for the USD Index and very bearish for the precious metals sector. The previous strength of mining stocks relative to metals was not present in the past few days and it seems that the risk to reward ratio now also favors a small short position in mining stocks (in addition to the short position in gold and silver).
As always, we will keep you – our subscribers – updated.
To summarize:
Trading capital (our opinion): Short positions (150% of the full position) in gold and silver and small (50% of the full position) short position in mining stocks are justified from the risk/reward perspective with the following stop-loss orders and initial target price levels:
- Gold: initial target price: $973; stop-loss: $1,317, initial target price for the DGLD ETN: $89.05; stop-loss for the DGLD ETN $46.25
- Silver: initial target price: $12.13; stop-loss: $18.17, initial target price for the DSLV ETN: $61.16; stop-loss for the DSLV ETN $26.34
- Mining stocks (price levels for the GDX ETF): initial target price: $9.34; stop-loss: $26.47, initial target price for the DUST ETF: $4.27; stop-loss for the DUST ETF $1.16
In case one wants to bet on junior mining stocks' prices (we do not suggest doing so – we think senior mining stocks are more predictable in the case of short-term trades – if one wants to do it anyway, we provide the details), here are the stop-loss details and initial target prices:
- GDXJ ETF: initial target price: $14.13; stop-loss: $39.43
- JDST ETF: initial target price: $5.78; stop-loss: $1.60
Long-term capital (our opinion): No positions
Insurance capital (our opinion): Full position
Plus, you might want to read why our stop-loss orders are usually relatively far from the current price.
Please note that a full position doesn’t mean using all of the capital for a given trade. You will find details on our thoughts on gold portfolio structuring in the Key Insights section on our website.
As a reminder – “initial target price” means exactly that – an “initial” one, it’s not a price level at which we suggest closing positions. If this becomes the case (like it did in the previous trade) we will refer to these levels as levels of exit orders (exactly as we’ve done previously). Stop-loss levels, however, are naturally not “initial”, but something that, in our opinion, might be entered as an order.
Since it is impossible to synchronize target prices and stop-loss levels for all the ETFs and ETNs with the main markets that we provide these levels for (gold, silver and mining stocks – the GDX ETF), the stop-loss levels and target prices for other ETNs and ETF (among other: UGLD, DGLD, USLV, DSLV, NUGT, DUST, JNUG, JDST) are provided as supplementary, and not as “final”. This means that if a stop-loss or a target level is reached for any of the “additional instruments” (DGLD for instance), but not for the “main instrument” (gold in this case), we will view positions in both gold and DGLD as still open and the stop-loss for DGLD would have to be moved lower. On the other hand, if gold moves to a stop-loss level but DGLD doesn’t, then we will view both positions (in gold and DGLD) as closed. In other words, since it’s not possible to be 100% certain that each related instrument moves to a given level when the underlying instrument does, we can’t provide levels that would be binding. The levels that we do provide are our best estimate of the levels that will correspond to the levels in the underlying assets, but it will be the underlying assets that one will need to focus on regarding the sings pointing to closing a given position or keeping it open. We might adjust the levels in the “additional instruments” without adjusting the levels in the “main instruments”, which will simply mean that we have improved our estimation of these levels, not that we changed our outlook on the markets. We are already working on a tool that would update these levels on a daily basis for the most popular ETFs, ETNs and individual mining stocks.
Our preferred ways to invest in and to trade gold along with the reasoning can be found in the how to buy gold section. Additionally, our preferred ETFs and ETNs can be found in our Gold & Silver ETF Ranking.
As always, we'll keep you - our subscribers - updated should our views on the market change. We will continue to send out Gold & Silver Trading Alerts on each trading day and we will send additional Alerts whenever appropriate.
The trading position presented above is the netted version of positions based on subjective signals (opinion) from your Editor, and the Tools and Indicators.
As a reminder, Gold & Silver Trading Alerts are posted before or on each trading day (we usually post them before the opening bell, but we don't promise doing that each day). If there's anything urgent, we will send you an additional small alert before posting the main one.
=====
On a side note, we replied to quite a few questions recently and you may find these replies as useful as well:
How do I invest in Gold Bullion?
What would happen if the world's supply of gold suddenly doubled?
=====
Hand-picked precious-metals-related links:
Gold Rally Stalls on Signs Prices Climbed Too Far, Too Fast
Einhorn Sees Counterproductive Monetary Policy Bullish for Gold
World Precious Metals Market – Is Russia Planning a Gold Ruble?
=====
In other news:
Janet Yellen may start 'reverse quantitative easing' in 2016: asset manager
Why the Bank of Japan was right to damn the yen and keep its powder dry: BofA
EUROPE MARKETS: European Stocks Wobble After Earnings Deluge
The $571 Billion Debt Wall That Points to More Defaults in China
Trump becomes de facto GOP nominee as Cruz exits after crushing Indiana loss
=====
Thank you.
Sincerely,
Przemyslaw Radomski, CFA
Founder, Editor-in-chief, Gold & Silver Fund Manager
Gold & Silver Trading Alerts
Forex Trading Alerts
Oil Investment Updates
Oil Trading Alerts

