

Briefly: In our opinion, speculative short positions (150% of the full position) in gold and silver are justified from the risk/reward point of view.
Gold reversed yesterday, silver invalidated its breakout and mining stocks declined a bit, and as important as it may seem, it is not the most important thing that we see on the market right now.
The most important thing is how precious metals sector is no longer reacting to declines in the USD Index and the fact that the latter moved to the lowest of the likely support levels. The odds for a reversal in the USD are very big and the impact on the precious metals sector is likely to be very negative. Moreover, even if USD declines even a bit lower, metals and miners are not likely to rally significantly (just as they are not really rising today despite a visible move lower in the USD).
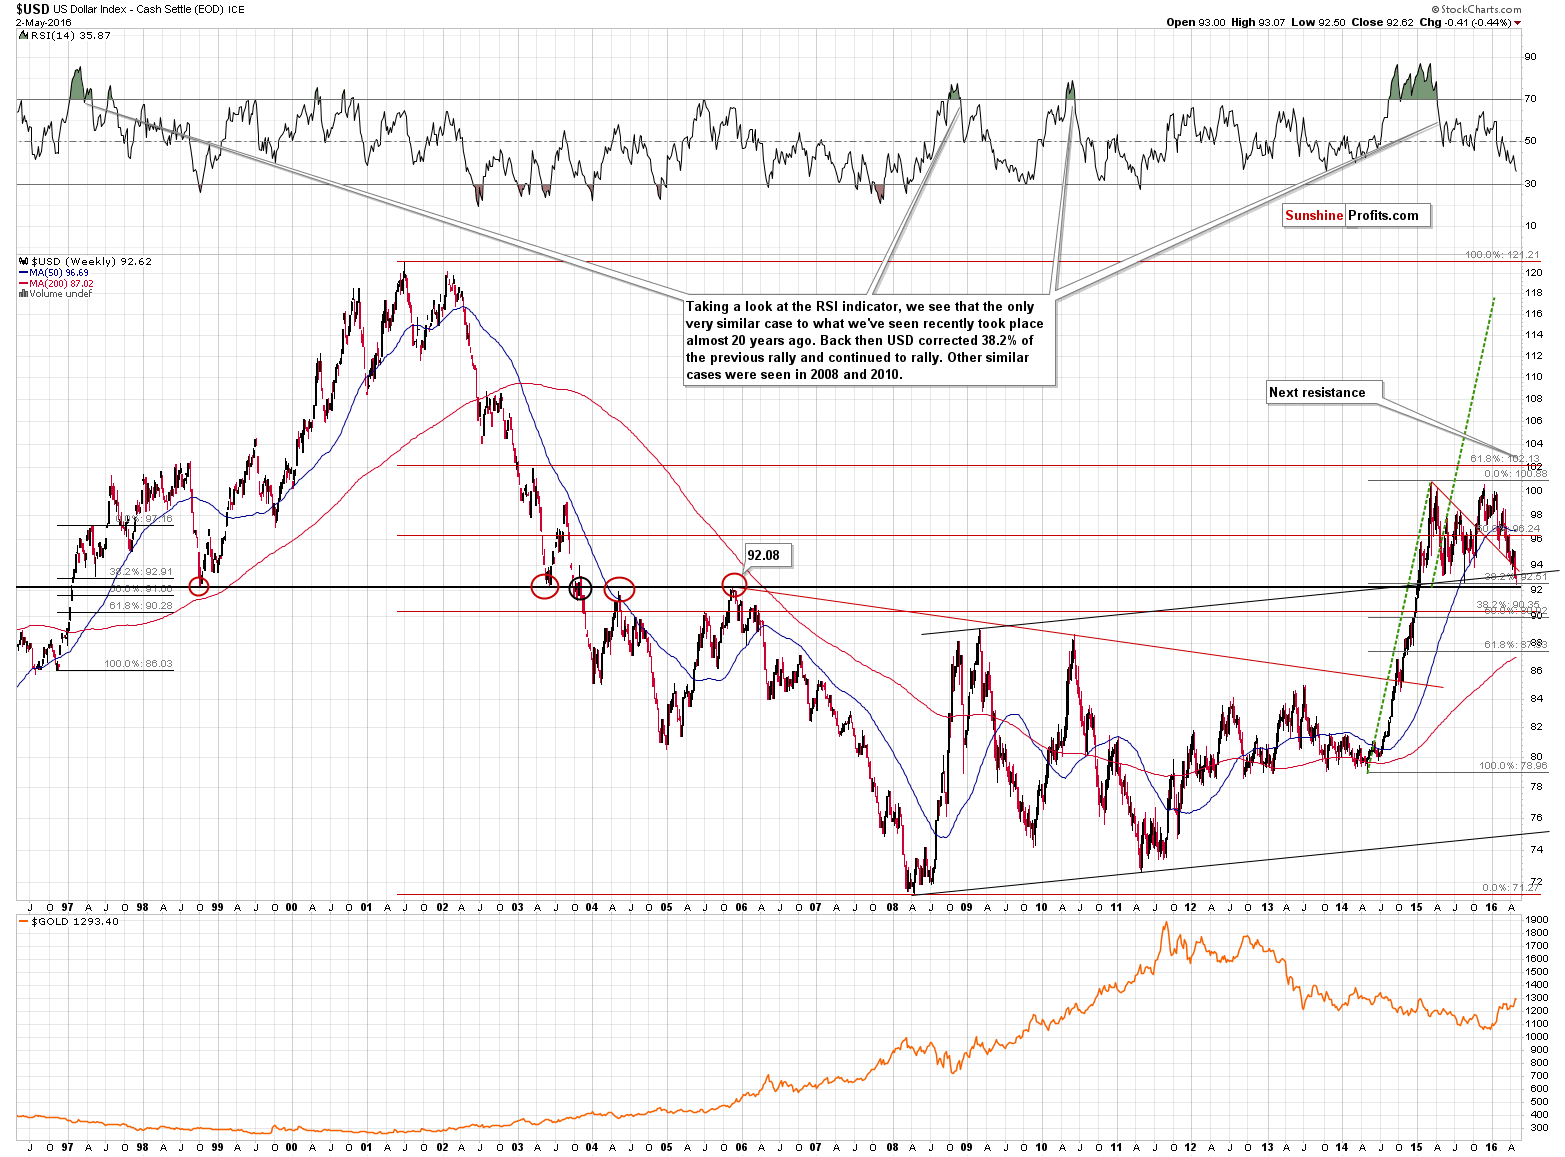
Let’s once again start with the USD Index (charts courtesy of http://stockcharts.com).
In yesterday’s alert, we wrote the following:
(…) The level through which the USD Index broke (about 92) and that stopped previous declines and rallies (marked with red ellipses) is also relatively close.
The second thing is even more important for us, precious metals investors. Please note that this year’s move higher in gold (lower part of the chart) has been a reflection of the decline in the USD Index. It was not until the USD Index started to slide that gold started to rally. Gold is now a bit (from the long-term perspective) below the level it reached in early 2015 and USD is a bit above this level. More or less what’s been going on in gold within the past year or so can be explained by the moves in the USD Index. Why is this so important? Because the very limited potential for additional declines in the USD Index implies very limited (again, from the long-term perspective) potential for a move higher in gold.
In early 2015, USD broke through all these important resistances in a sharp, volatile fashion and the fact that it’s been consolidating for many months is not surprising – it’s quite natural. Was the breakout invalidated? No. Are the support levels close? Yes. This means that the USD Index is likely to rally – if not right away, then relatively soon. This means that gold is likely to decline – and decline significantly, just as the USD Index is likely to rally significantly. The moves that follow consolidations tend to be similar to the moves that preceded it and this provides with an upside target of 118 in the USD Index.
Is the bottom in the USD Index already in? Possibly, but the most important thing is that if it’s not, then it’s not likely far away. The opposite is the case with gold.
With the situation in the USD Index being as it is, being invested in the precious metals market appears very risky.
Moreover, please note that while USD is well below its early-March low, gold is only a little above its early-March high. Gold is not responding to USD’s decline strongly, which suggests that gold “wants” to decline, but declining USD is not “allowing” it to.
The USD Index moved briefly below 92 today only to rise back above it later on. This means that the lowest of the above-mentioned support levels was reached, temporarily broken and then we saw this breakouts invalidation. This is a bullish combination.
How did gold react?
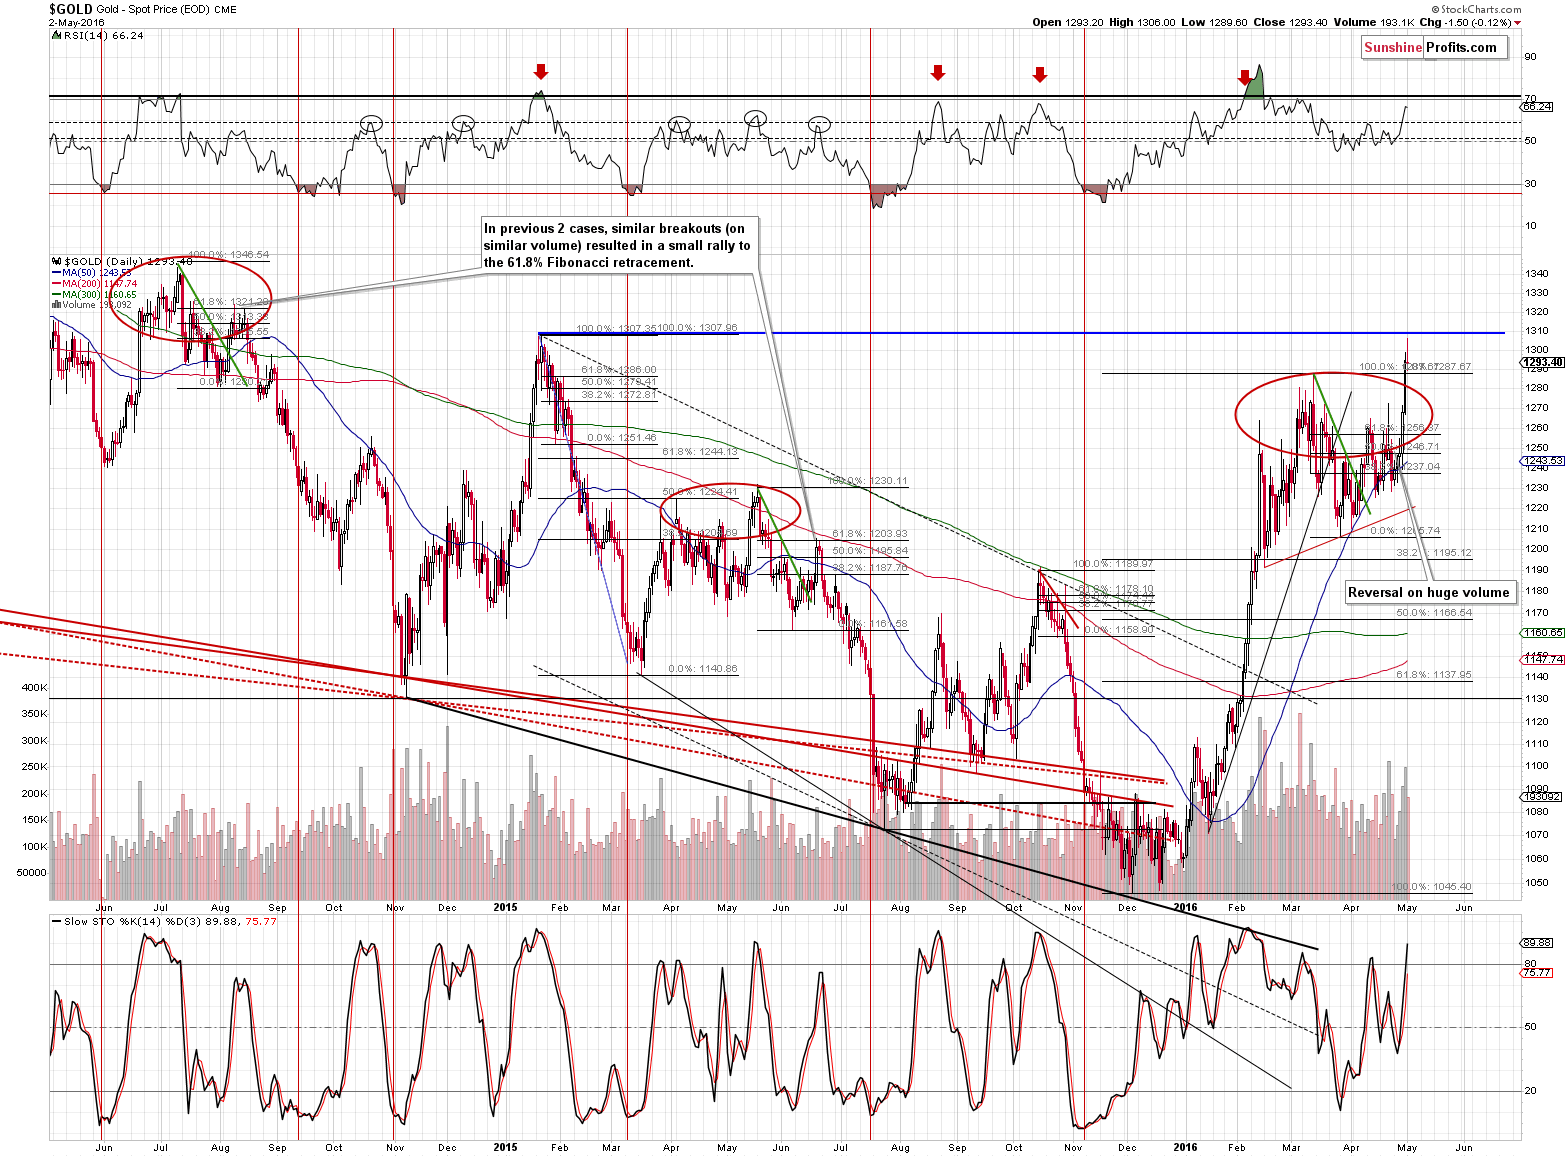
It generally didn’t. Gold moved a few dollar’s higher, temporarily above $1,300, which almost immediately caused a few bullish articles to be posted (like this one). This happened after a quite big move higher in both: gold and USD, so it’s not likely that this article covers something that is going to make the prices move even more. It is, however, a reflection of how bullish the investment public is about gold and how bearish it is about USD.
Yesterday, we wrote the following:
Gold moved higher on Friday and closed a few dollars above the March high. This appears very bullish, but:
- The 2015 high is just a few dollars higher (at about $1,307), so if gold moves higher it’s not likely to move much higher
- As mentioned above, gold is not reacting strongly to what USD is doing and the potential size of the decline in the USD Index is very limited.
Besides, last year – in May – gold moved above the previous high just to start a $150 decline shortly thereafter. Consequently, Friday’s small breakout does not have meaningful bullish consequences.
Extreme optimism (gold) and pessimism (USD) plus a reversal in gold yesterday plus lack of reaction today (repeat of previous days’ signals but this time it’s much stronger as gold moved very little) is a very bearish combination for the yellow metal and the rest of the precious metals sector.
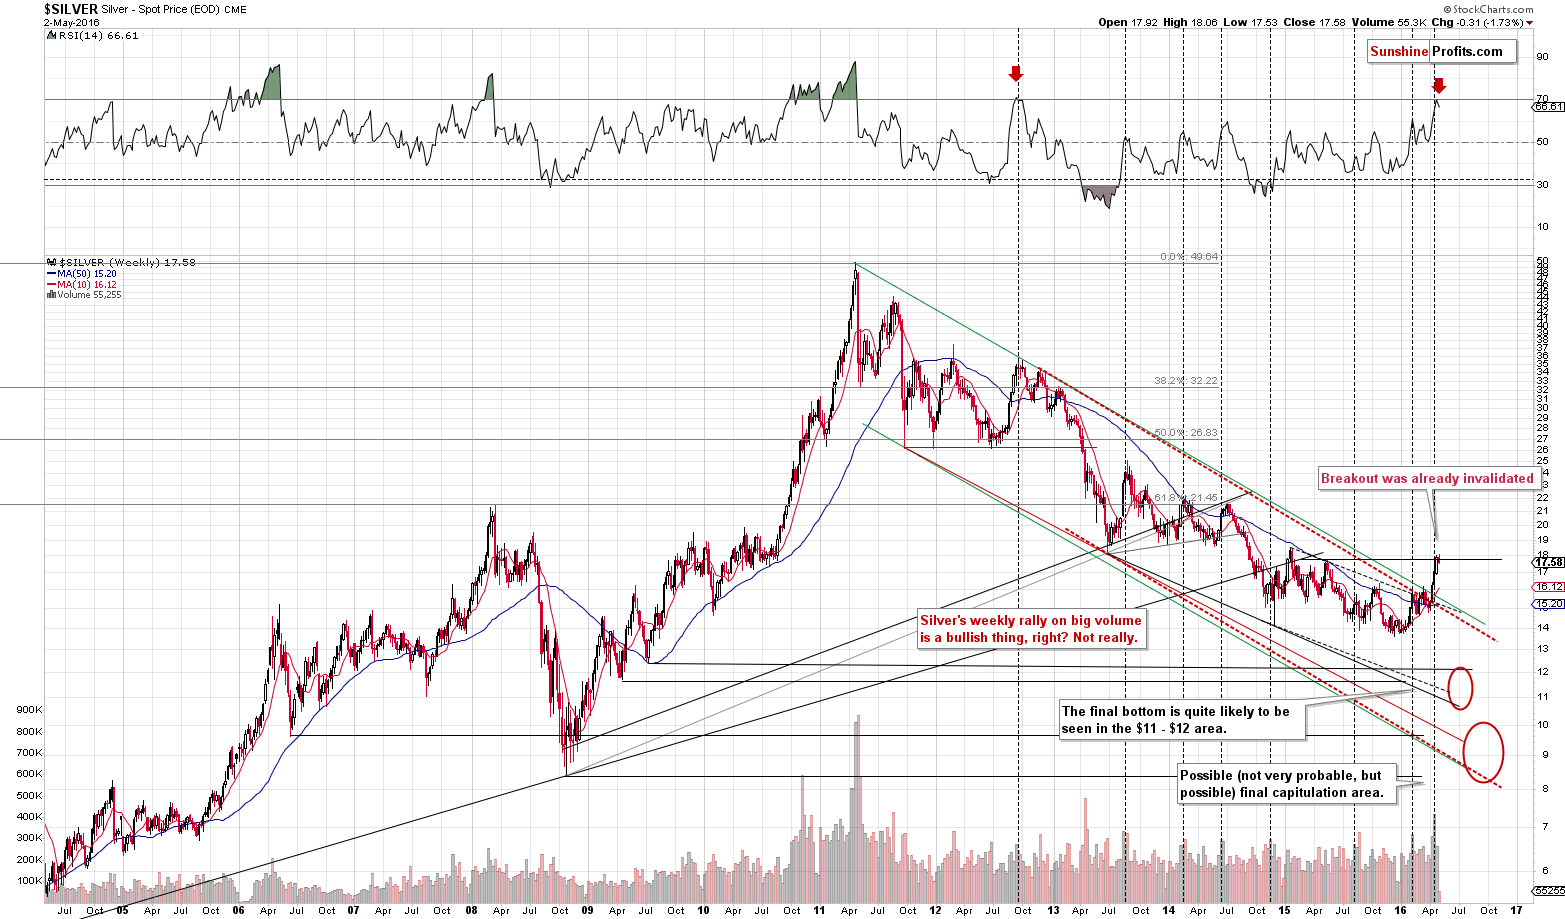
In yesterday’s alert we wrote the following about silver:
Meanwhile, silver also moved a bit higher yesterday on Friday and it closed several cents above the May 2015 high, but it already moved back below this level (below $17.77) earlier today, so the breakout is definitely not confirmed. Our previous comments about the bearish implications of high volume in silver remain up-to-date.
We didn’t have to wait for long for the breakout to be invalidated. The implications are bearish and we can say the same about the recent move in the RSI indicator. There’s also an additional thing that silver’s decline caused.
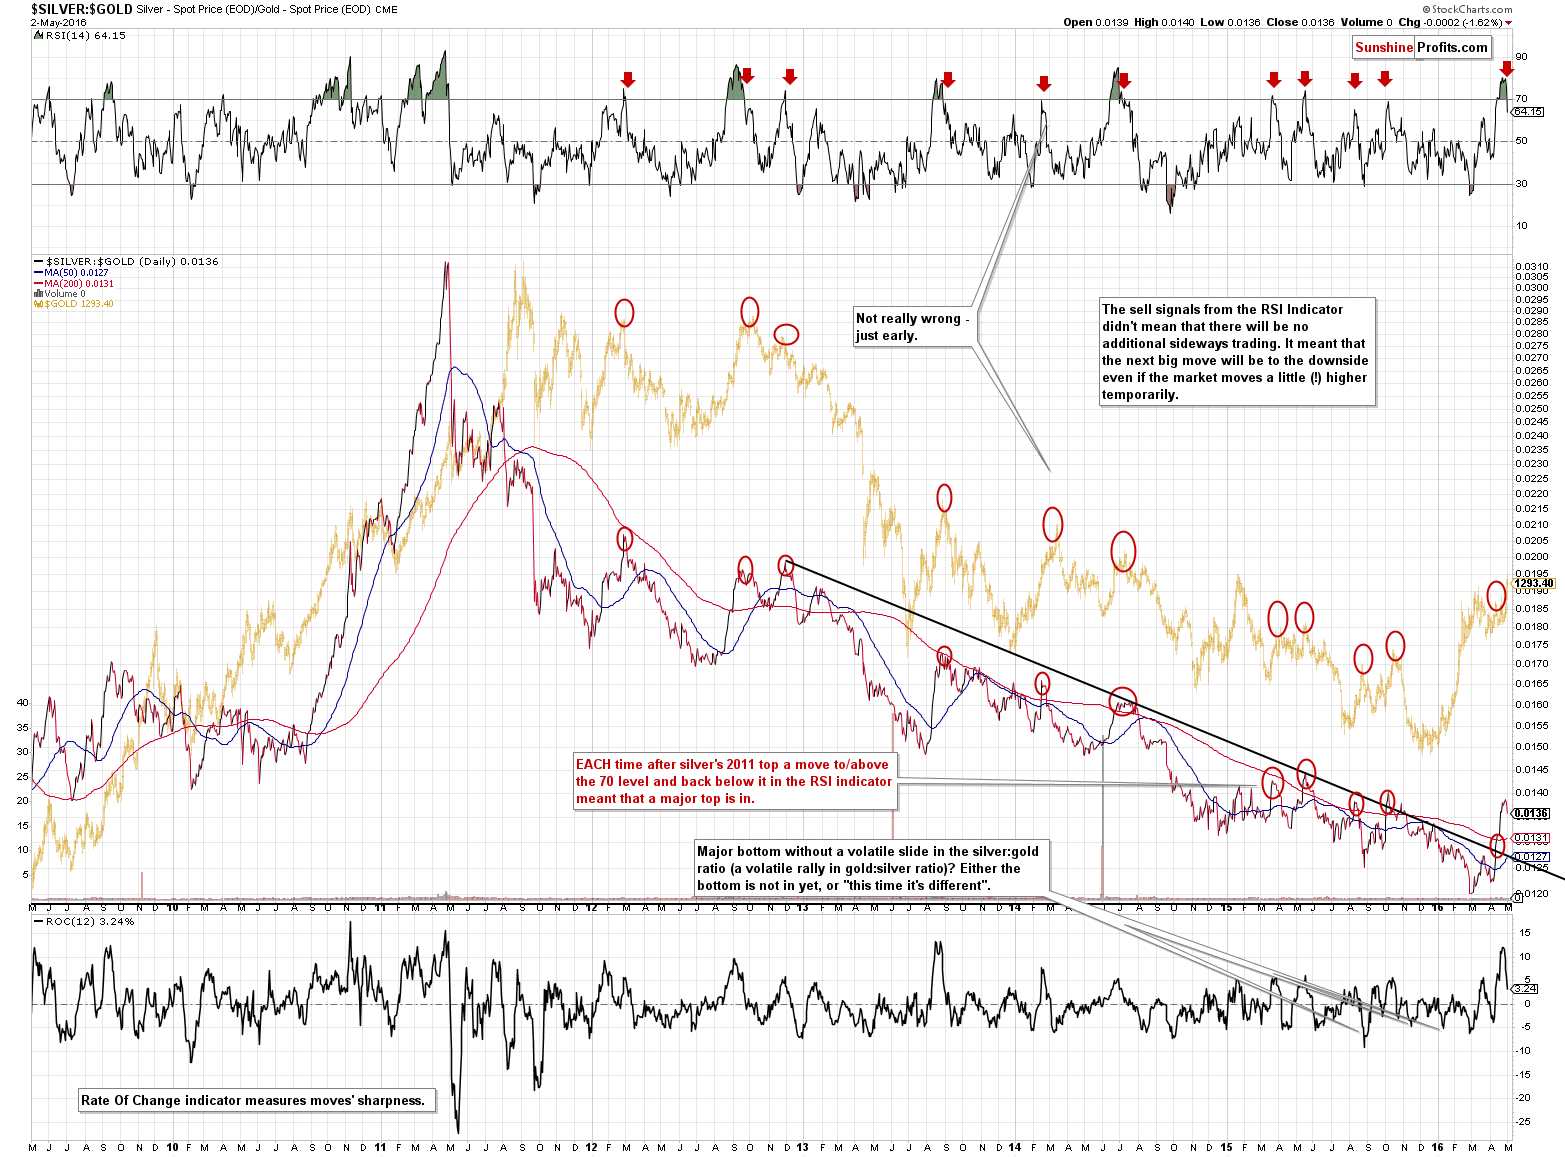
The RSI indicator based on the silver to gold ratio moved below 70, which served as a great sell / top is at hand signal many times in the past. The implications are bearish also this time.
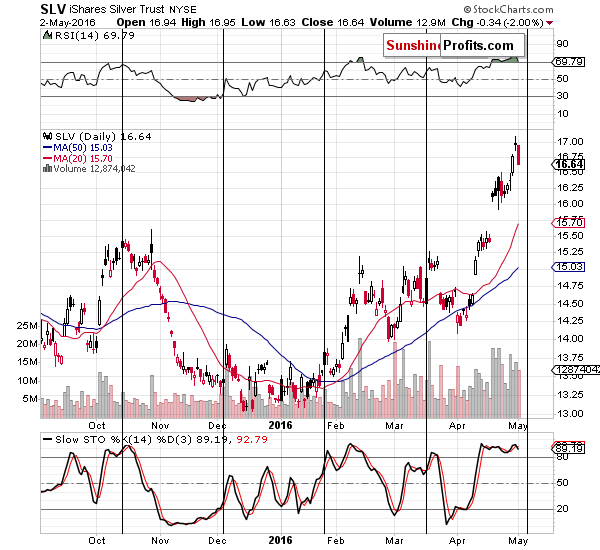
There is also an additional bearish factor present in silver – the cyclical turning point (vertical lines on the above chart) is only a few days away and since it works on a near-to basis, the reversal could already be behind us.
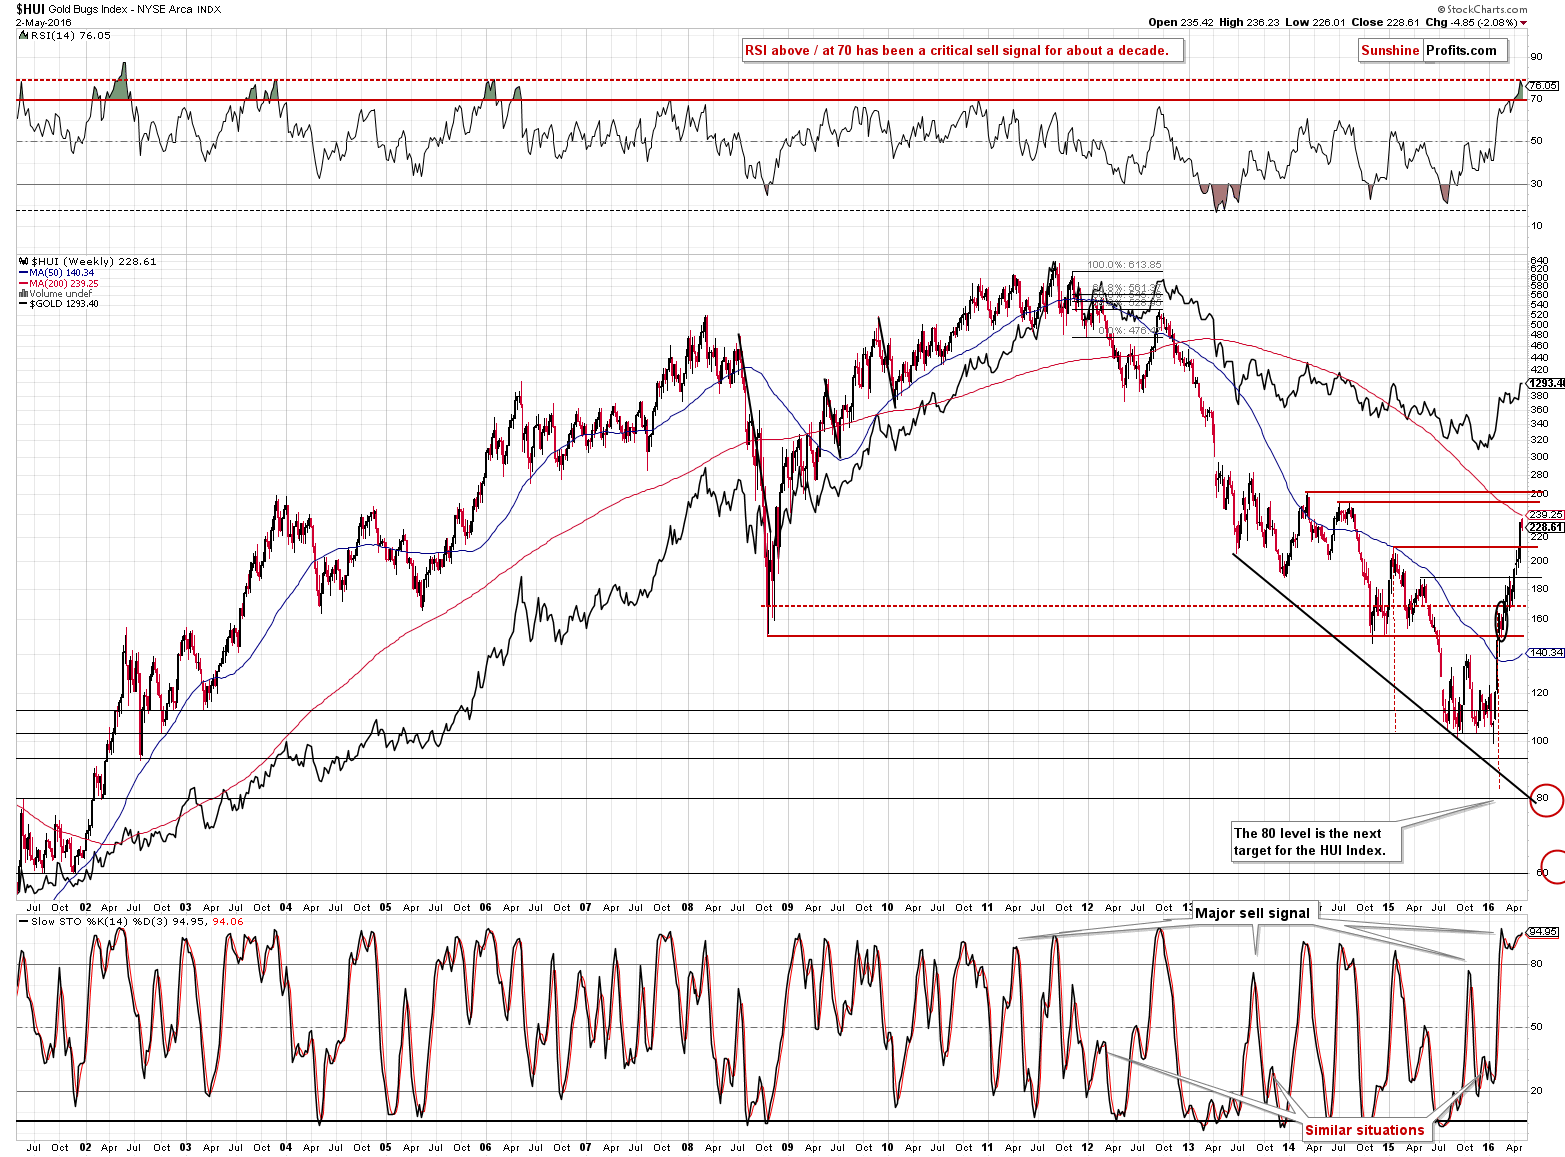
As far as gold stocks are concerned, we see that they didn’t move to their previous 2014 high yet. But they don’t have to. It’s true that the 2014 highs create important resistance levels, but let’s keep in mind that the HUI Index usually reversed before moving back to the previous top:
- Second half of 2012 – HUI declined before reaching the early 2012 top
- Early 2014 top – HUI declined before reaching the mid-2013 top
- mid-2014 tops – HUI declined before reaching the early 2014 top.
Consequently, gold stocks can move lower right away based on the RSI reading, proximity to the 2014 highs and – most importantly – the situation in the USD Index. Plus, the situation in the junior mining stock that we discussed yesterday.
Still, based on the recent strength in miners and today’s pre-market move higher in the GDX ETF we are not yet re-opening the short position in the mining stocks, but we expect it to do so relatively soon.
Summing up, the current situation in the USD Index suggests that a big move higher in it will be seen rather sooner than later (the bottom was quite likely formed today) and the implications for the precious metals market are profound and bearish. Based on the lack of real reaction in gold and silver to today’s pre-market decline in the USD Index and the levels that were reached in USD, gold and silver, it seems that increasing the size of the position in the current short position in gold and silver is now justified from the risk to reward point of view.
Please note that this only means using a bit more capital for this specific trade, and it does not mean using one’s entire trading capital (let alone a large part of the entire portfolio, which consists of also investment capital (currently in cash) and the insurance capital (invested in gold and silver)). Using a lot of capital for each trade is something that is most likely going to make one decrease their net worth over time regardless of how good the signals are (you can read detailed report and calculations on this here). We are increasing the regular size of the position as it appears that the reward is bigger than previously (gold and silver are higher) while the risk seems to have decreased (above-mentioned bearish signals), which means that the risk to reward ratio became more appealing. Please note that the current stop-loss levels are relatively close to the price, so we are not risking a lot of additional capital here.
As far as mining stocks are concerned, it’s difficult to set a good stop-loss due to the recent breakout and the recent momentum – it could be the case that miners keep on rallying for a day or a few of them whereas metals don’t move much. Consequently, it seems better to wait a bit before opening a short position in the miners.
As always, we will keep you – our subscribers – updated.
To summarize:
Trading capital (our opinion): Short positions (150% of the full position size) in gold and silver are justified from the risk/reward perspective with the following stop-loss orders and initial target price levels:
- Gold: initial target price: $973; stop-loss: $1,317, initial target price for the DGLD ETN: $89.05; stop-loss for the DGLD ETN $46.25
- Silver: initial target price: $12.13; stop-loss: $18.17, initial target price for the DSLV ETN: $61.16; stop-loss for DSLV ETN $26.34
Long-term capital (our opinion): No positions
Insurance capital (our opinion): Full position
Plus, you might want to read why our stop-loss orders are usually relatively far from the current price.
Please note that a full position doesn’t mean using all of the capital for a given trade. You will find details on our thoughts on gold portfolio structuring in the Key Insights section on our website.
As a reminder – “initial target price” means exactly that – an “initial” one, it’s not a price level at which we suggest closing positions. If this becomes the case (like it did in the previous trade) we will refer to these levels as levels of exit orders (exactly as we’ve done previously). Stop-loss levels, however, are naturally not “initial”, but something that, in our opinion, might be entered as an order.
Since it is impossible to synchronize target prices and stop-loss levels for all the ETFs and ETNs with the main markets that we provide these levels for (gold, silver and mining stocks – the GDX ETF), the stop-loss levels and target prices for other ETNs and ETF (among other: UGLD, DGLD, USLV, DSLV, NUGT, DUST, JNUG, JDST) are provided as supplementary, and not as “final”. This means that if a stop-loss or a target level is reached for any of the “additional instruments” (DGLD for instance), but not for the “main instrument” (gold in this case), we will view positions in both gold and DGLD as still open and the stop-loss for DGLD would have to be moved lower. On the other hand, if gold moves to a stop-loss level but DGLD doesn’t, then we will view both positions (in gold and DGLD) as closed. In other words, since it’s not possible to be 100% certain that each related instrument moves to a given level when the underlying instrument does, we can’t provide levels that would be binding. The levels that we do provide are our best estimate of the levels that will correspond to the levels in the underlying assets, but it will be the underlying assets that one will need to focus on regarding the sings pointing to closing a given position or keeping it open. We might adjust the levels in the “additional instruments” without adjusting the levels in the “main instruments”, which will simply mean that we have improved our estimation of these levels, not that we changed our outlook on the markets. We are already working on a tool that would update these levels on a daily basis for the most popular ETFs, ETNs and individual mining stocks.
Our preferred ways to invest in and to trade gold along with the reasoning can be found in the how to buy gold section. Additionally, our preferred ETFs and ETNs can be found in our Gold & Silver ETF Ranking.
As always, we'll keep you - our subscribers - updated should our views on the market change. We will continue to send out Gold & Silver Trading Alerts on each trading day and we will send additional Alerts whenever appropriate.
The trading position presented above is the netted version of positions based on subjective signals (opinion) from your Editor, and the Tools and Indicators.
As a reminder, Gold & Silver Trading Alerts are posted before or on each trading day (we usually post them before the opening bell, but we don't promise doing that each day). If there's anything urgent, we will send you an additional small alert before posting the main one.
=====
Latest Free Trading Alerts:
Corporate defaults hit the highest levels since 2009. What does it mean for the gold market?
=====
Hand-picked precious-metals-related links:
PRECIOUS-Gold steadies near 15-month peak on softer dollar, fund inflows
=====
In other news:
EU Cuts Euro-Area Inflation Forecast, Warns Nations on Debt
It's Not Just Brexit, Scottish Independence Is Back in Play
Puerto Rico defaults on $422 million
Fed's Williams sees big drop in assets as possible systemic risk
=====
Thank you.
Sincerely,
Przemyslaw Radomski, CFA
Founder, Editor-in-chief, Gold & Silver Fund Manager
Gold & Silver Trading Alerts
Forex Trading Alerts
Oil Investment Updates
Oil Trading Alerts

