

Briefly: In our opinion, no speculative positions in gold, silver and mining stocks are justified from the risk/reward point of view. We plan to open short positions relatively soon (probably this week).
Gold, silver and mining stocks soared last week and there are multiple voices saying that gold can only go up. However, no market can move in a straight line and the precious metals sector is no exception. Consequently, there are levels at which gold, silver and miners might top and reverse. What are these levels and, more importantly, what’s likely to happen after they are reached?
In our opinion we are very close to another major top in the precious metals sector that will be followed by a huge decline. This is in tune with previous past patterns and many signals point to this outcome. However, before we provide them, we would like to say that the most important thing is that we haven’t seen enough confirmations that the final bottom is already in. This means that the final bottom is most likely ahead and thus that we are likely to see prices below the previous lows. Let’s take a look at the charts (charts courtesy of http://stockcharts.com). We’ll once again start with the USD Index, since it is the likely reason behind this week’s rally.
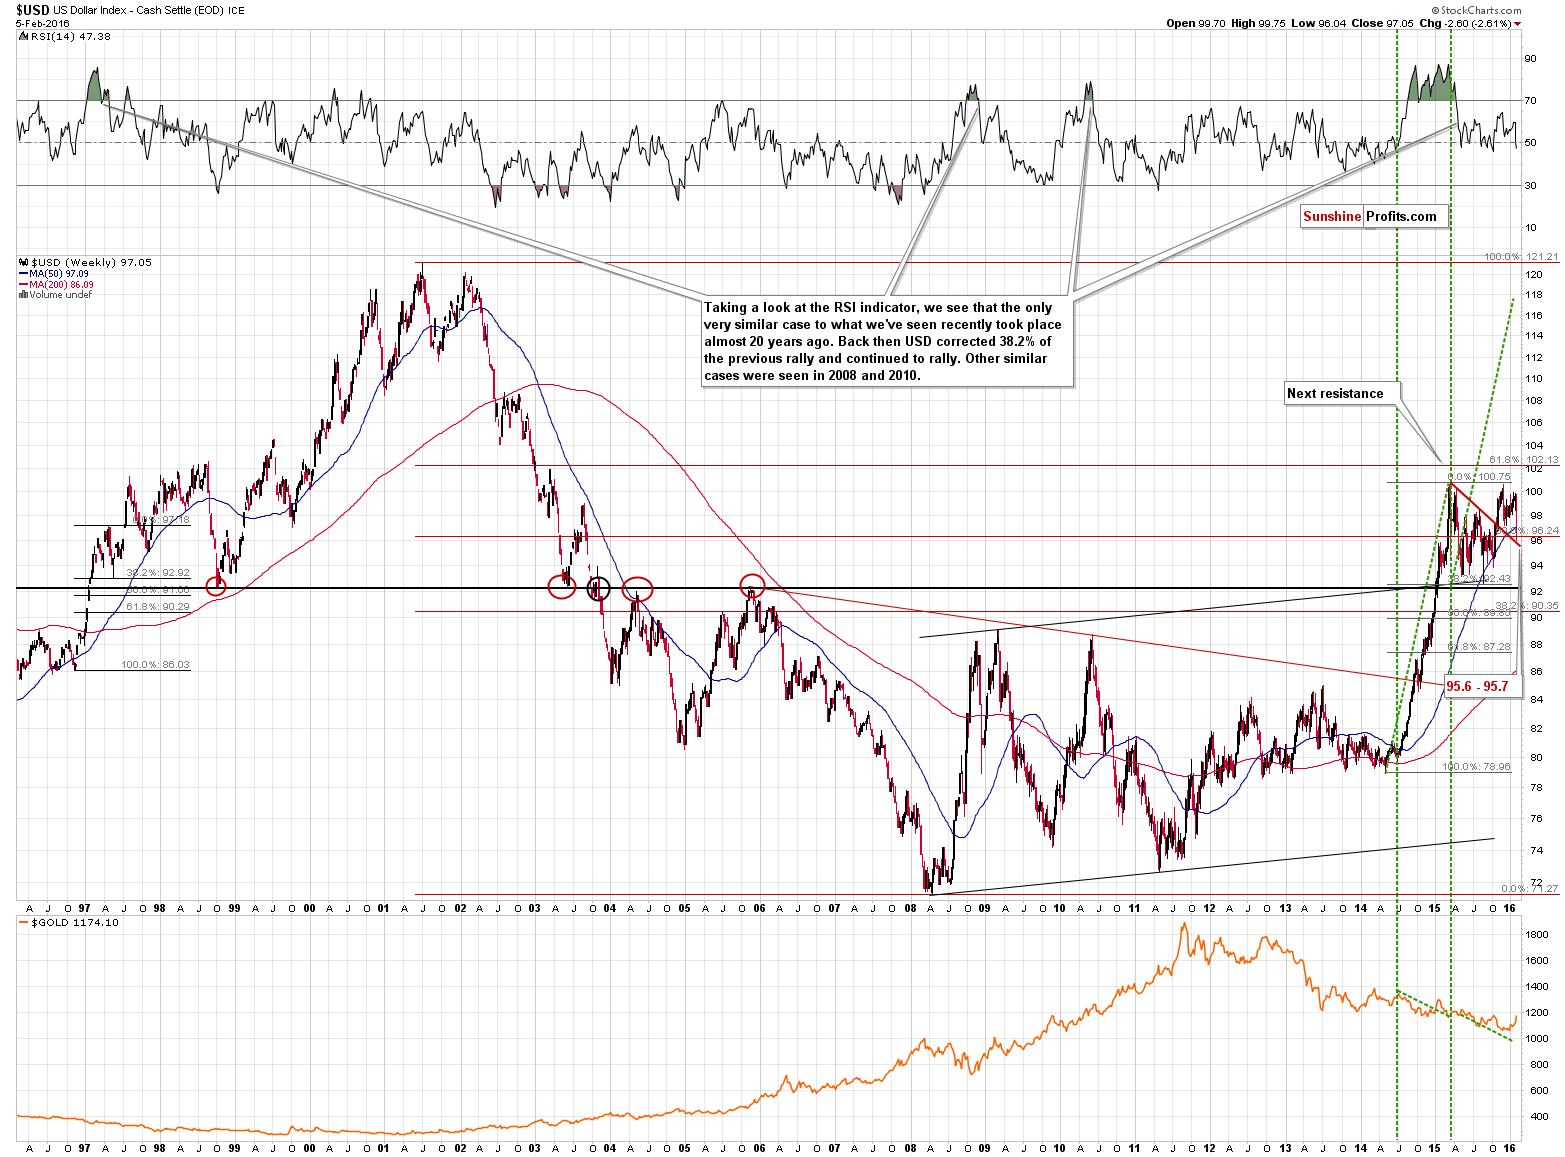
In short, our previous comments on the above chart remain up-to-date:
The above very long-term chart shows that the recent decline doesn’t change very much. It’s just a post-breakout correction. The USD Index broke above the declining red resistance line and rallied to 100 several weeks ago. It is now correcting this move. The likely target based on the above is the red line – which would now be verified as support. The line is currently at 95.7 but before it is reached it might move (being a declining line) to 95.6. That’s much lower than where the USD is today, but given the momentum that we’ve seen this week, we could see this level reached in just one session.
The USD Index moved to 96.04 last week, so it was very close to moving to the above-mentioned support line. Move to this support line seems quite likely to be seen this week.
The USD Index moved back up before the end of the week, which is a positive sign. Interestingly, it moved back to its 50-week resistance line and this is in tune with the past patterns – this moving average served as support and resistance on multiple occasions, including during the last few months. Whenever the USD broke below the 50-week moving average, it moved back up and closed the week right at or very close to it. We saw this phenomenon once again. This tendency suggests that if we see a downturn once again this week, then it could very well be the case that the USD would move back up before the end of the week once again. Consequently, we should be prepared for a move lower in the USD Index that will likely be temporary. The opposite is the case for the EUR/USD, but we’ll discuss details in today’s Forex Trading Alert.
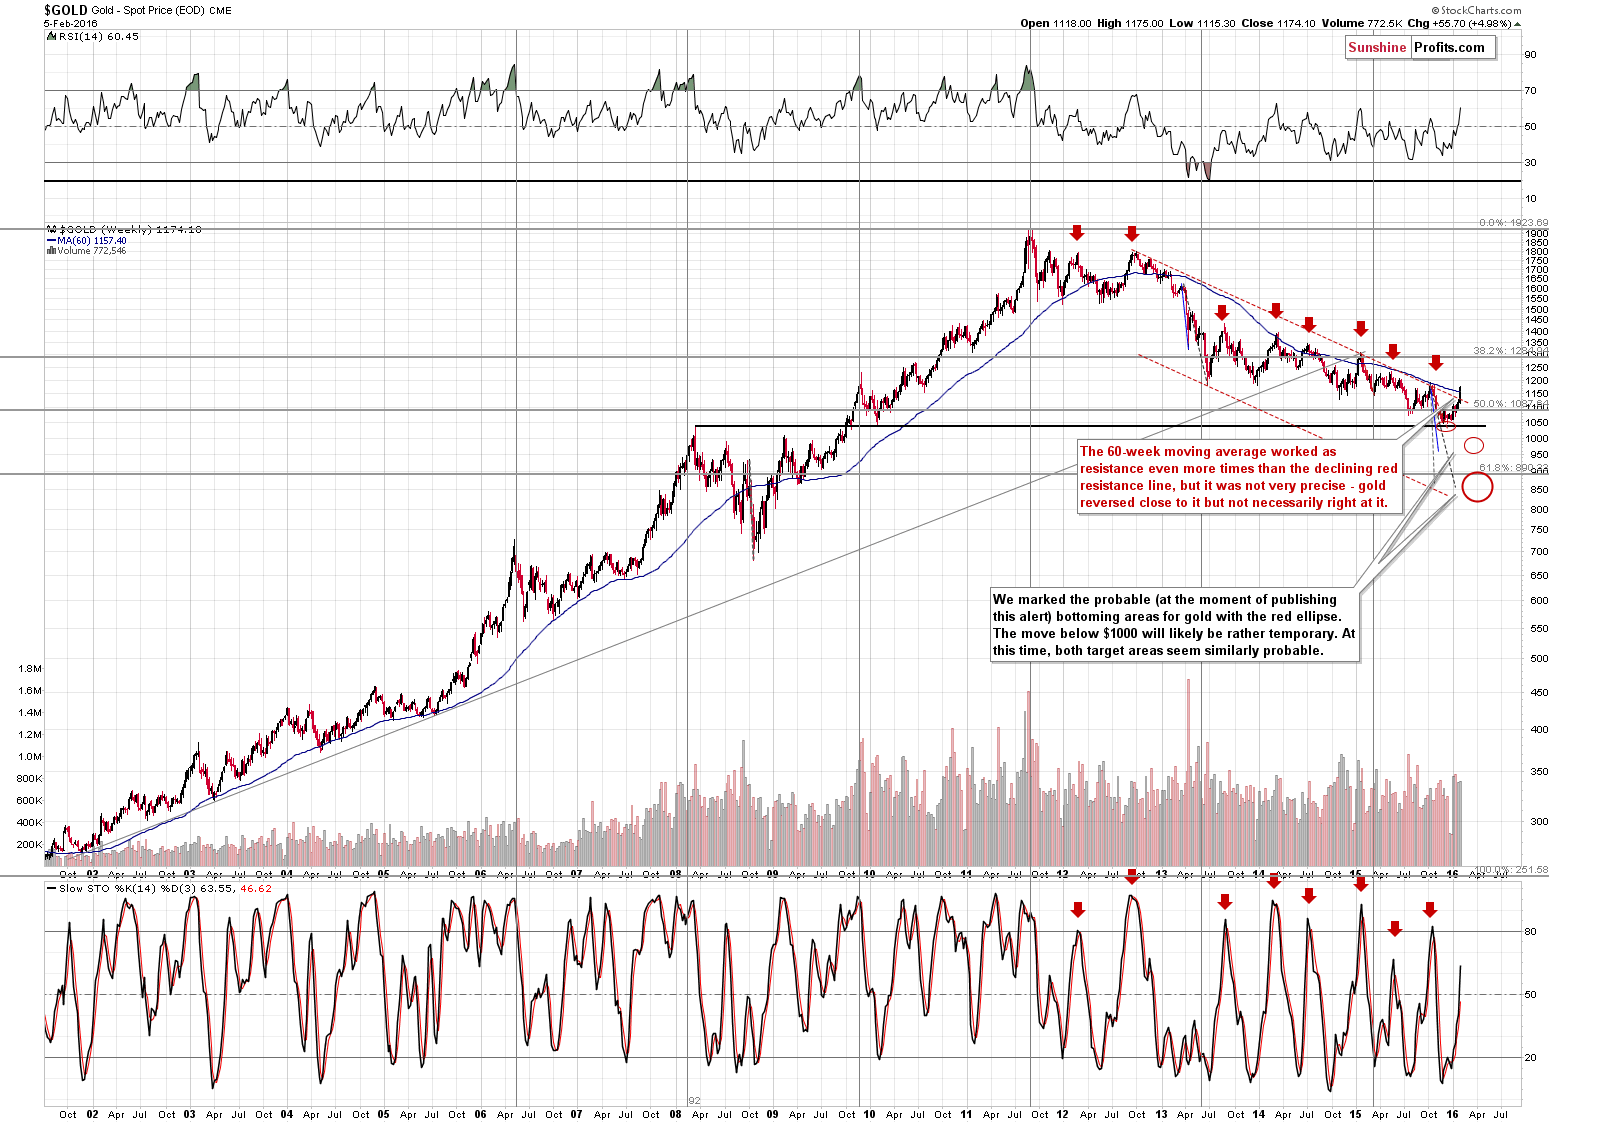
As far as gold is concerned, our previous comments regarding gold’s long-term chart remain up-to-date:
Gold moved to (and even above it on Friday) its 60-week moving average, which served as important resistance even more times than the declining red resistance line, so the medium-term outlook is still bearish. The problem with this line is that it stopped the previous rallies on an approximate basis – gold didn’t usually reverse right at it, but close to it. Consequently, the above chart doesn’t imply an immediate turnaround – it suggests that one will be seen relatively soon and that gold is not likely to move far (from the long-term point of view).
Gold moved a bit above the 60-week moving average on Friday and it remains in tune with the above tendency.
The RSI indicator is very close to its 2014 high, which also serves as a subtle (not very precise) indication that a top will be seen relatively soon, but may not be in just yet.
Overall, it seems that the local top is at hand, but most likely not yet in.
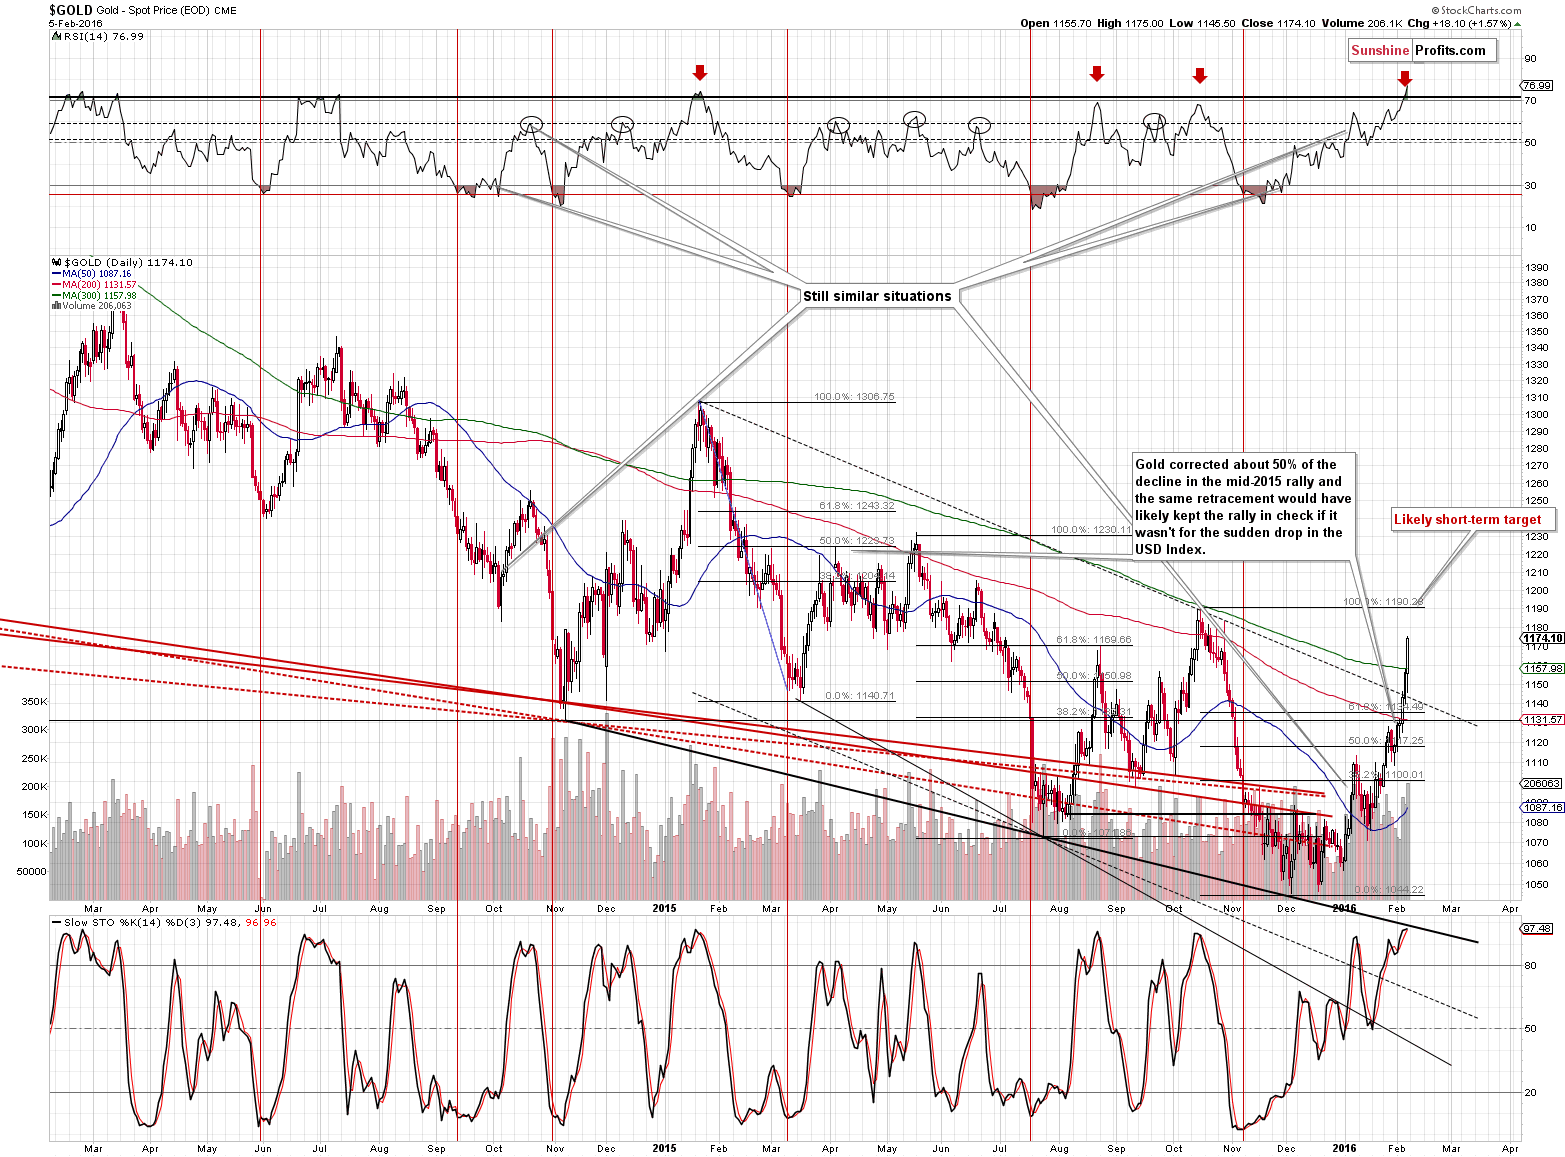
In Friday’s alert we wrote the following:
From the short-term point of view, we have just seen a breakout above the declining resistance line – the breakout is not confirmed, but still, the situation improved based on it. The RSI indicator is at the 70 level, which is a sell signal, but in light of the recent breakout we need to consider whether this signal is already very important or does it suggest that a turnaround can be seen in a few days. Back in January 2015, the RSI was also above 70, but gold rallied for a few more days before turning south again. Consequently, it seems that a turnaround is close, but it’s not certain that it’s here just yet.
The above remains up-to-date. Gold moved higher after the breakout (despite an intra-day move lower, which only served as a verification of the breakout) and it seems that it will move even higher as no major resistance level was reached on Friday. The RSI remains extremely overbought, suggesting that the turnaround will be seen shortly, but gold itself didn’t move to a resistance level just yet. The next target for gold is created by the October 2015 high ($1,190) and the $1,200 level, being a round number, is a quite likely resistance as well. All in all, it seems that gold’s rally will be stopped about $15 - $25 higher, which is in tune with what we wrote while describing gold’s long-term chart.
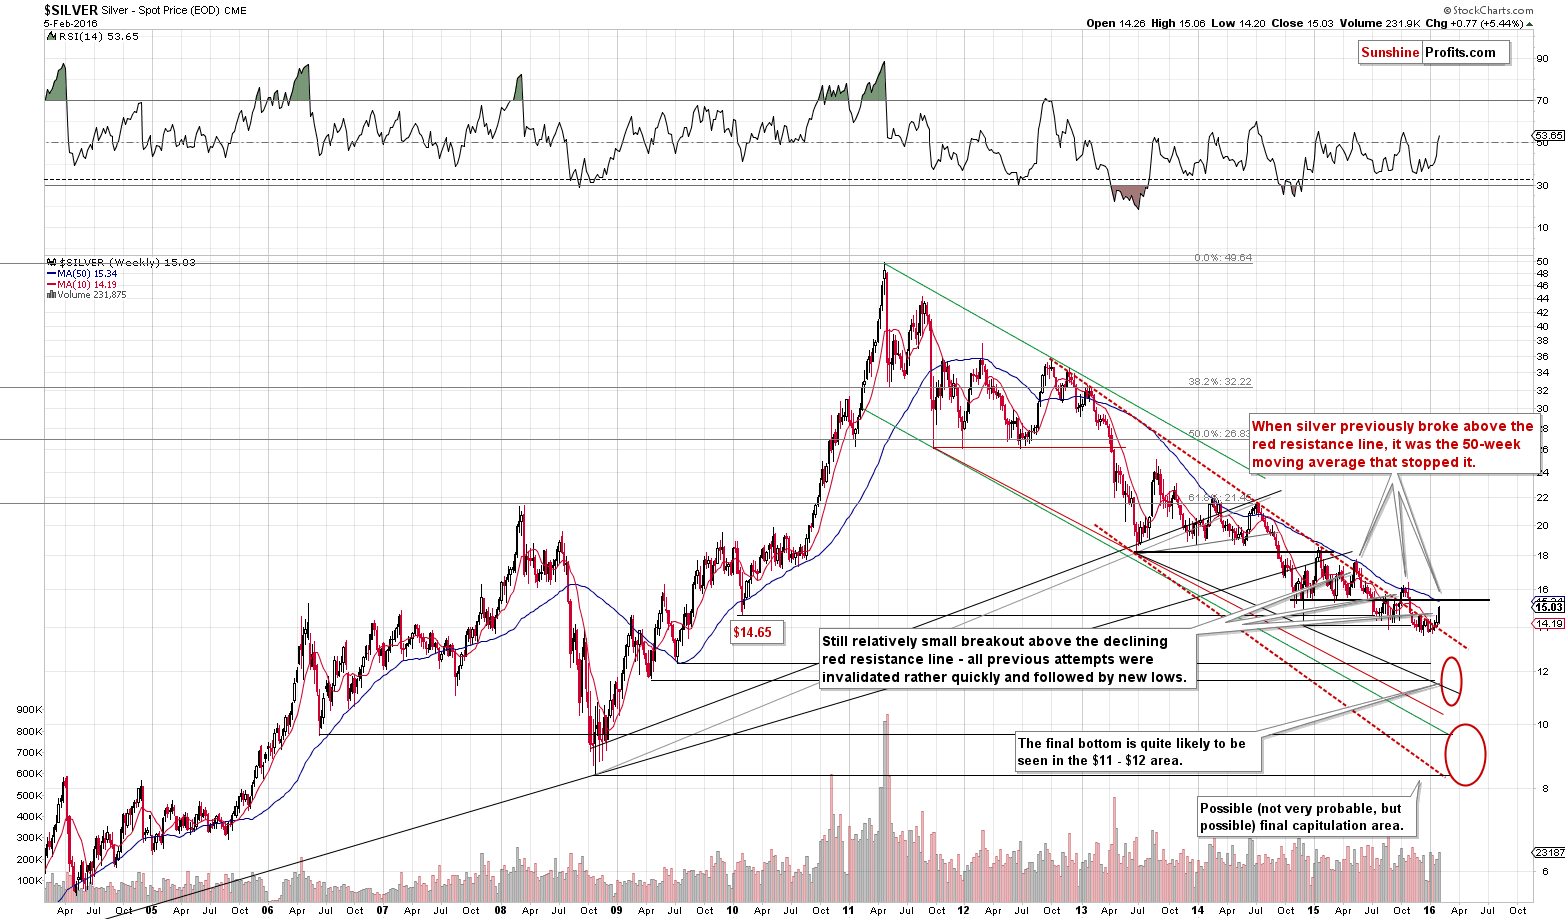
Our previous comments on silver remain up-to-date:
It’s too early to say anything bullish about silver at this time also because the previous breakouts above the declining red resistance were followed by invalidations. In these previous cases, silver moved to the 50-week moving average before reversing. This line coincides with the late-2014 lows, which make it a quite likely target level and a strong resistance. This moving average is currently at $15.34, so silver’s upside potential is rather limited.
As far as gold stocks are concerned, we recently wrote the following:
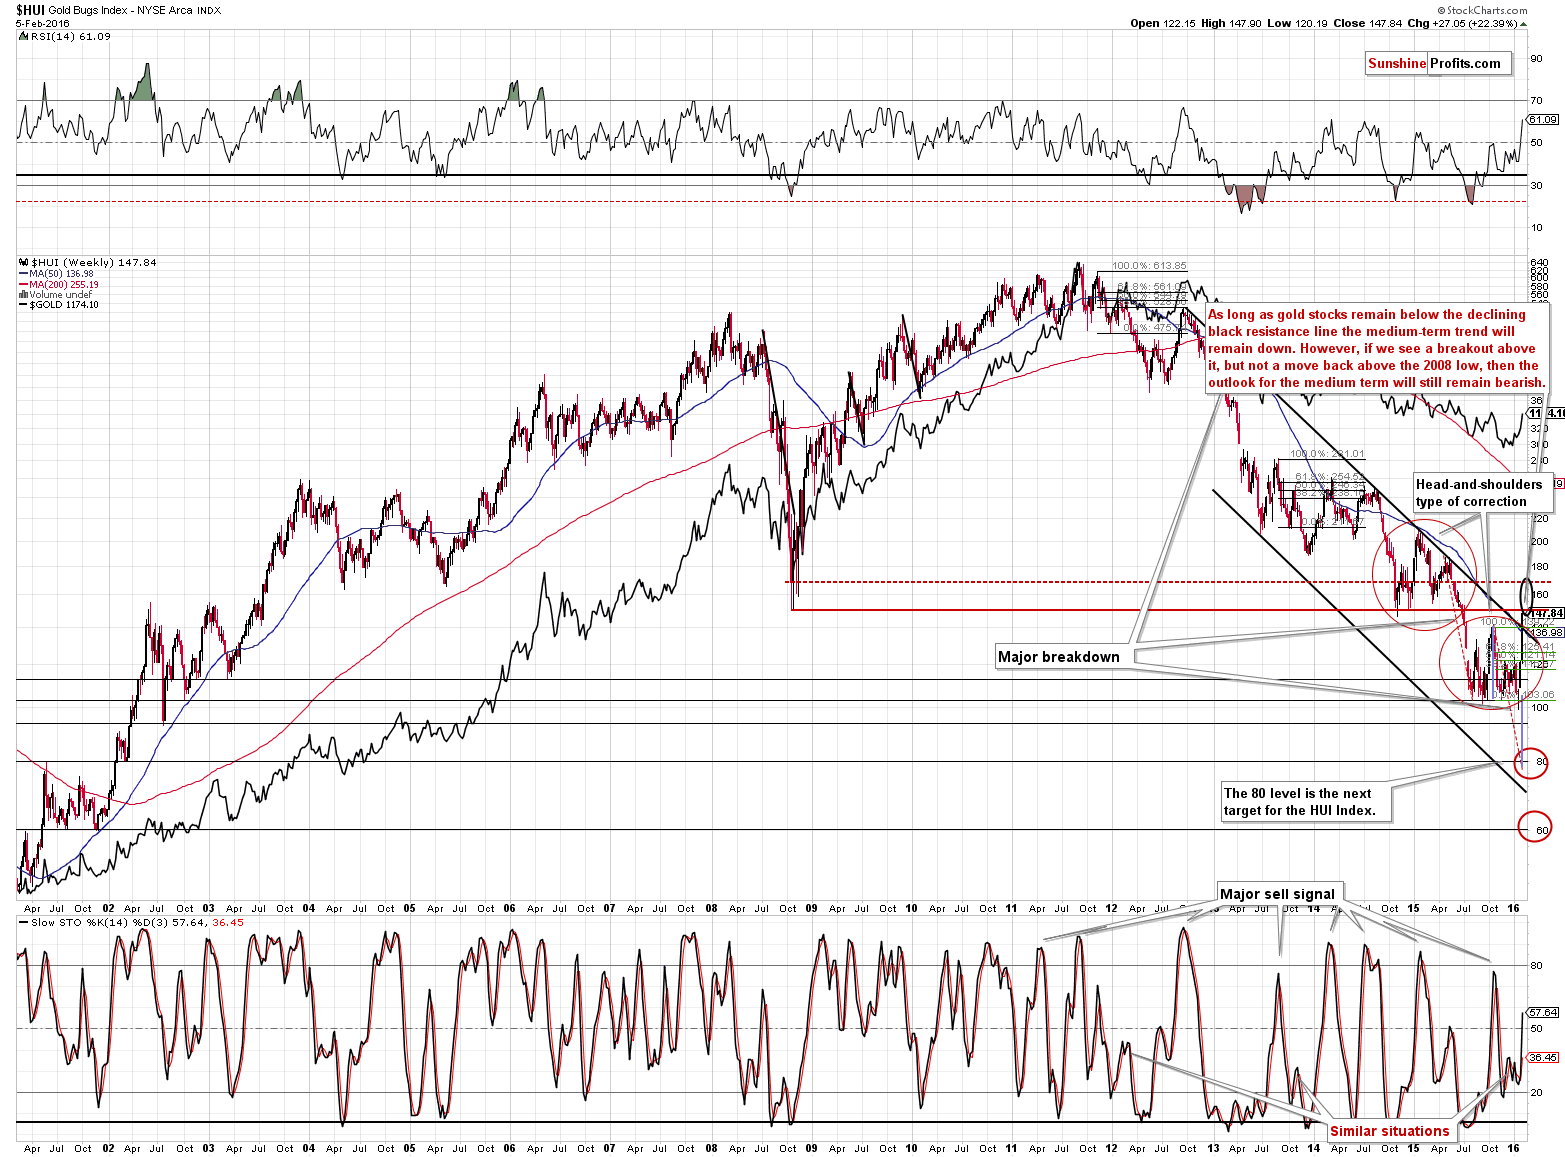
The HUI Index moved right to the long-term declining resistance line. This line stopped last year’s rallies and it’s very likely to stop the current one as well. This is a strong signal that the decline will resume right away. However, if that doesn’t happen and gold stocks move even higher, it will not be very bullish as long as miners remain below the 2008 low. In fact, in case of a breakout above the declining resistance line, the 2008 low would become the likely target.
Just as we indicated above, the 2008 low became the next target and likely resistance line. In intra-day terms the resistance is at 150 but in case of weekly closes the resistance is close to 170, so any price between these levels is a likely target. The early 2015 low is a bit below 160, so it’s more likely that the final top will be seen below 160, than above it, but it’s rather unclear at this time.
We were recently asked if this rally is indeed different than previous rallies because at this time mining stocks moved much higher despite a move lower in the main stock indices. Our reply is that this is still in tune with previous historical patterns – the same thing happened in late 2014 and early 2015. Miners soared sharply while the general stock market declined. What happened next? The value of the HUI Index was cut in half in the following months, declining from above 200 to about 100. Applying the same here gives us 80 as the target level, which has been our target for the next major bottom (perhaps the final bottom) anyway.
Let’s take a look at how strong mining stocks are relative to stocks.
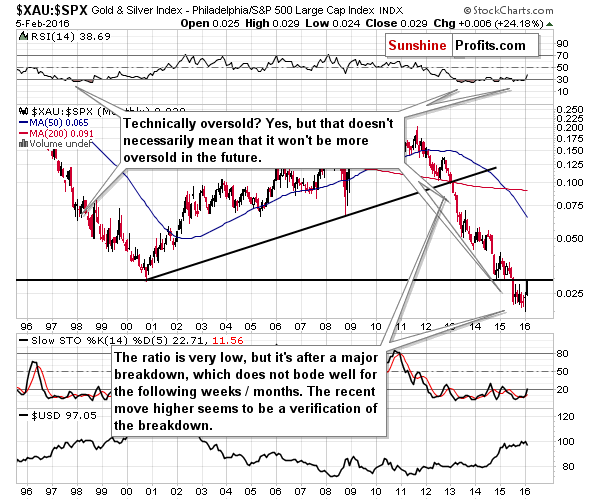
Taking a broader perspective allows us to see that the recent outperformance has simply been a verification of the previous breakdown below the 2000 low. As such it is not bullish – the breakdown remains in place as it was not invalidated.
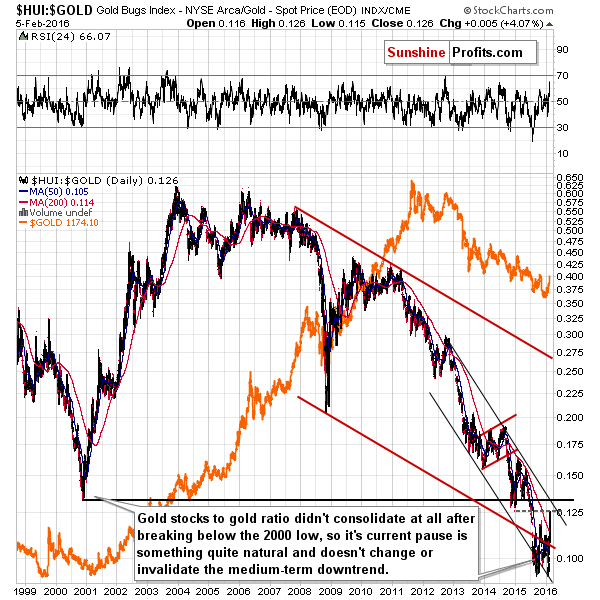
The performance of gold stocks relative to gold remains below its 2000 low as well. The recent move higher is significant on a short-term basis, but it is actually a verification of the previous breakdown – a move back to the broken level. The above chart features a support at the 2000 low, but also lower, at the 2015 low. Consequently, based on the gold stocks to gold relation, we could see an additional rally before a decline or we could see a turnaround right away.
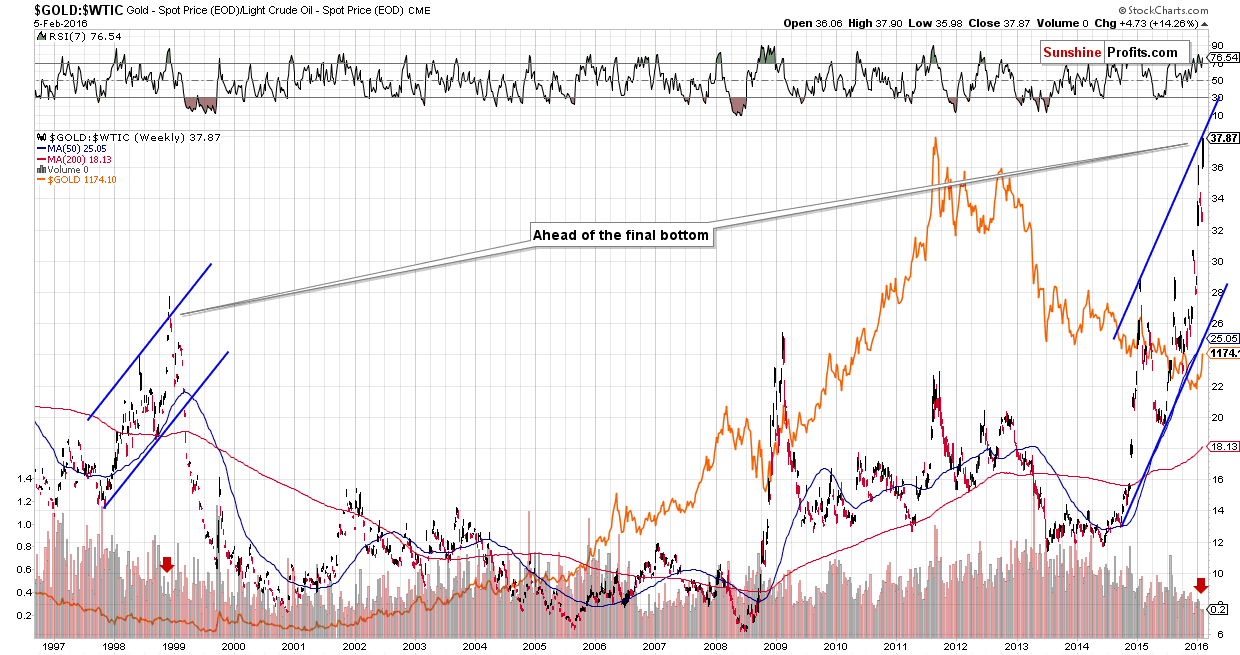
Finally, we would like to discuss the gold to oil ratio as it just did something very important. It moved to a resistance level based on the rising trend channel. This is a sign of a top on its own, but the additional bearish factor here is that we saw a similar type of action (big zigzag) a few months before the 1999 bottom. Back then gold moved slightly above the resistance line for one week and then the ratio – and gold – declined once again.
The above is particularly interesting because the outlook for crude oil is negative (as we explained in the recent Oil Trading Alerts and the Oil Investment Update that was posted on Friday) and if both oil, and the gold to oil ratio move lower, then it means that gold is likely to decline particularly significantly.
Summing up, a lot changed last week and we are in a situation where the medium-term outlook still remains down, but at the same time it seems that we will see even higher prices of gold, silver and mining stocks before the decline is resumed. The areas that are most likely to include tops for gold, silver and the HUI are: $1,190 - $1,200, $15.20-$15.40 and $150 - $165, respectively. We will wait for a sign of confirmation and very likely re-open the short positions this week. The downside targets for this trade would be just as they were for the previous trade – we don’t think they became less likely to be reached in the coming weeks and months.
As always, we will keep you – our subscribers – updated.
To summarize:
Trading capital (our opinion): No positions
Long-term capital (our opinion): No positions
Insurance capital (our opinion): Full position
Plus, you might want to read why our stop-loss orders are usually relatively far from the current price.
Please note that a full position doesn’t mean using all of the capital for a given trade. You will find details on our thoughts on gold portfolio structuring in the Key Insights section on our website.
As a reminder – “initial target price” means exactly that – an “initial” one, it’s not a price level at which we suggest closing positions. If this becomes the case (like it did in the previous trade) we will refer to these levels as levels of exit orders (exactly as we’ve done previously). Stop-loss levels, however, are naturally not “initial”, but something that, in our opinion, might be entered as an order.
Since it is impossible to synchronize target prices and stop-loss levels for all the ETFs and ETNs with the main markets that we provide these levels for (gold, silver and mining stocks – the GDX ETF), the stop-loss levels and target prices for other ETNs and ETF (among other: UGLD, DGLD, USLV, DSLV, NUGT, DUST, JNUG, JDST) are provided as supplementary, and not as “final”. This means that if a stop-loss or a target level is reached for any of the “additional instruments” (DGLD for instance), but not for the “main instrument” (gold in this case), we will view positions in both gold and DGLD as still open and the stop-loss for DGLD would have to be moved lower. On the other hand, if gold moves to a stop-loss level but DGLD doesn’t, then we will view both positions (in gold and DGLD) as closed. In other words, since it’s not possible to be 100% certain that each related instrument moves to a given level when the underlying instrument does, we can’t provide levels that would be binding. The levels that we do provide are our best estimate of the levels that will correspond to the levels in the underlying assets, but it will be the underlying assets that one will need to focus on regarding the sings pointing to closing a given position or keeping it open. We might adjust the levels in the “additional instruments” without adjusting the levels in the “main instruments”, which will simply mean that we have improved our estimation of these levels, not that we changed our outlook on the markets. We are already working on a tool that would update these levels on a daily basis for the most popular ETFs, ETNs and individual mining stocks.
Our preferred ways to invest in and to trade gold along with the reasoning can be found in the how to buy gold section. Additionally, our preferred ETFs and ETNs can be found in our Gold & Silver ETF Ranking.
As always, we'll keep you - our subscribers - updated should our views on the market change. We will continue to send out Gold & Silver Trading Alerts on each trading day and we will send additional Alerts whenever appropriate.
The trading position presented above is the netted version of positions based on subjective signals (opinion) from your Editor, and the Tools and Indicators.
As a reminder, Gold & Silver Trading Alerts are posted before or on each trading day (we usually post them before the opening bell, but we don't promise doing that each day). If there's anything urgent, we will send you an additional small alert before posting the main one.
=====
Latest Free Trading Alerts:
The U.S. economy added 151,000 jobs in January. What does it imply for the Fed policy and the gold market?
January Payrolls Report and Gold
=====
Hand-picked precious-metals-related links:
Gold is 2016's most beloved asset
Confusion and turmoil helps gold to shine
Here comes another Venezuela gold fire sale
Randgold’s full-year profit falls on gold price decline
Amplats shares jump to near five-month high
Anglo Platinum sees more price pain as it halts new projects
=====
In other news:
The global economy’s New Abnormal
Citi: The Global Economy Is Trapped in a ‘Death Spiral’
European Stocks Tumble to Lowest Since 2014 on Growth Concern
China's cash stockpile fell $100 billion last month
JP MORGAN STRATEGIST: Central banks tried to control the world … and failed miserably
Conflicting Economic Indicators Challenge Fed’s Policy Makers
A Record Number of Investors Are Piling Into Oil
Fining Bankers, Not Shareholders, for Banks’ Misconduct
Financial watchdog closes German unit of Canada's Maple Financial
=====
Thank you.
Sincerely,
Przemyslaw Radomski, CFA
Founder, Editor-in-chief
Gold & Silver Trading Alerts
Forex Trading Alerts
Oil Investment Updates
Oil Trading Alerts

