

Briefly: In our opinion, short (full) speculative positions in gold, silver and mining stocks are justified from the risk/reward point of view.
The precious metals sector moved higher while the USD Index declined and it seems that the bullish atmosphere for the precious metals is here to stay. However, this is the case only if one looks at the market only for a moment. After taking into account other factors, it appears that the situation is not as straightforward as it might seem at first sight.
Yesterday, we wrote that it seemed that people didn’t believe that the USD was really breaking higher just yet – after all, it hadn’t moved above its December 2015 high. During yesterday’s session, the USD moved lower, correcting most of the previous gains and this has likely made investors believe that the rally in the USD Index is over – which is not the case in our opinion. There was no major breakdown in the USD and it’s still likely to move higher.
Let’s take a closer look at what happened in the precious metals world (charts courtesy of http://stockcharts.com).
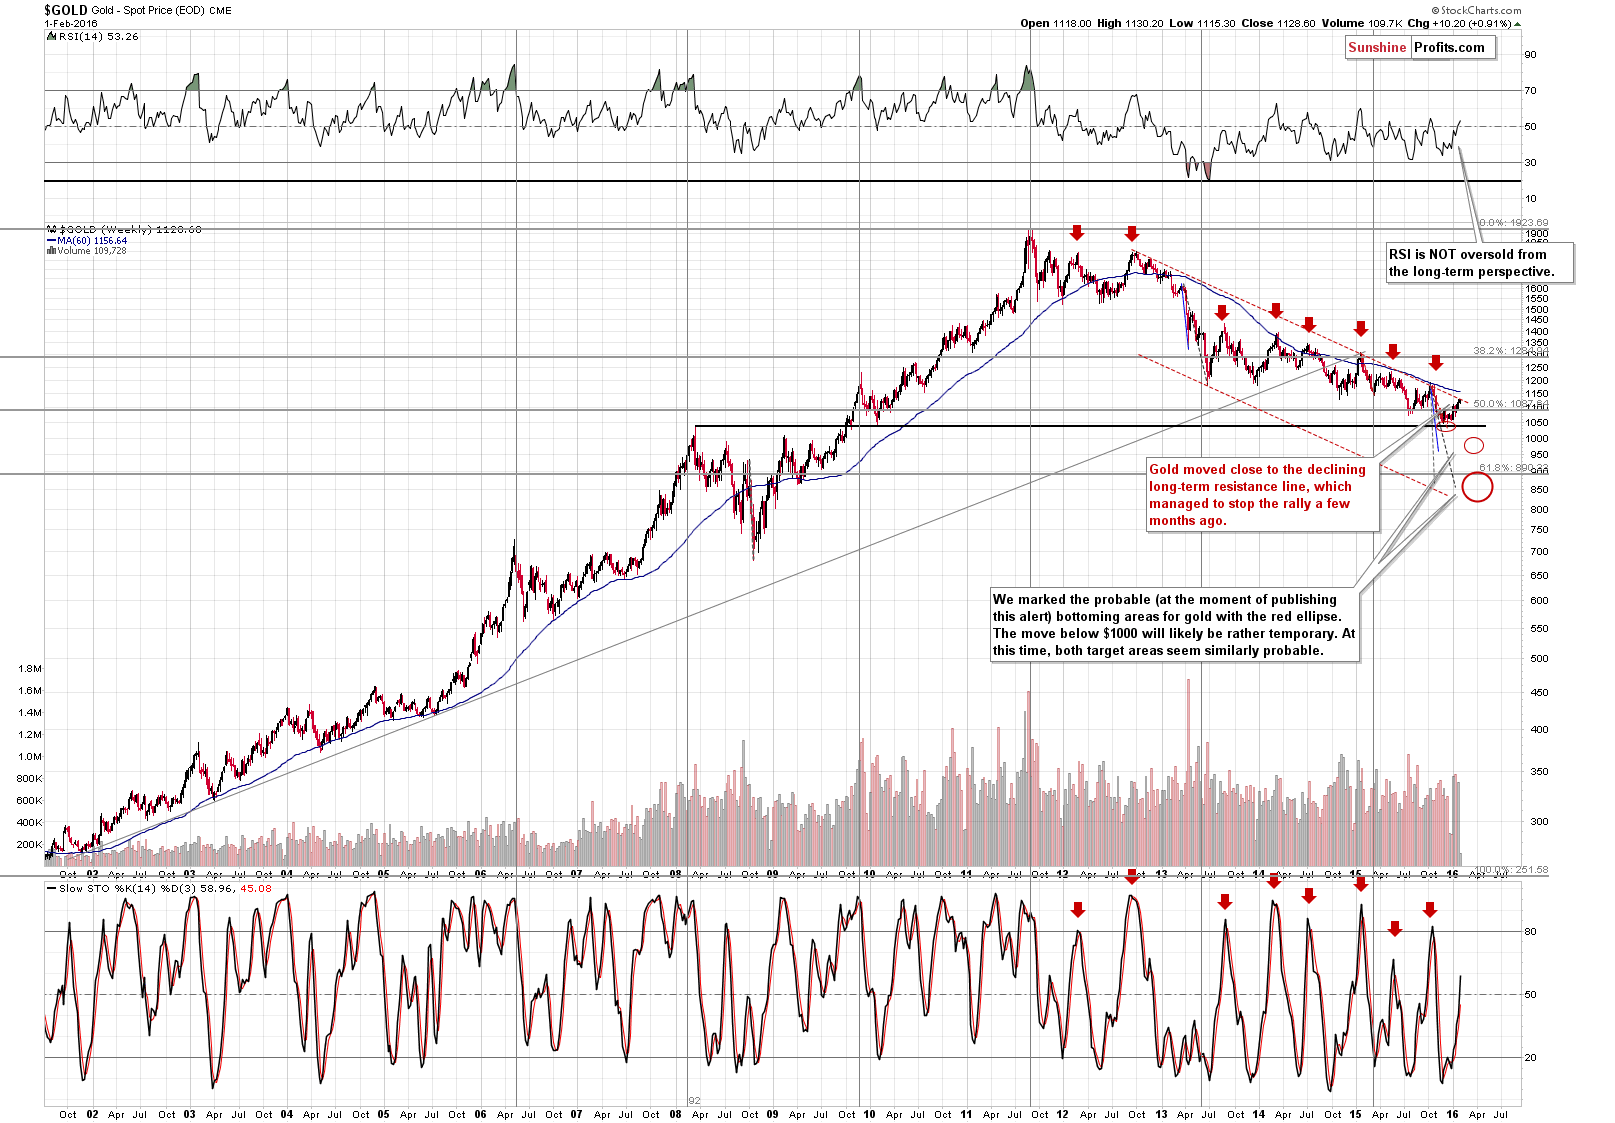
Starting with gold’s long-term chart, we once again see no major changes in the past few days and our previous comments remain up-to-date:
We see that gold approached the declining resistance line and that’s one important factor that alone could suggest opening short positions, not long ones. This line stopped the rally in late 2015 and it’s currently created by 3 major tops: the late 2012 top, early 2015 top and late 2015 top and this makes it a strong resistance.
Back in late 2015 gold moved a bit above this line, so we can’t rule out a move above it this time either, but it’s unlikely that this move would be significant. Gold has moved to this line if we base it on the weekly closing prices. If highs are considered, then this line is at about $1,134 (since the line is declining, this level is now lower).
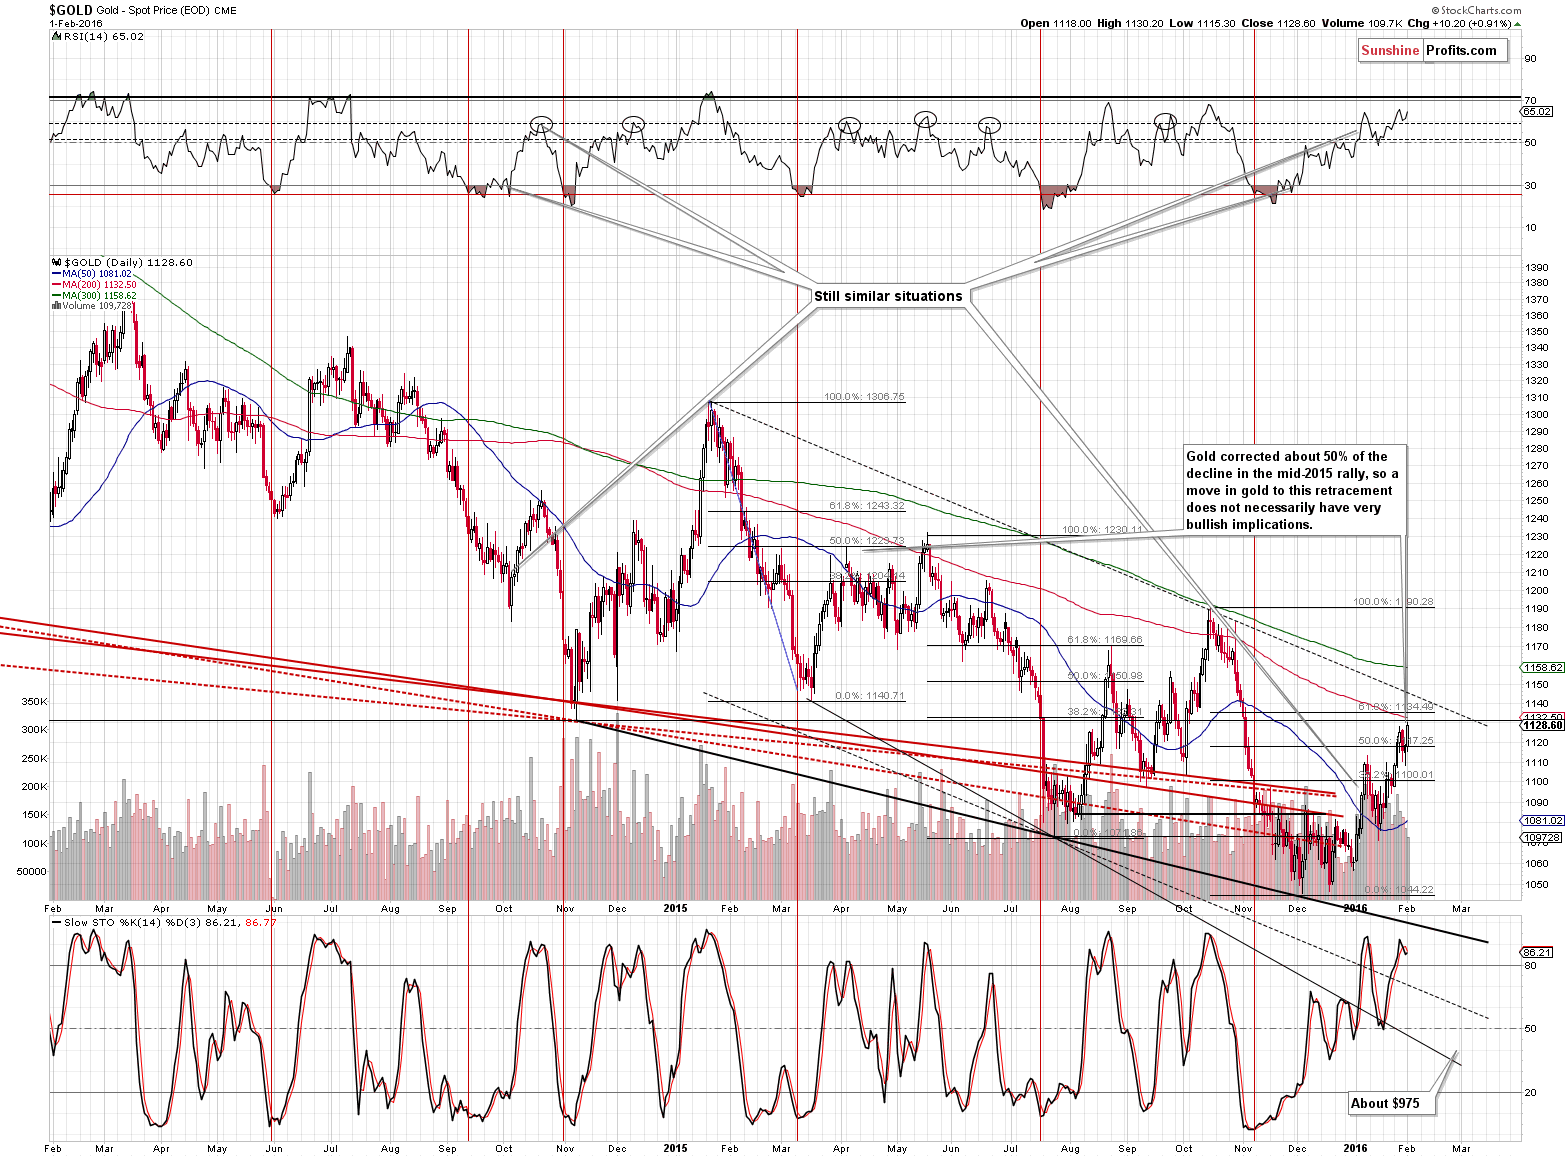
The $1,134 level is also where we have the 61.8% Fibonacci retracement level and is very close to the 200-day moving average. This levels serves as a strong resistance and it’s quite likely that gold will reverse right after moving to this level or very close to it (in fact, gold is already relatively close to it and it could turn around shortly).
The sell signal from the Stochastic indicator was not invalidated and the implications thereof remain bearish.
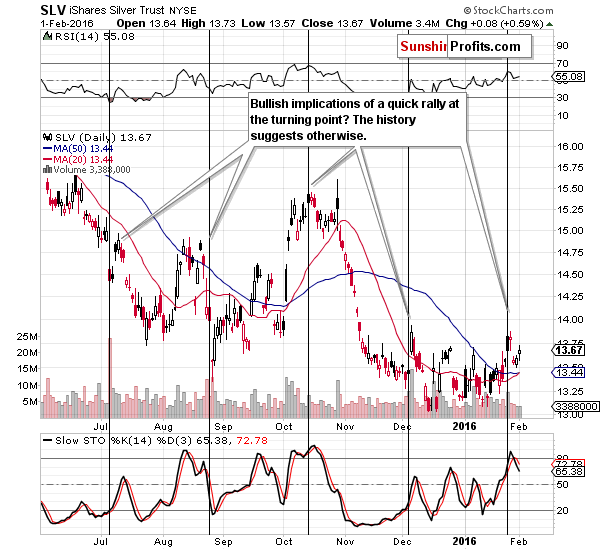
Silver moved a bit higher (8 cents) yesterday but this didn’t change much – this action is more or less in tune with what we had seen previously – tops were formed very close to the turning points, but the shape of the decline varied – some had an additional small consolidation before declining (like was the case in late October 2015 – before you ask, no, we don’t expect silver to soar on an intra-day basis like it did at the end of October 2015). The implications remain bearish, especially that silver moved higher on relatively low volume.
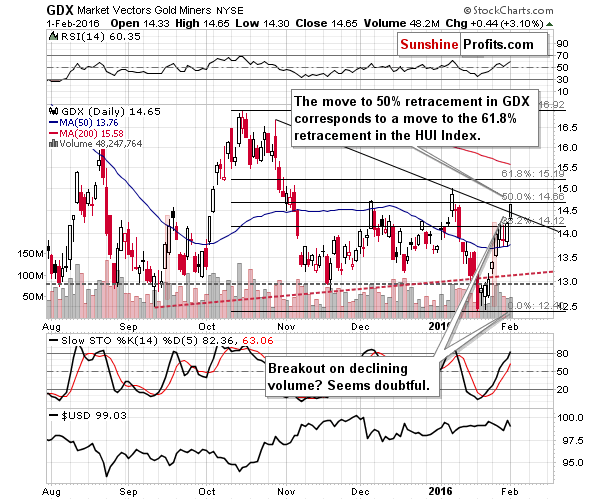
The volume seen in mining stocks wasn’t huge either. Comparing it to what we saw in the recent days makes yesterday’s volume appear rather small. It’s not tiny enough to be a screaming sell signal, but it’s low enough to make us doubt the validity of the breakout above the declining resistance line. This is especially that case since the GDX ETF moved right to the 50% Fibonacci retracement level and the HUI Index at the same time moved to its 61.8% Fibonacci retracement. Combining the above with generally bearish implications of the silver chart and very strong resistance in gold very close to the current price makes us think that the breakout will be invalidated sooner rather than later.
Summing up, much less changed in the precious metals market than it appears to be the case at the first sight. Gold is below a combination of strong resistance levels, while the trend in the USD Index remains up. This makes the outlook bearish for the precious metals sector and the situation in silver seems to confirm it. Mining stocks moved higher, but the resistance that they reached is quite important in case of both GDX and HUI, so once gold gives the sell signal, miners are likely to reverse relatively quickly.
As always, we will keep you – our subscribers – updated.
To summarize:
Trading capital (our opinion): Short positions (full) in gold, silver and mining stocks are justified from the risk/reward perspective with the following stop-loss orders and initial target price levels:
- Gold: initial target price: $973; stop-loss: $1,143, initial target price for the DGLD ETN: $117.70; stop-loss for the DGLD ETN $74.28
- Silver: initial target price: $12.13; stop-loss: $14.83, initial target price for the DSLV ETN: $101.84; stop-loss for DSLV ETN $57.49
- Mining stocks (price levels for the GDX ETF): initial target price: $10.23; stop-loss: $15.47, initial target price for the DUST ETF: $31.90; stop-loss for the DUST ETF $10.61
In case one wants to bet on junior mining stocks' prices (we do not suggest doing so – we think senior mining stocks are more predictable in the case of short-term trades – if one wants to do it anyway, we provide the details), here are the stop-loss details and initial target prices:
- GDXJ ETF: initial target price: $15.23; stop-loss: $21.13
- JDST ETF: initial target price: $52.99; stop-loss: $21.59
Long-term capital (our opinion): No positions
Insurance capital (our opinion): Full position
Plus, you might want to read why our stop-loss orders are usually relatively far from the current price.
Please note that a full position doesn’t mean using all of the capital for a given trade. You will find details on our thoughts on gold portfolio structuring in the Key Insights section on our website.
As a reminder – “initial target price” means exactly that – an “initial” one, it’s not a price level at which we suggest closing positions. If this becomes the case (like it did in the previous trade) we will refer to these levels as levels of exit orders (exactly as we’ve done previously). Stop-loss levels, however, are naturally not “initial”, but something that, in our opinion, might be entered as an order.
Since it is impossible to synchronize target prices and stop-loss levels for all the ETFs and ETNs with the main markets that we provide these levels for (gold, silver and mining stocks – the GDX ETF), the stop-loss levels and target prices for other ETNs and ETF (among other: UGLD, DGLD, USLV, DSLV, NUGT, DUST, JNUG, JDST) are provided as supplementary, and not as “final”. This means that if a stop-loss or a target level is reached for any of the “additional instruments” (DGLD for instance), but not for the “main instrument” (gold in this case), we will view positions in both gold and DGLD as still open and the stop-loss for DGLD would have to be moved lower. On the other hand, if gold moves to a stop-loss level but DGLD doesn’t, then we will view both positions (in gold and DGLD) as closed. In other words, since it’s not possible to be 100% certain that each related instrument moves to a given level when the underlying instrument does, we can’t provide levels that would be binding. The levels that we do provide are our best estimate of the levels that will correspond to the levels in the underlying assets, but it will be the underlying assets that one will need to focus on regarding the sings pointing to closing a given position or keeping it open. We might adjust the levels in the “additional instruments” without adjusting the levels in the “main instruments”, which will simply mean that we have improved our estimation of these levels, not that we changed our outlook on the markets. We are already working on a tool that would update these levels on a daily basis for the most popular ETFs, ETNs and individual mining stocks.
Our preferred ways to invest in and to trade gold along with the reasoning can be found in the how to buy gold section. Additionally, our preferred ETFs and ETNs can be found in our Gold & Silver ETF Ranking.
As always, we'll keep you - our subscribers - updated should our views on the market change. We will continue to send out Gold & Silver Trading Alerts on each trading day and we will send additional Alerts whenever appropriate.
The trading position presented above is the netted version of positions based on subjective signals (opinion) from your Editor, and the Tools and Indicators.
As a reminder, Gold & Silver Trading Alerts are posted before or on each trading day (we usually post them before the opening bell, but we don't promise doing that each day). If there's anything urgent, we will send you an additional small alert before posting the main one.
=====
Latest Free Trading Alerts:
Yesterday, gold hit a 3-month high on weak economic data. What does it mean for the U.S. economy and the gold market?
Gold Rises on Weak Economic Data
=====
Hand-picked precious-metals-related links:
Rise in gold prices won't last, say analysts
World’s largest silver producer slams silver benchmarking controversy
The silver fix may have its days numbered
=====
In other news:
Euro-Area Unemployment Falls as ECB Weighs Stimulus Measures
Rate hike? Not until 2017, says market
UBS profit up 79% amid 'paralyzing' volatility
Which oil nation will need bailing out next?
Morgan Stanley: This Is What a World Without Oil Looks Like
BP Profit Falls 91%, Missing Estimates, as Oil Slump Deepens
=====
Thank you.
Sincerely,
Przemyslaw Radomski, CFA
Founder, Editor-in-chief
Gold & Silver Trading Alerts
Forex Trading Alerts
Oil Investment Updates
Oil Trading Alerts

