

Briefly: In our opinion, short (full) speculative positions in gold, silver and mining stocks are justified from the risk/reward point of view.
There are 2 major factors that are currently in play in addition to what we can currently see on the charts: the bullishness among investors regarding the precious metals market and upcoming comments from the Fed. During very similar moments in the recent past, the precious metals market reacted in a very specific way – will the history repeat itself?
This reaction to the Fed’s statements was to decline sharply. The past few times it was the case that the precious metals sector moved higher just ahead of the Fed’s comments, we received multiple e-mails regarding these moves, we sent out a second alert saying that nothing changed and the markets indeed declined after the Fed’s comments or an important data release. We are currently once again right before the announcement.
Let’s move to the charts (charts courtesy of http://stockcharts.com).
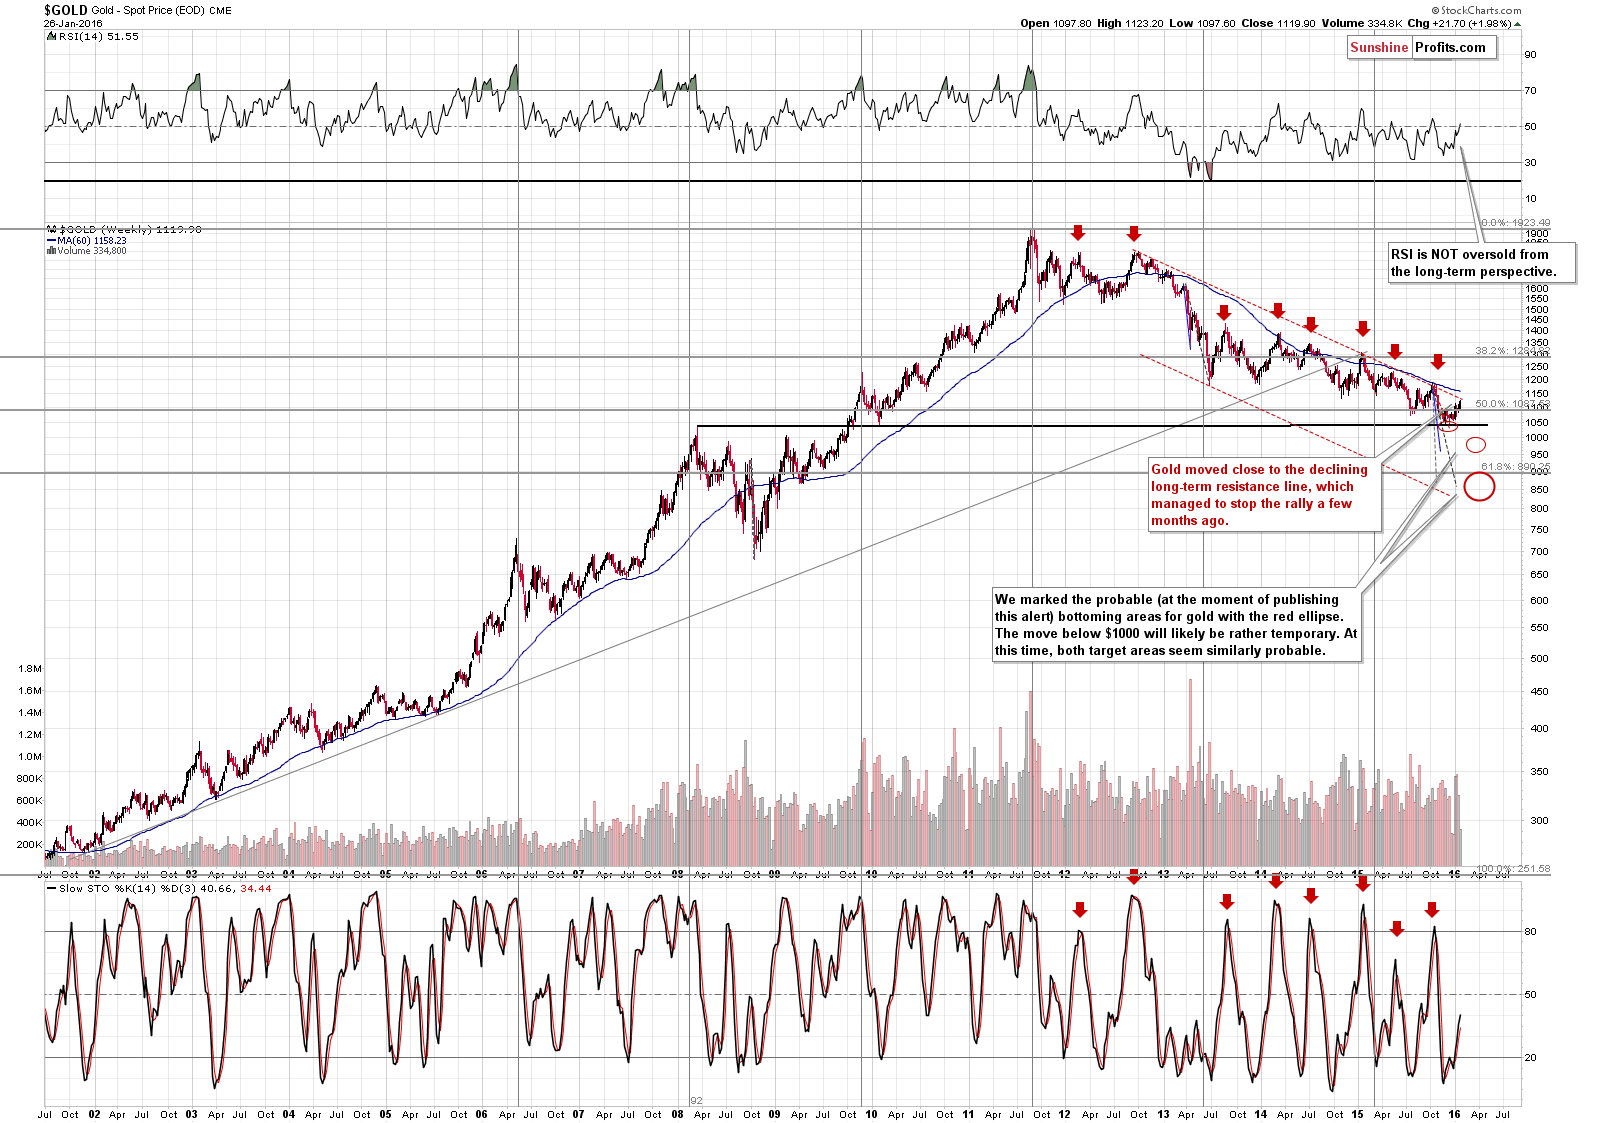
Starting with gold’s long-term chart, we see that gold approached the declining resistance line and that’s one important factor that alone could suggest opening short positions, not the long ones. This line stopped the rally in late 2015 and it’s currently created by 3 major tops: the late 2012 top, early 2015 top and late 2015 top and this makes it a strong resistance.
Back in late 2015 gold moved a bit above this line, so we can’t rule out a move above it this time either, but it’s unlikely that this move would be significant (more than $20+). At this time gold is right at this line if we base it on the weekly closing prices. If highs are considered, then this line is at about $1,137.
The $1,137 level corresponds more or less to the 200-day moving average and the 61.8% Fibonacci retracement level. Consequently, if gold moves higher, it will very likely be stopped around these levels.
If.
For a few weeks, the above chart has been featuring the following description:
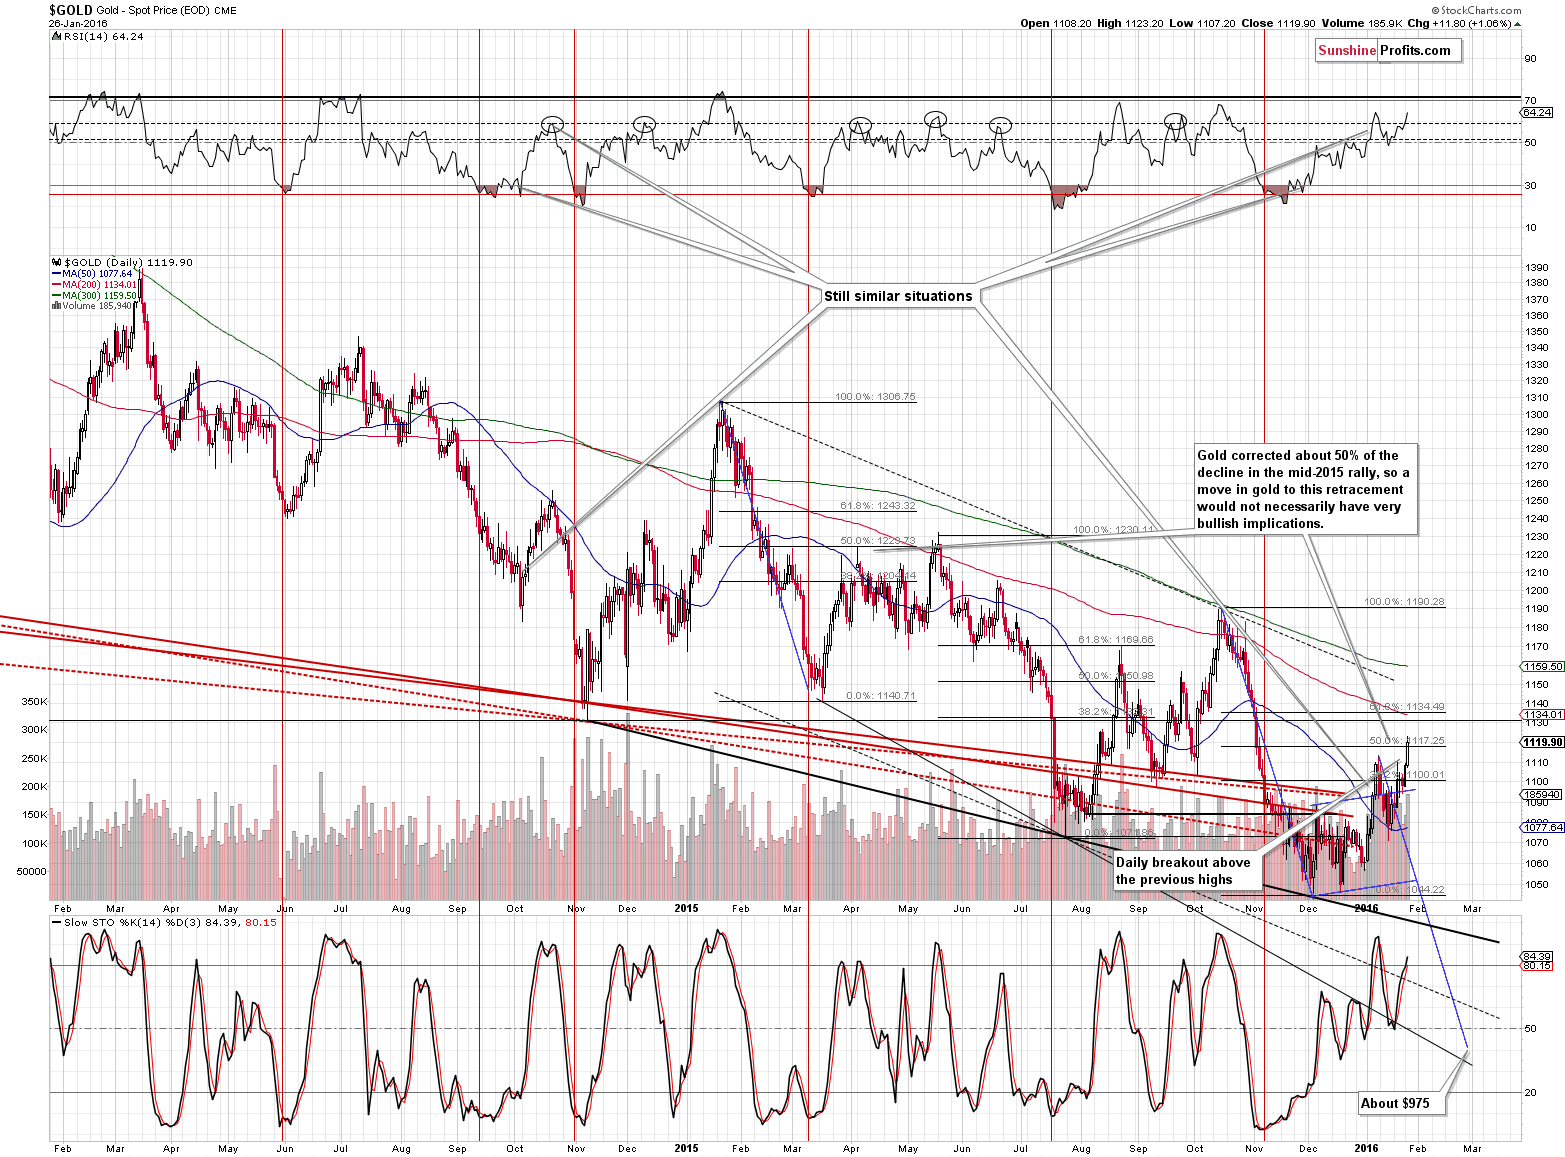
“Gold corrected about 50% of the decline in the mid-2015, so a move in gold to this retracement would not necessarily have very bullish implications”.
Gold just moved to this retracement and – as you’ve read many times before, it does not necessarily have bullish implications. In fact, right now, the current move higher is even more similar to the March – May 2015 corrective upswing than it was the case when we wrote about this similarity previously.
The declines (marked in blue) were almost identical. The initial corrective upswing took gold above the 38.2% retracement, but not above the 50% one. Back in 2015 there was another move higher during which gold broke above the 50% retracement, which is what we have just seen as well. Back in 2015 it took about 2 months before gold moved from the bottom to the top and almost the same is the case right now – the post-decline corrective upswing has taken almost 2 months now. The volume one which the previous rally ended is rather similar to what we’re seeing right now. The position of the Stochastic and RSI indicators was very similar as well.
Consequently, gold is repeating a very similar pattern from the past and according to this pattern the yellow metal is likely to decline shortly. Based on the long-term chart we can say that even if it doesn’t, the upside in the short term is likely very limited. Therefore, it is a short position that one should be at least considering now, not a long one.
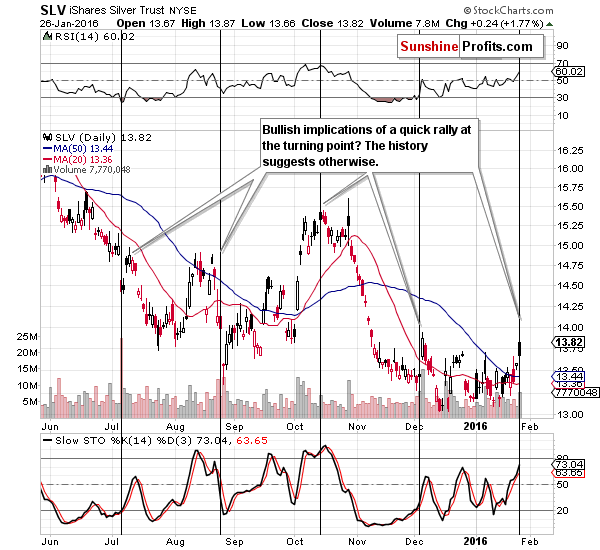
Silver moved higher right at the cyclical turning point, which has bearish implications. If silver is truly in an early phase of a major move higher, then it would be something against practically all similar cases in the recent past. Please note that silver’s sharp rallies at or close to the cyclical turning points were always followed by significant declines and each of them was bigger than silver’s recent move higher. Is silver’s yesterday’s rally really bullish? No.
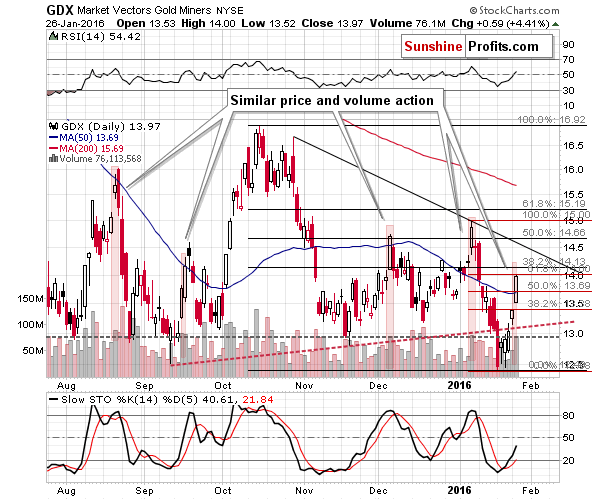
The action seen in mining stocks appears bullish on a stand-alone basis (when taking the single session into account) as miners moved higher on relatively high volume and closed above the 50-day moving average.
However, there are bearish signs as well and ignoring the context often proves costly. First of all, mining stocks didn’t move above the 61.8% Fibonacci retracement (the one based on the 2016 decline) and they didn’t even move to the 38.2% Fibonacci retracement based on the October 2015 – January 2016 decline. Technically, the move higher remains a correction.
Secondly, mining stocks are visibly below their previous 2016 high whereas gold broke above it – that’s something that we see at or right before the tops.
Most importantly, we would like to focus on the 50-day moving average and yesterday’s small breakout. On a stand-alone basis it might be viewed as bullish especially that the size of the volume was significant… If it weren’t the case that exactly the same thing had been seen previously when mining stocks moved above the 50-day moving average. We marked the similar situations in red. In August 2015, September 2015, December 2015 and earlier in January 2016 we saw breakouts above the 50-day moving average that were similar to the current one and the size of the volume was very similar as well. What happened next? Mining stocks declined – if not right away than within the following couple of days.
There was only one time when mining stocks truly broke above the 50-day moving average and that was in early October 2015. The session when we saw this breakout was not similar to yesterday’s session – the size of the rally and the volume that accompanied it was much bigger than what we saw yesterday.
There were also 2 other attempts to move above the 50-day moving average that were not successful, but their implications are only a little bearish, because the volume was not similar to what we saw yesterday.
Overall, a rally on sizable volume is generally a bullish event in any market, but based on what followed similar sessions (and the small breakouts above the 50-day moving average) we don’t view it as such. In fact, one can say that the implications are bearish for the short-term (but rather nonexistent for the immediate-term).
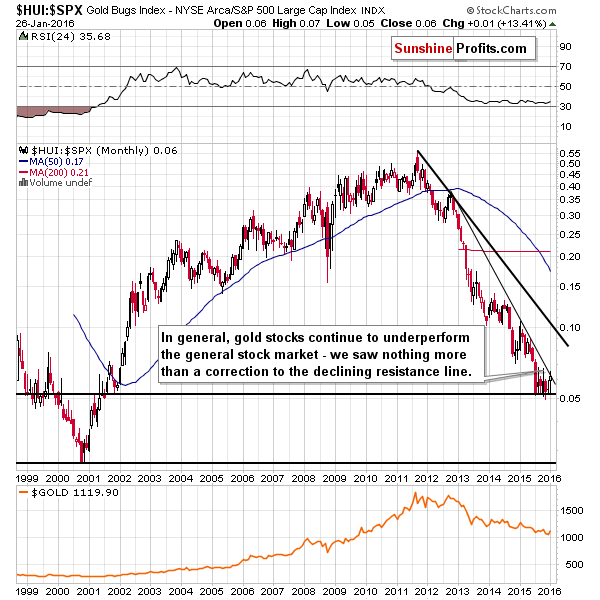
Comparing the performance of gold stocks to the general stock market continues to show that there was no breakout and that the trend remains down. The implications are bearish as the HUI to S&P 500 ratio is at its declining medium-term resistance line.
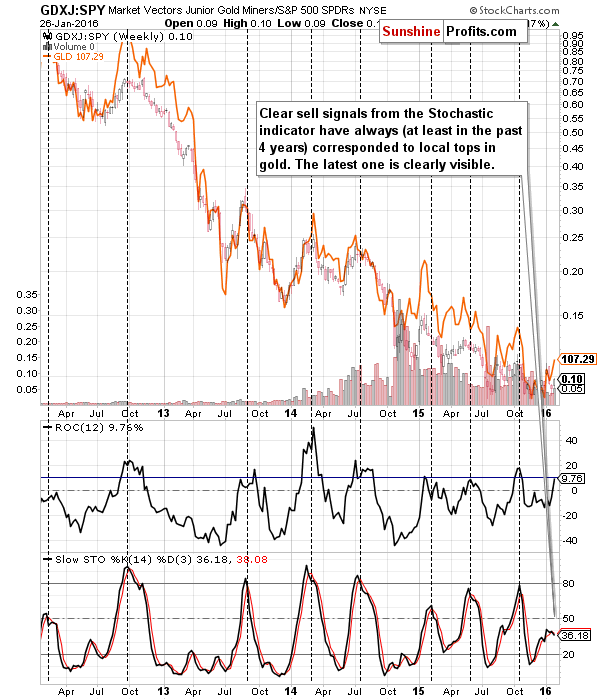
The interesting thing is that despite yesterday’s rally in the precious metals sector, the situation in the GDXJ to SPY ratio improved only a little – based on yesterday’s closing prices we still get an important sell signal. Consequently, our yesterday’s comments on the above chart remain up-to-date:
Speaking of ratios, GDXJ to SPY is a little-followed but very important and reliable indicator for the precious metals market. Plotting Stochastic and the Rate of Change indicator on the above ratio allow us to detect moments when juniors are right after a short-term outperformance relative to other stocks and these were very often (in the past few years – always) periods right before yet another decline in gold.
We are currently seeing the indicators in the position that suggests another slide is just around the corner. Please note that the above chart is based on weekly closing prices and this week is not over yet, but the sell signal in the Stochastic indicator is quite visible and thus if nothing changes in terms of prices, we will have a strong sell signal at the end of the week. In other words, not only what happened recently is not bullish – it’s bearish.
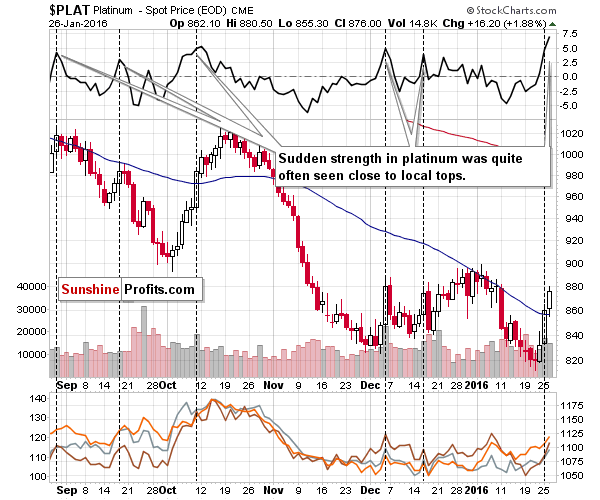
Meanwhile, platinum soared once again. It moved even above its 50-day moving average, so the odds are that the rally is over or almost over, just like it was the case in October, but that’s not the most important thing that we can infer from the above chart. The key thing is that the entire 2-day move was very sharp and sizable. Why is this significant? Because that’s against the medium-term trend and because it was preceded by long period of platinum’s underperformance relative to the rest of the precious metals sector.
We discussed this issue thoroughly yesterday, but we’d like to quote these explanations as they are very important and we don’t want them to be missed by those who subscribed today and yesterday after we posted our previous alert:
The thing is that the weak and low-volume parts of a given market or sector tend to outperform right before a top. The likely reason is that the general public usually enters the market close to local tops and these investors tend to buy assets that appear cheap (regardless of the existence of good reasons for that in the first place). The general public doesn’t care about trends, valuations, etc. – the simple fact is that this part of the market hasn’t rallied “yet”, so “it’s likely” to catch up. This doesn’t have to happen and usually doesn’t, but it appears that the general public tends to believe this will be the case. We have seen this kind of behavior in many markets and sectors on a few levels (a sector within a market, or an individual stock within a sector).
On a side note, it is for a similar reason that juniors mining stocks tend to outperform senior mining stocks in the final parts of a rally – because juniors are also relatively more popular among the general public as they appear “cheaper” and thus having greater profit potential. On the other hand, institutional investors often can’t invest in juniors due to either regulations or the fact that juniors are being traded on so thin volume that it’s impossible to put a large amount of money into a junior stock without moving it significantly. You can read more about juniors in our Dictionary section (on a side note, we recently added a new term and we encourage you to check it out: black swan event).
So, since platinum was generally the underperformer and it just soared, it could be a bearish sign. Is it really the case? We marked similar (we used the Rate of Change indicator to detect moves that were similarly sharp) situations on the above chart with vertical, dashed lines. It turns out that declines indeed followed if not immediately, then shortly.
As we wrote above, this phenomenon can be seen also on an individual stock level. We just received the following question:
Do you know what do investors saw in Barrick gold today? 8% up in a single day! As far as I know they have 9 billion in debt!
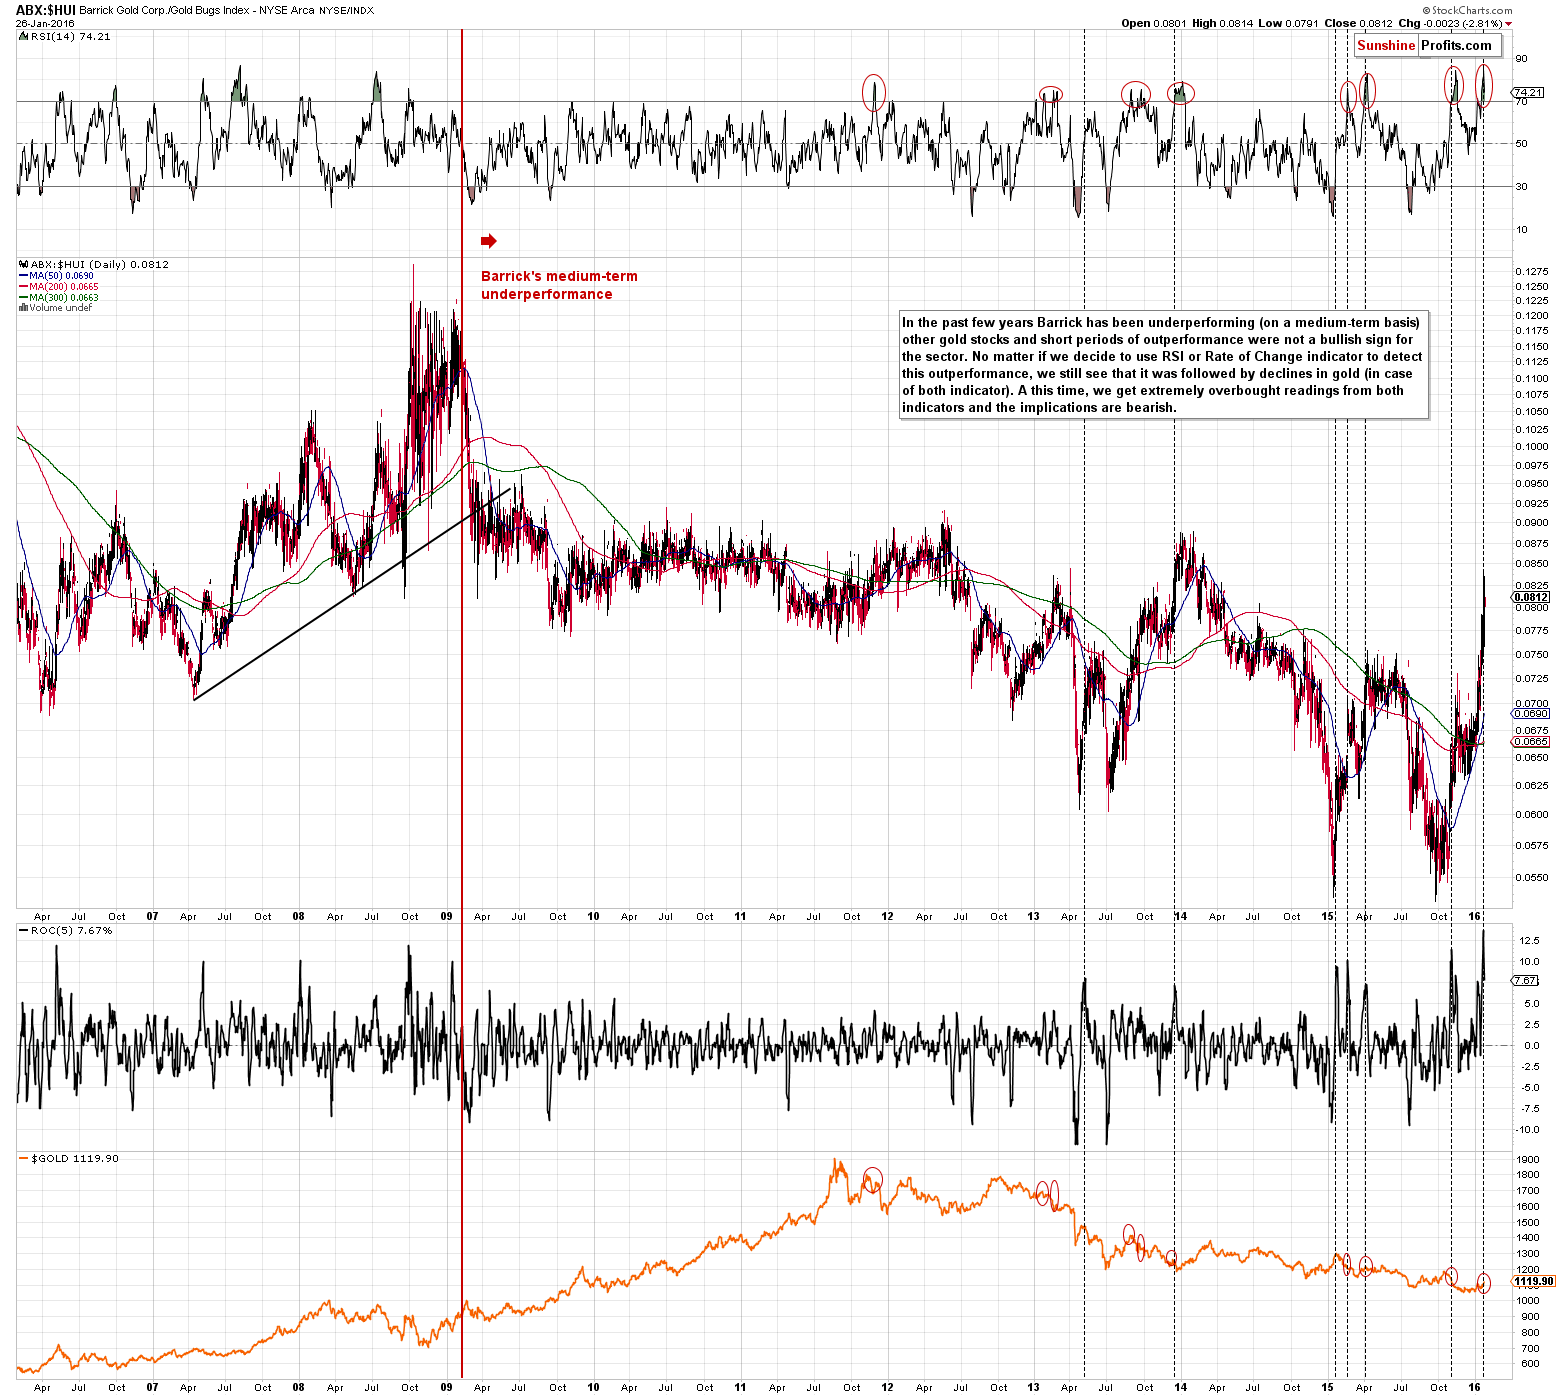
In general, taking the medium-term trend into account, Barrick has been underperforming the HUI Index for several years and we just saw a sharp short-term rally – similarly to what we saw in platinum. Were the previous short-term rallies in ABX just as bearish? Yes - we marked similar situations with vertical, dashed lines (based on the ROC indicator) and with red ellipses (based on the RSI indicator). In practically all cases in the past few years (when ABX was indeed underperforming on a medium-term basis) these situations were followed by declines in gold – if not immediately, then shortly.
What did investors see in Barrick yesterday? It’s impossible to know for certain, but our best guess is that they viewed it as relatively cheap compared to other stocks and thus bought it in hope of gaining more on the invested capital than in case of other stocks (just like was probably the case with platinum).
The mentioned bearish signals remain in place also today.
Summing up, it seems that the situation improved greatly based on yesterday’s rally in gold, silver and mining stocks, but when we consider the facts, it appears that the outlook did not really improve and entering short positions, not closing them should be considered. These facts are:
- Gold moved higher a bit above the 50% Fibonacci retracement, exactly like it was the case in May 2015, after a very similar decline and post-decline upswing. Back then a much bigger decline followed and it’s quite likely that the same is about to happen also this time. Gold also moved to the long-term declining resistance line based on the weekly closing prices. Moreover, there is a combination of resistance levels relatively close to the price, so even if gold moves higher from here, it’s not likely to move far before starting the next major decline.
- Silver moved higher right at the turning point, which is something that has always had bearish implications in the recent past. In fact, the declines that followed previous similar situations were bigger than silver’s recent rally.
- The rally in mining stocks took them a bit above the 50-day moving average on relatively strong volume, which is something that was followed by declines many times in the recent past. There was only one time that miners really managed to break.
- Investors are very bullish on gold and that’s something that we see before or at tops.
- We are right before comments from the Fed and several times in the recent past metals and miners rallied right before such announcements only to plunge shortly thereafter.
Overall, we believe short positions continue to be justified from the risk to reward point of view.
We realize it’s not easy or pleasant to hold on to a position that's moving against us temporarily, but that’s the price of making big profits over the long run - the necessity to hold through the unpleasant times. If it were easy, everybody would be extremely profitable. In fact, while some of our trades were immediately profitable, many of them were unprofitable for many days only to provide great profits in the end. As you read today, there are multiple reasons for which a decline is likely to be seen. As always, we will keep you – our subscribers – updated.
To summarize:
Trading capital (our opinion): Short positions (full) in gold, silver and mining stocks are justified from the risk/reward perspective with the following stop-loss orders and initial target price levels:
- Gold: initial target price: $973; stop-loss: $1,143, initial target price for the DGLD ETN: $117.70; stop-loss for the DGLD ETN $74.28
- Silver: initial target price: $12.13; stop-loss: $14.83, initial target price for the DSLV ETN: $101.84; stop-loss for DSLV ETN $57.49
- Mining stocks (price levels for the GDX ETF): initial target price: $10.23; stop-loss: $15.47, initial target price for the DUST ETF: $31.90; stop-loss for the DUST ETF $10.61
In case one wants to bet on junior mining stocks' prices (we do not suggest doing so – we think senior mining stocks are more predictable in the case of short-term trades – if one wants to do it anyway, we provide the details), here are the stop-loss details and initial target prices:
- GDXJ ETF: initial target price: $15.23; stop-loss: $21.13
- JDST ETF: initial target price: $52.99; stop-loss: $21.59
Long-term capital (our opinion): No positions
Insurance capital (our opinion): Full position
Plus, you might want to read why our stop-loss orders are usually relatively far from the current price.
Please note that a full position doesn’t mean using all of the capital for a given trade. You will find details on our thoughts on gold portfolio structuring in the Key Insights section on our website.
As a reminder – “initial target price” means exactly that – an “initial” one, it’s not a price level at which we suggest closing positions. If this becomes the case (like it did in the previous trade) we will refer to these levels as levels of exit orders (exactly as we’ve done previously). Stop-loss levels, however, are naturally not “initial”, but something that, in our opinion, might be entered as an order.
Since it is impossible to synchronize target prices and stop-loss levels for all the ETFs and ETNs with the main markets that we provide these levels for (gold, silver and mining stocks – the GDX ETF), the stop-loss levels and target prices for other ETNs and ETF (among other: UGLD, DGLD, USLV, DSLV, NUGT, DUST, JNUG, JDST) are provided as supplementary, and not as “final”. This means that if a stop-loss or a target level is reached for any of the “additional instruments” (DGLD for instance), but not for the “main instrument” (gold in this case), we will view positions in both gold and DGLD as still open and the stop-loss for DGLD would have to be moved lower. On the other hand, if gold moves to a stop-loss level but DGLD doesn’t, then we will view both positions (in gold and DGLD) as closed. In other words, since it’s not possible to be 100% certain that each related instrument moves to a given level when the underlying instrument does, we can’t provide levels that would be binding. The levels that we do provide are our best estimate of the levels that will correspond to the levels in the underlying assets, but it will be the underlying assets that one will need to focus on regarding the sings pointing to closing a given position or keeping it open. We might adjust the levels in the “additional instruments” without adjusting the levels in the “main instruments”, which will simply mean that we have improved our estimation of these levels, not that we changed our outlook on the markets. We are already working on a tool that would update these levels on a daily basis for the most popular ETFs, ETNs and individual mining stocks.
Our preferred ways to invest in and to trade gold along with the reasoning can be found in the how to buy gold section. Additionally, our preferred ETFs and ETNs can be found in our Gold & Silver ETF Ranking.
As always, we'll keep you - our subscribers - updated should our views on the market change. We will continue to send out Gold & Silver Trading Alerts on each trading day and we will send additional Alerts whenever appropriate.
The trading position presented above is the netted version of positions based on subjective signals (opinion) from your Editor, and the Tools and Indicators.
As a reminder, Gold & Silver Trading Alerts are posted before or on each trading day (we usually post them before the opening bell, but we don't promise doing that each day). If there's anything urgent, we will send you an additional small alert before posting the main one.
=====
Latest Free Trading Alerts:
Are we headed for rampant inflation or crippling deflation in 2016? What will both scenarios imply for the gold market?
=====
Hand-picked precious-metals-related links:
BREAKING NEWS: COMEX Registered Gold Inventories Plummet 73% In One Day
INFOGRAPHIC: Three major reasons for gold in 2016
Gold Tight at $1100 as Barclays Bank Weighs Next Exit from London Bullion Market
Besides financial survival Lonmin needs to address environmental questions
Gold’s rally just won’t last for this forecaster
The Best Performing 'Currency' Of The 21st Century Is...
=====
In other news:
Global stocks, dollar struggle ahead of Fed as oil falters
Fed seen keeping interest rates steady amid market volatility
The New Sick Man of Europe Has an AAA Credit Rating
RBS takes $5.1 billion hit in bid to break from past
=====
Thank you.
Sincerely,
Przemyslaw Radomski, CFA
Founder, Editor-in-chief
Gold & Silver Trading Alerts
Forex Trading Alerts
Oil Investment Updates
Oil Trading Alerts

