

Briefly: In our opinion, short (full) speculative positions in gold, silver and mining stocks are justified from the risk/reward point of view.
The major event in the precious metals world this week was the breakdown below the 2015 lows in the HUI Index, representing gold stocks. Yesterday, gold miners closed visibly above these lows once again. With the breakdown invalidated, will higher prices follow shortly?
In short, it’s too early to say so. In fact, there is a good reason to think that the situation didn’t really improve. The HUI Index is an important proxy for the mining stocks, but not the only one. The other important ones are the XAU Index and the GDX ETF. Both the XAU and GDX have not invalidated their own breakdowns below their respective 2015 lows. Plus, the HUI moved higher rather insignificantly above the previous lows. So, is the breakdown invalidated? Not really.
Let’s take a look at the charts (charts courtesy of http://stockcharts.com).
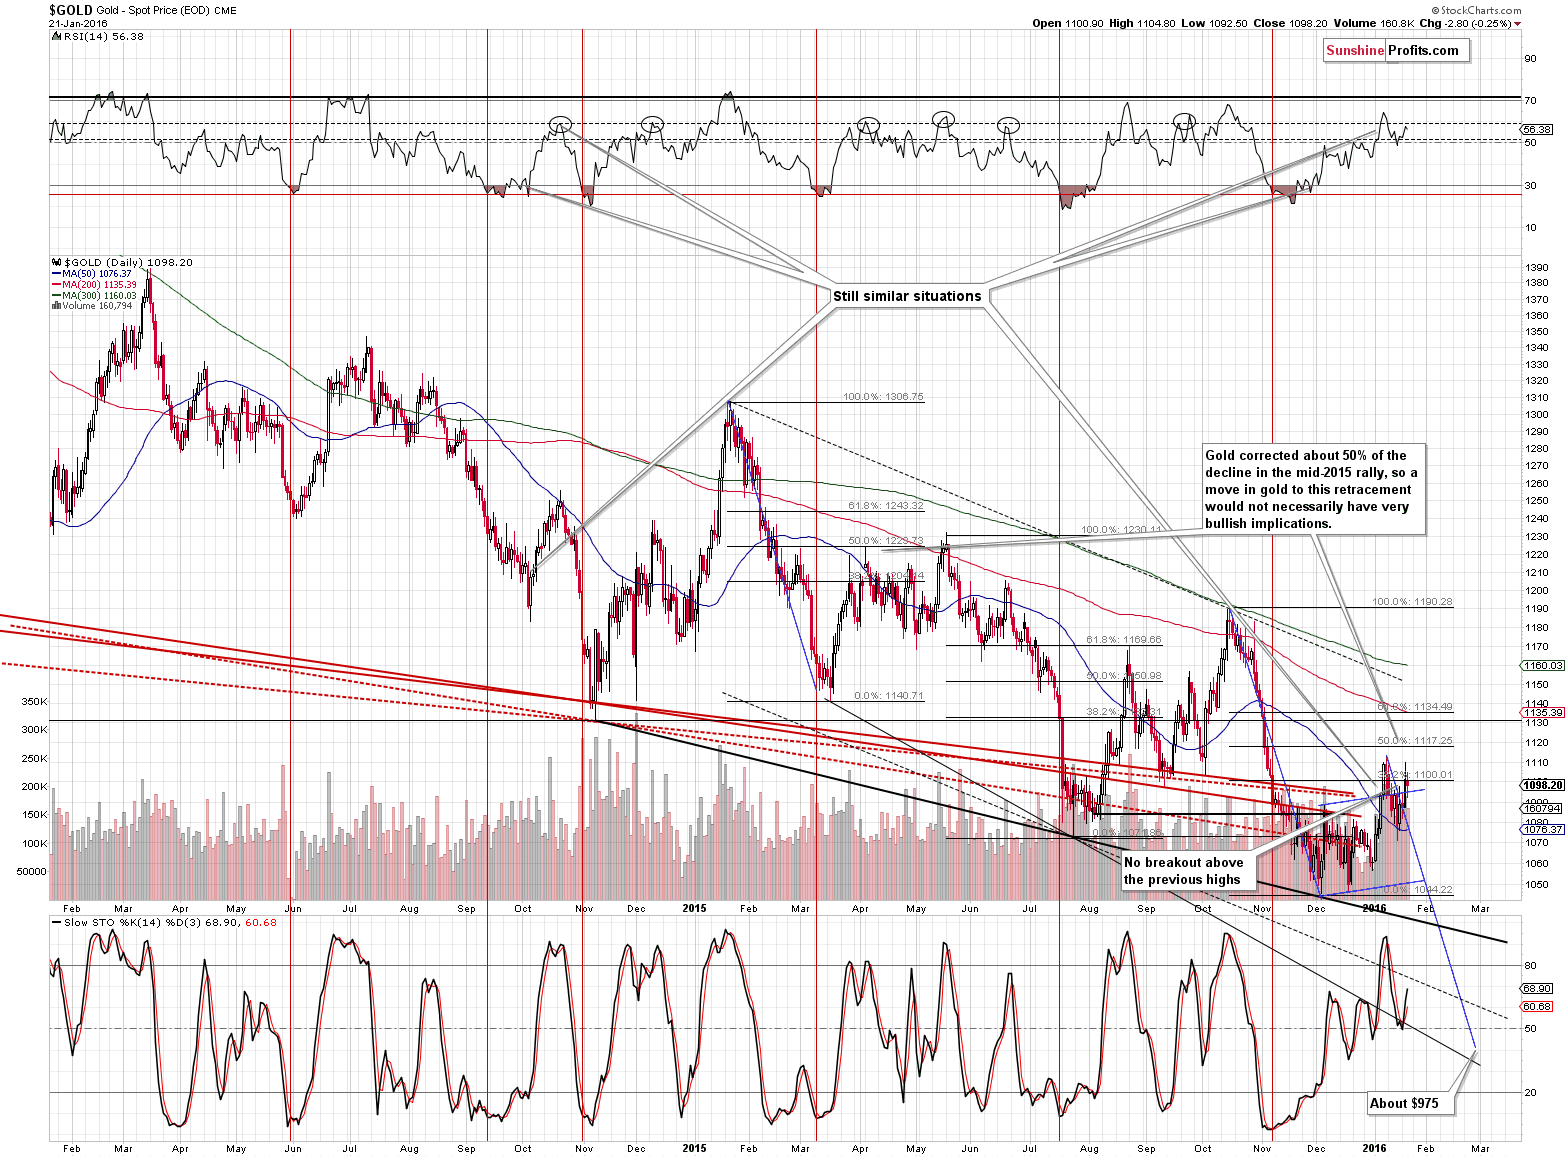
Gold moved a bit lower yesterday, moving back below the $1,100 level and the 38.2% Fibonacci retracement. Based on the above the situation in gold deteriorated a bit. Still, our previous comments on the above chart remain up-to-date:
Without a breakout above the 61.8% Fibonacci retracement, it will continue to be a correction and not a new rally. At this time gold is more than $30 away from the mentioned level, so it’s not even close. Is gold likely to move as high? Not really – just because gold moved higher during one session based on the metal’s safe-haven status doesn’t imply a continuation of the rally, especially given the situation in mining stocks. Did the situation in gold improve based on yesterday’s move higher? Not really.
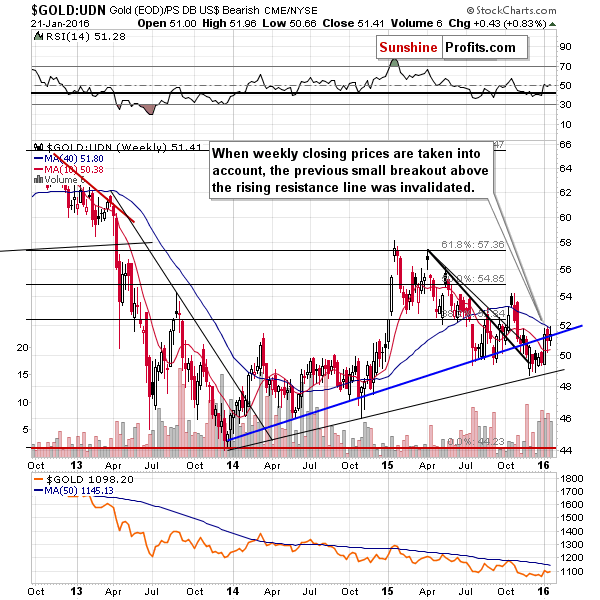
From the non-USD perspective, gold didn’t do much – it remains below the rising blue support / resistance line.
Please note that the 40-week moving average (thin blue line) provided resistance and support in the recent past, and it was reached once again. It seems that a turnaround and a move lower are just around the corner.
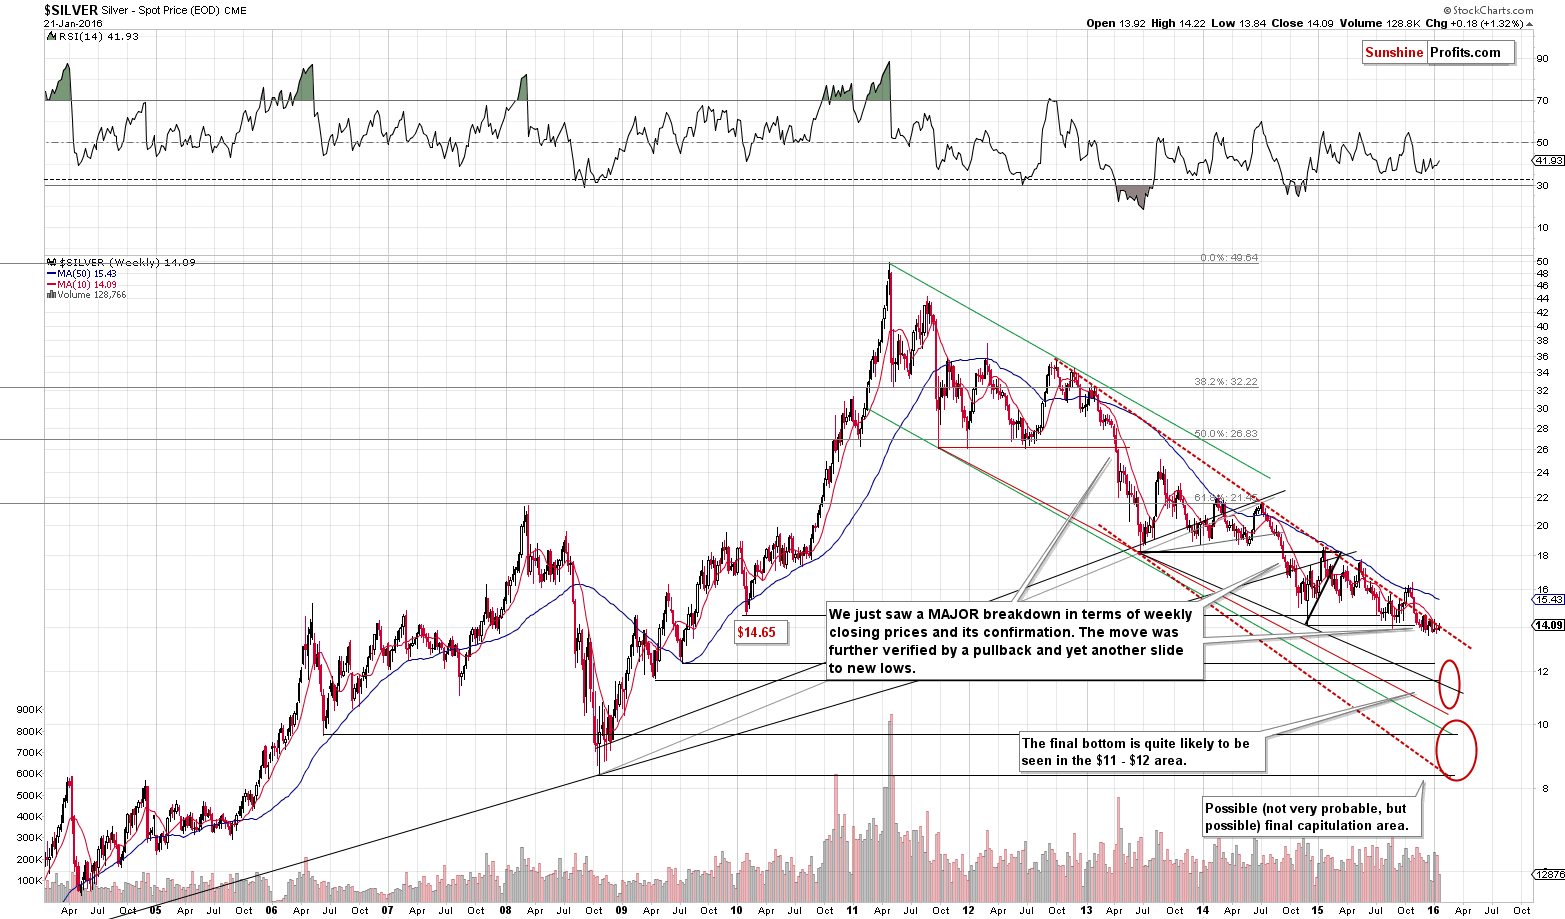
Moving to silver, we see that from the long-term perspective, nothing changed as silver remains below the declining red resistance line. In fact, silver is very close to it and thus the room for a potential rally is very limited.
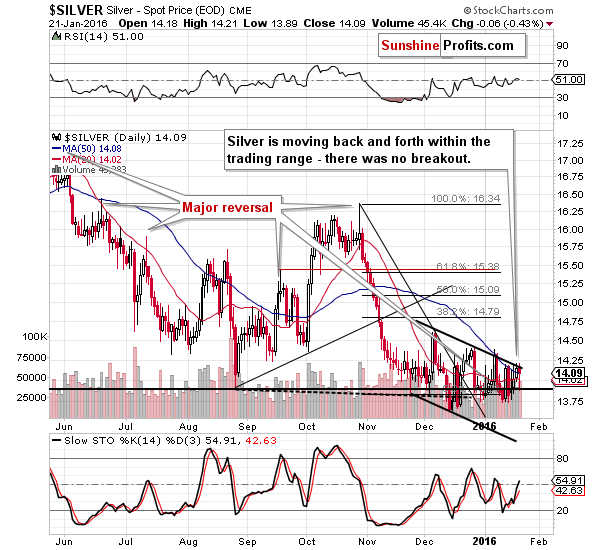
From the short-term point of view, nothing changed yesterday and our previous comments remain up-to-date:
What about silver? It moved 13 cents higher, which is very little and it didn’t change anything (the breakout above the 50-day moving average is too small to be viewed as a reliable signal).
The trend remains down. It seems that the recent upswing will be invalidated once again shortly.
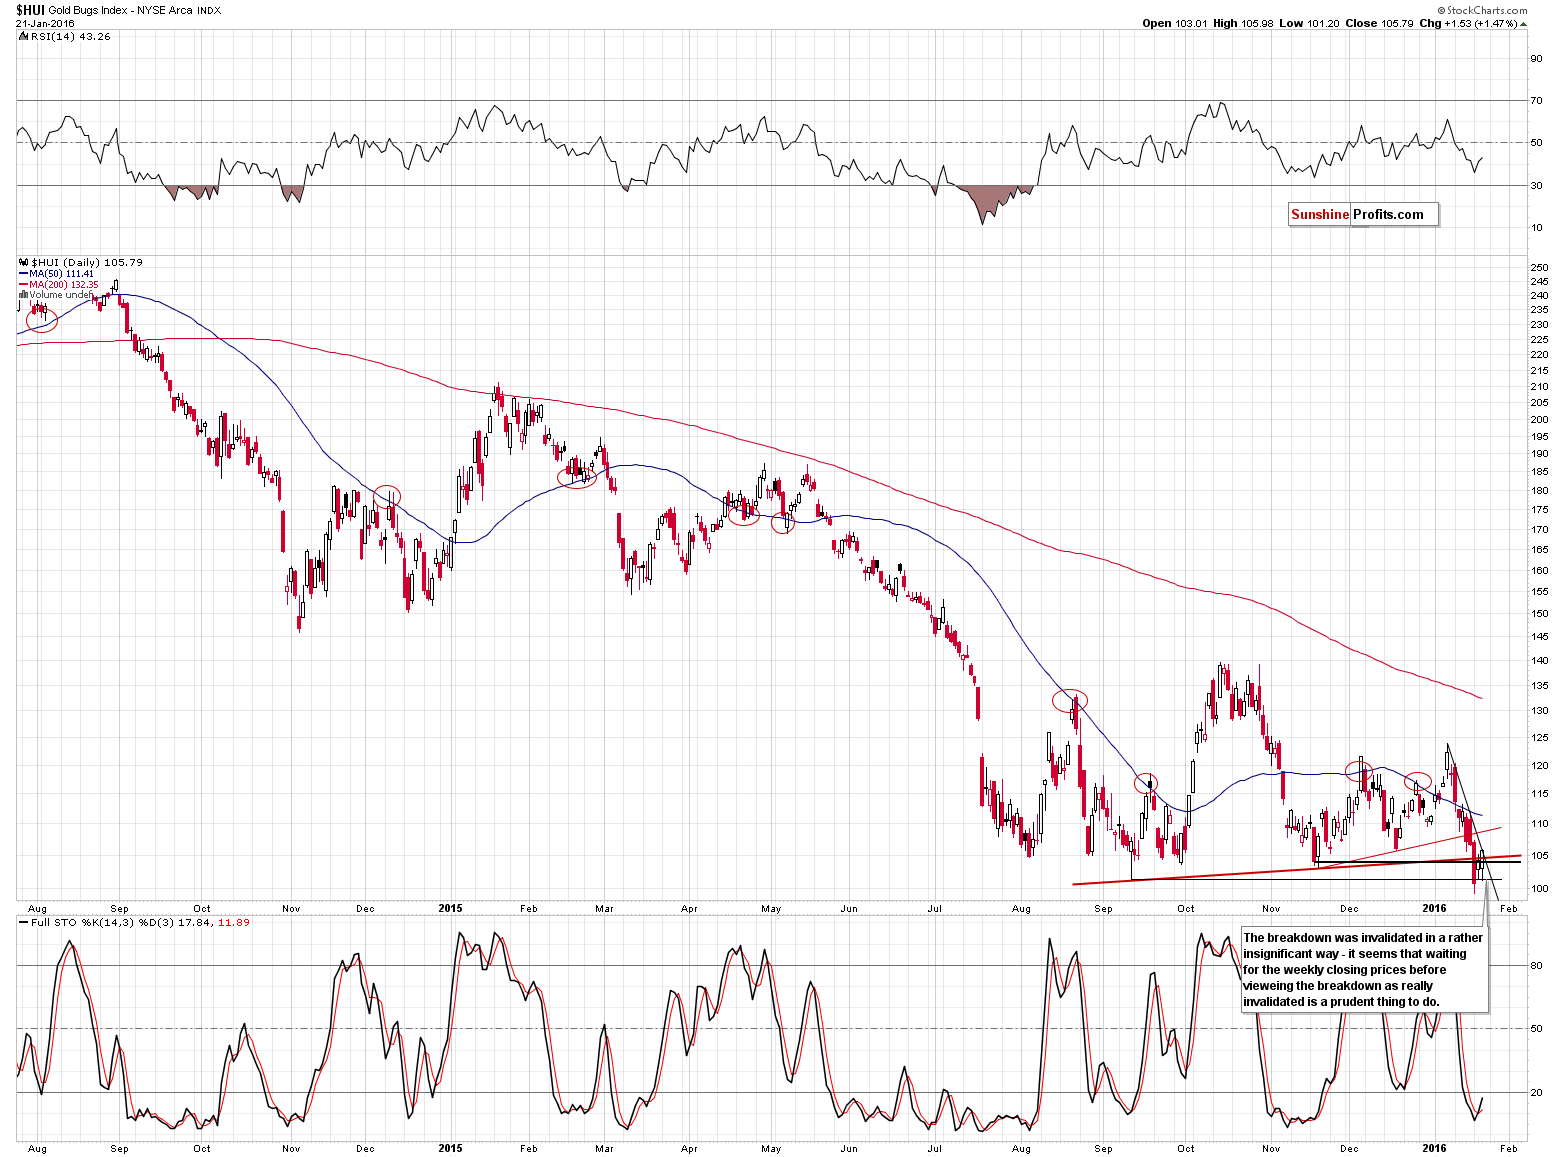
As mentioned earlier, gold stocks moved higher and closed below the previous lows. Not everything appears just as bullish – the very short-term, declining resistance line was not breached, but that’s just a minor factor.
The above chart has indeed flashed a buy signal, by invalidating the previous breakdown. Are we bullish based on that? No, because we haven’t seen the same in the XAU Index and the GDX ETF. The above chart doesn’t say anything about volume and that’s always something to consider. Speaking of which…
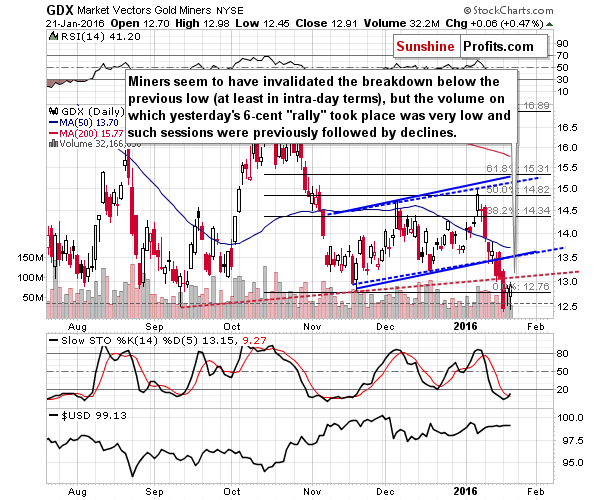
The volume was very low and this is an important bearish factor. The GDX ETF paints an entirely different picture than the HUI Index. The HUI Index is more important per se, but since it moved only a little above the 2015 lows and there was no volume data – and there is volume data for GDX, we think that what GDX is telling us is more important.
The GDX ETF didn’t move back above its previous low – in the case of daily closing prices. The volume on which it moved higher yesterday was very low. Consequently, in the GDX ETF, we are simply seeing a classic post-breakdown corrective upswing, which doesn’t change anything. In fact, in the case of the GDX ETF, we have just seen the third close below the previous lows and thus can view the breakdown as confirmed.
Some may say that the position of the Stochastic indicator is bullish, but we disagree. Please note what happened in early November 2015, when we saw a similar situation in the Stochastic indicator. Miners paused for a few days only to plunge in the following days.
Summing up, the outlook for the precious metals sector remains bearish and yesterday’s move higher in the HUI Index doesn’t change it as its bullish signal was not confirmed by an analogous signal in the XAU Index or the GDX ETF. In fact, the breakdown in the GDX ETF below the previous lows was just confirmed as the ETF closed below the previous lows for the third consecutive day.
The gains in the full short positions in mining stocks are already significant, but we think they will become much bigger before the trade is over and the same goes for profits on gold and silver short positions.
As always, we will keep you – our subscribers – updated.
To summarize:
Trading capital (our opinion): Short positions (full) in gold, silver and mining stocks are justified from the risk/reward perspective with the following stop-loss orders and initial target price levels:
- Gold: initial target price: $973; stop-loss: $1,143, initial target price for the DGLD ETN: $117.70; stop-loss for the DGLD ETN $74.28
- Silver: initial target price: $12.13; stop-loss: $14.83, initial target price for the DSLV ETN: $101.84; stop-loss for DSLV ETN $57.49
- Mining stocks (price levels for the GDX ETF): initial target price: $10.23; stop-loss: $15.47, initial target price for the DUST ETF: $31.90; stop-loss for the DUST ETF $10.61
In case one wants to bet on junior mining stocks' prices (we do not suggest doing so – we think senior mining stocks are more predictable in the case of short-term trades – if one wants to do it anyway, we provide the details), here are the stop-loss details and initial target prices:
- GDXJ ETF: initial target price: $15.23; stop-loss: $21.13
- GDXJ ETF: initial target price: $15.23; stop-loss: $21.13
Long-term capital (our opinion): No positions
Insurance capital (our opinion): Full position
Plus, you might want to read why our stop-loss orders are usually relatively far from the current price.
Please note that a full position doesn’t mean using all of the capital for a given trade. You will find details on our thoughts on gold portfolio structuring in the Key Insights section on our website.
As a reminder – “initial target price” means exactly that – an “initial” one, it’s not a price level at which we suggest closing positions. If this becomes the case (like it did in the previous trade) we will refer to these levels as levels of exit orders (exactly as we’ve done previously). Stop-loss levels, however, are naturally not “initial”, but something that, in our opinion, might be entered as an order.
Since it is impossible to synchronize target prices and stop-loss levels for all the ETFs and ETNs with the main markets that we provide these levels for (gold, silver and mining stocks – the GDX ETF), the stop-loss levels and target prices for other ETNs and ETF (among other: UGLD, DGLD, USLV, DSLV, NUGT, DUST, JNUG, JDST) are provided as supplementary, and not as “final”. This means that if a stop-loss or a target level is reached for any of the “additional instruments” (DGLD for instance), but not for the “main instrument” (gold in this case), we will view positions in both gold and DGLD as still open and the stop-loss for DGLD would have to be moved lower. On the other hand, if gold moves to a stop-loss level but DGLD doesn’t, then we will view both positions (in gold and DGLD) as closed. In other words, since it’s not possible to be 100% certain that each related instrument moves to a given level when the underlying instrument does, we can’t provide levels that would be binding. The levels that we do provide are our best estimate of the levels that will correspond to the levels in the underlying assets, but it will be the underlying assets that one will need to focus on regarding the sings pointing to closing a given position or keeping it open. We might adjust the levels in the “additional instruments” without adjusting the levels in the “main instruments”, which will simply mean that we have improved our estimation of these levels, not that we changed our outlook on the markets. We are already working on a tool that would update these levels on a daily basis for the most popular ETFs, ETNs and individual mining stocks.
Our preferred ways to invest in and to trade gold along with the reasoning can be found in the how to buy gold section. Additionally, our preferred ETFs and ETNs can be found in our Gold & Silver ETF Ranking.
As always, we'll keep you - our subscribers - updated should our views on the market change. We will continue to send out Gold & Silver Trading Alerts on each trading day and we will send additional Alerts whenever appropriate.
The trading position presented above is the netted version of positions based on subjective signals (opinion) from your Editor, and the Tools and Indicators.
As a reminder, Gold & Silver Trading Alerts are posted before or on each trading day (we usually post them before the opening bell, but we don't promise doing that each day). If there's anything urgent, we will send you an additional small alert before posting the main one.
=====
Latest Free Trading Alerts:
Yesterday, there was a meeting of the European Central Bank. Will it affect the gold market?
ECB Does Not Give Up. Neither Does Gold
The Fed finally hiked its interest rates. How will the end of the zero interest rate policy affect the gold market? We invite you to read our today’s article on the macroeconomic consequences of Fed’s action and learn about the implications for the price of gold.
Gold in a Non-Zero Interest Rate World
=====
Hand-picked precious-metals-related links:
Barrick Gold Plans Up to $3 Billion in Writedowns
INFOGRAPHIC: The periodic table of commodity returns
Rand plunge is pushing platinum lower, Sibanye’s Froneman says
=====
In other news:
U.S. Is Hiding Treasury Bond Data That's Suddenly Become Crucial
Leaky lifeboat: Weak U.S. corporate profits offer no rescue to sinking stocks
Oil rises 6 percent but set for biggest January fall in 25 years
China shares end higher on global stimulus hopes
Euro zone business activity growth weakest since Feb
=====
Thank you.
Sincerely,
Przemyslaw Radomski, CFA
Founder, Editor-in-chief
Gold & Silver Trading Alerts
Forex Trading Alerts
Oil Investment Updates
Oil Trading Alerts

