

Briefly: In our opinion, short (full) speculative positions in gold, silver and mining stocks are justified from the risk/reward point of view.
Gold rallied back above $1,100 yesterday, which could mean that much higher prices are on the horizon. However, mining stocks are not showing similar strength. Which part of the precious metals sector is showing the real direction?
In our opinion, it is the action in mining stocks that we should be focusing on, not the daily upswing in gold. As we have explained in the previous alerts, gold is viewed as a hedge against turmoil and this covers many aspects – war, financial crises etc. It might have been the case that gold investors simply overreacted based on the decline in the stock market. If it had been true strength, the rest of the precious metals sector would likely have confirmed it – and it didn’t.
The CNN Money website features a Fear and Greed index and it currently shows an extreme fear reading:
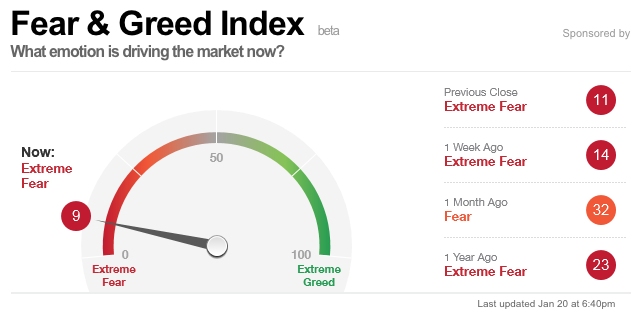
If gold’s rally was driven by the fear corresponding to the stock prices’ plunge, then it seems that this very short-term trend may soon reverse – extreme fear is seen at the bottoms (in the main stock indices that is), not tops.
Let’s stay with the above picture for an additional minute. Fear is now extreme among stock investors and gold is at a mere $1,100 while gold stocks are breaking below the 2015 low. If the outlook for gold was indeed bullish, gold should already be much higher and miners should be soaring. It’s not – it’s close to its previous lows. If fear is already extreme then what else should happen for gold to truly soar? There’s not much on the short- and medium-term horizon that can happen since the sentiment is already so bad. It can worsen just a little and thus gold can rally a bit more, but not much – after that the trend is likely to resume and the medium-term trend in the precious metals sector is down.
Let’s take a look at the charts (charts courtesy of http://stockcharts.com).
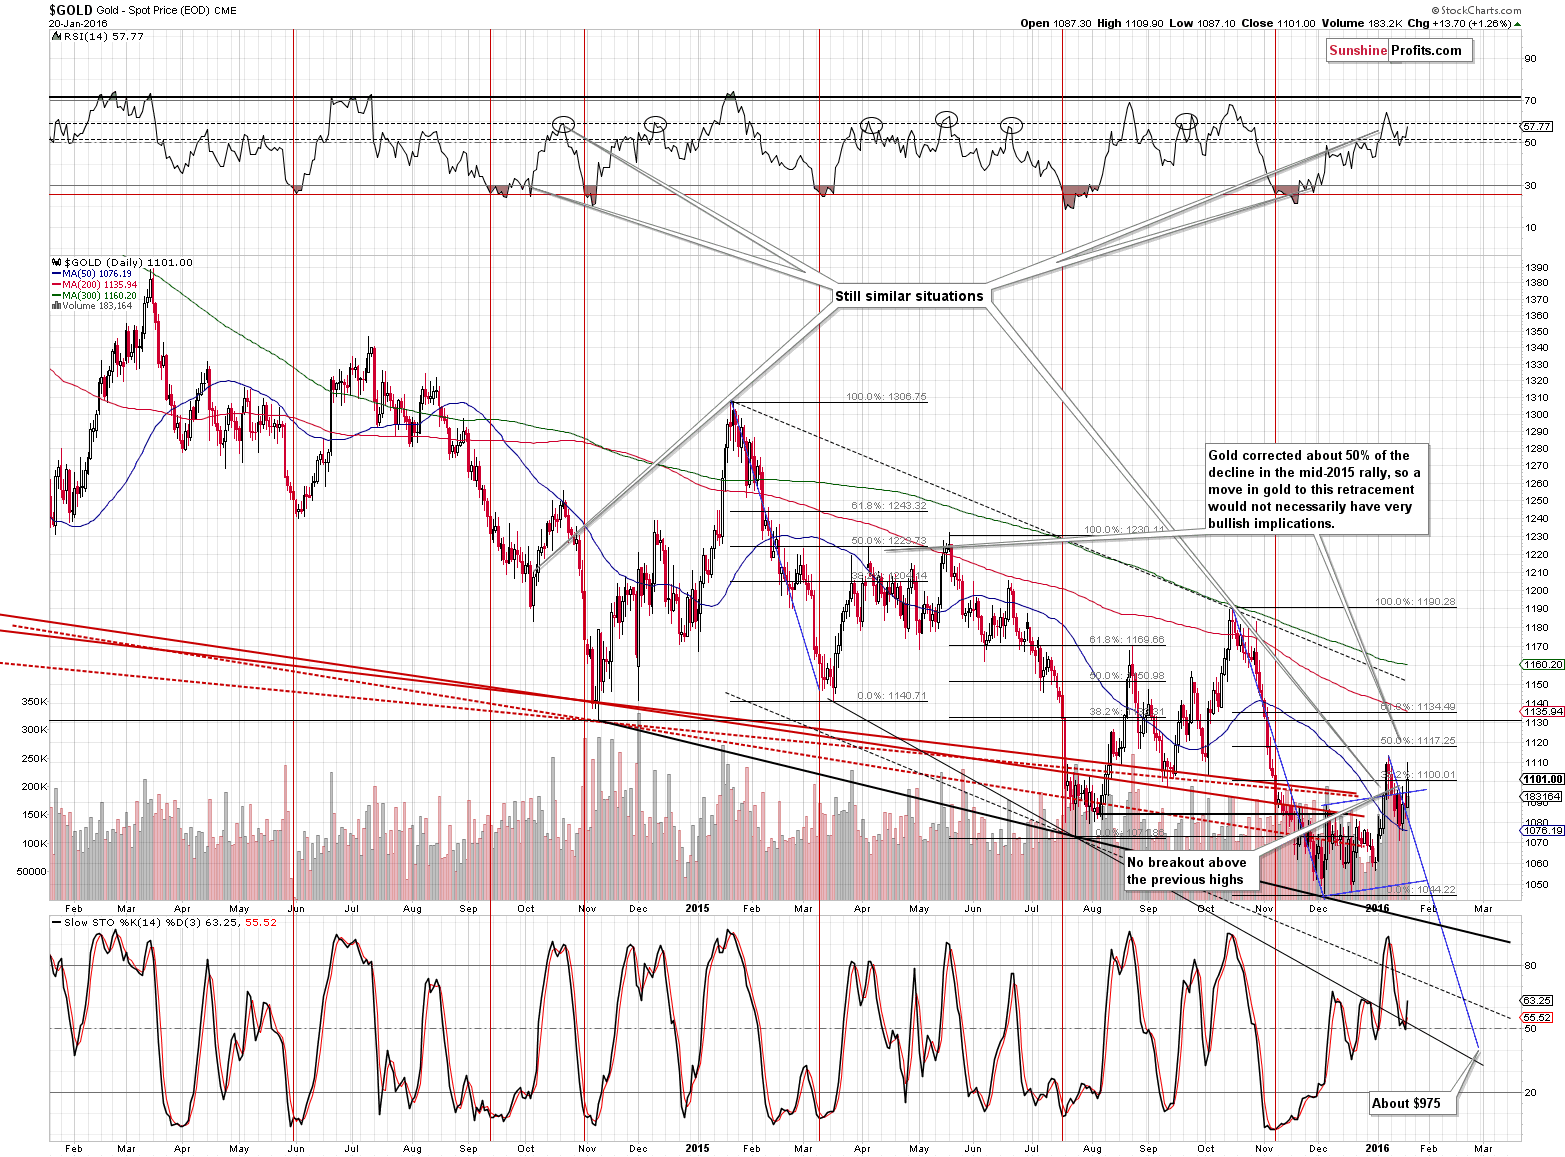
Gold indeed moved higher, but please note that it closed pretty much right at the 38.2% Fibonacci retracement level based on the previous decline. Without a breakout above the 61.8% Fibonacci retracement, it will continue to be a correction and not a new rally. At this time gold is more than $30 away from the mentioned level, so it’s not even close. Is gold likely to move as high? Not really – just because gold moved higher during one session based on the metal’s safe-haven status doesn’t imply a continuation of the rally, especially given the situation in mining stocks. Did the situation in gold improve based on yesterday’s move higher? Not really.
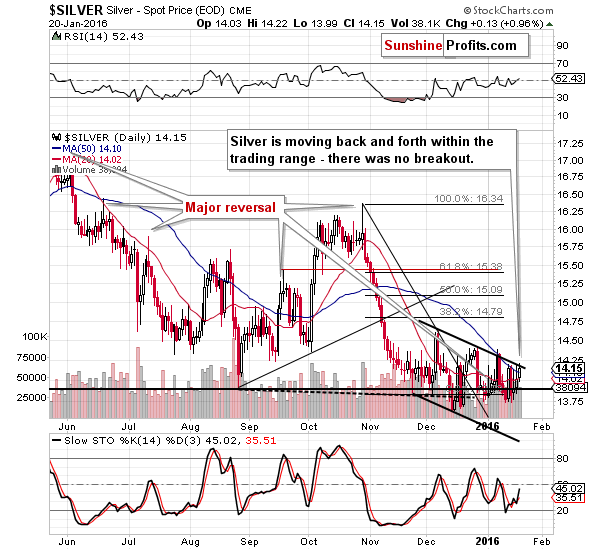
What about silver? It moved 13 cents higher, which is very little and it didn’t change anything (the breakout above the 50-day moving average is too small to be viewed as a reliable signal). Consequently, our previous comments on the above chart remain up-to-date:
During Friday’s session was saw a repeat of what we had seen previously – a sharp move higher (to the 50-day moving average) that was immediately canceled. We’ve previously written the following about the mentioned phenomenon (and it remains up-to-date also today):
(…) that was something we had seen quite often right before big declines, for instance in late October 2015 or mid-August 2015. Silver is known (at least by those who have been following it for a longer time) for its fake moves, so it’s important to consider confirmations and other signals before making an investment or trading decision based on what happens in silver.
We summarized that silver’s recent performance may have seemed positive, but based on the way similar situations had developed previously, we actually viewed the white metal’s unconfirmed rally as something bearish – especially given the very weak performance of mining stocks.
We didn’t have to wait long for a confirmation of the above – silver canceled the previous day’s upswing and the rest of the precious metals sector followed on the very next day. The trend remains down.
The trend remains down. It seems that the upswing will be invalidated once again shortly.
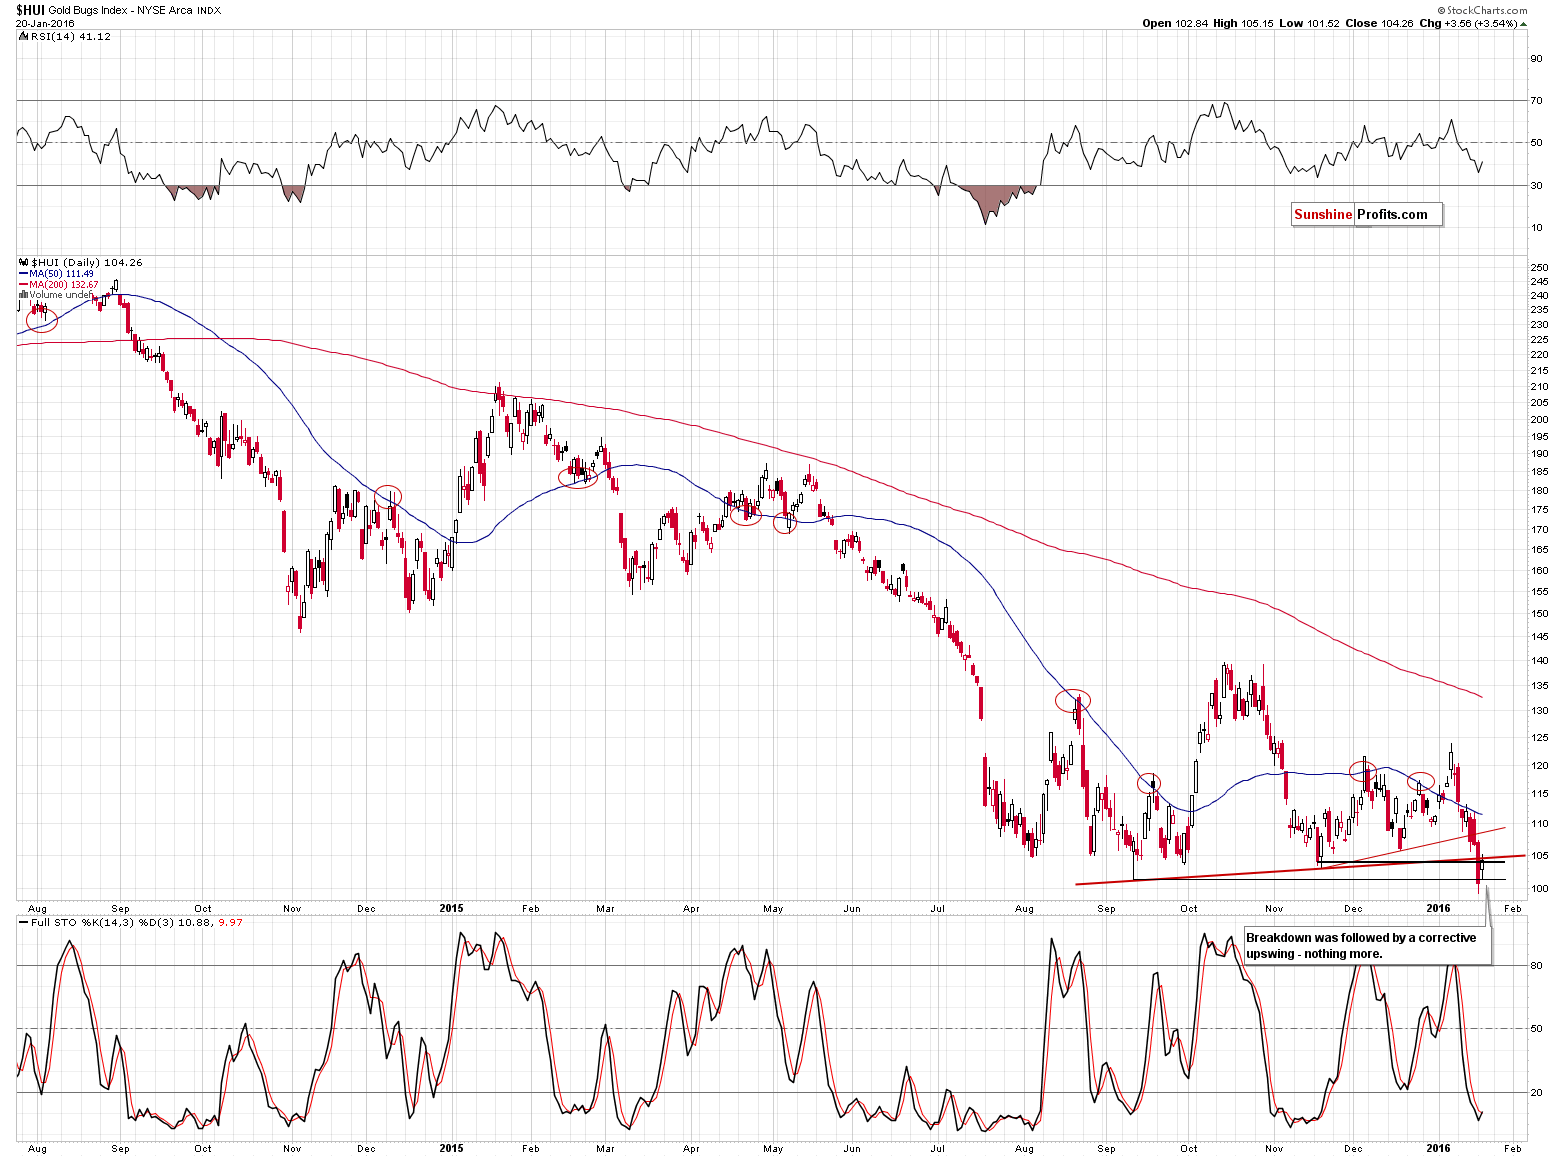
Gold stocks truly plunged on Tuesday and yesterday’s action seems to simply be a correction before the decline continues. The HUI Index moved back to its 2015 low, but didn’t move much above it and closed more or less at it. Given a visible rally in gold and the fact that the general stock market reversed and canceled most of yesterday’s declines before the end of the session, one might have expected a much bigger rally in gold stocks and a visible invalidation of this all-important breakdown. We didn’t see such strength and the implications are bearish.
Summing up, the outlook for the precious metals sector remains bearish and the mining stocks’ underperformance and their major breakdown continue to serve as a confirmation despite gold’s daily upswing that we saw yesterday - full short positions appear to be justified from the risk / reward point of view. It seems that gold’s yesterday action was just a temporary event, though the next few days still seem a bit unclear.
The gains in the full short positions in mining stocks are already significant, but we think they will become much bigger before the trade is over and the same goes for profits on gold and silver short positions.
As always, we will keep you – our subscribers – updated.
To summarize:
Trading capital (our opinion): Short positions (full) in gold, silver and mining stocks are justified from the risk/reward perspective with the following stop-loss orders and initial target price levels:
- Gold: initial target price: $973; stop-loss: $1,143, initial target price for the DGLD ETN: $117.70; stop-loss for the DGLD ETN $74.28
- Silver: initial target price: $12.13; stop-loss: $14.83, initial target price for the DSLV ETN: $101.84; stop-loss for DSLV ETN $57.49
- Mining stocks (price levels for the GDX ETF): initial target price: $10.23; stop-loss: $15.47, initial target price for the DUST ETF: $31.90; stop-loss for the DUST ETF $10.61
In case one wants to bet on junior mining stocks' prices (we do not suggest doing so – we think senior mining stocks are more predictable in the case of short-term trades – if one wants to do it anyway, we provide the details), here are the stop-loss details and initial target prices:
- GDXJ ETF: initial target price: $15.23; stop-loss: $21.13
- JDST ETF: initial target price: $52.99; stop-loss: $21.59
Long-term capital (our opinion): No positions
Insurance capital (our opinion): Full position
Plus, you might want to read why our stop-loss orders are usually relatively far from the current price.
Please note that a full position doesn’t mean using all of the capital for a given trade. You will find details on our thoughts on gold portfolio structuring in the Key Insights section on our website.
As a reminder – “initial target price” means exactly that – an “initial” one, it’s not a price level at which we suggest closing positions. If this becomes the case (like it did in the previous trade) we will refer to these levels as levels of exit orders (exactly as we’ve done previously). Stop-loss levels, however, are naturally not “initial”, but something that, in our opinion, might be entered as an order.
Since it is impossible to synchronize target prices and stop-loss levels for all the ETFs and ETNs with the main markets that we provide these levels for (gold, silver and mining stocks – the GDX ETF), the stop-loss levels and target prices for other ETNs and ETF (among other: UGLD, DGLD, USLV, DSLV, NUGT, DUST, JNUG, JDST) are provided as supplementary, and not as “final”. This means that if a stop-loss or a target level is reached for any of the “additional instruments” (DGLD for instance), but not for the “main instrument” (gold in this case), we will view positions in both gold and DGLD as still open and the stop-loss for DGLD would have to be moved lower. On the other hand, if gold moves to a stop-loss level but DGLD doesn’t, then we will view both positions (in gold and DGLD) as closed. In other words, since it’s not possible to be 100% certain that each related instrument moves to a given level when the underlying instrument does, we can’t provide levels that would be binding. The levels that we do provide are our best estimate of the levels that will correspond to the levels in the underlying assets, but it will be the underlying assets that one will need to focus on regarding the sings pointing to closing a given position or keeping it open. We might adjust the levels in the “additional instruments” without adjusting the levels in the “main instruments”, which will simply mean that we have improved our estimation of these levels, not that we changed our outlook on the markets. We are already working on a tool that would update these levels on a daily basis for the most popular ETFs, ETNs and individual mining stocks.
Our preferred ways to invest in and to trade gold along with the reasoning can be found in the how to buy gold section. Additionally, our preferred ETFs and ETNs can be found in our Gold & Silver ETF Ranking.
As always, we'll keep you - our subscribers - updated should our views on the market change. We will continue to send out Gold & Silver Trading Alerts on each trading day and we will send additional Alerts whenever appropriate.
The trading position presented above is the netted version of positions based on subjective signals (opinion) from your Editor, and the Tools and Indicators.
As a reminder, Gold & Silver Trading Alerts are posted before or on each trading day (we usually post them before the opening bell, but we don't promise doing that each day). If there's anything urgent, we will send you an additional small alert before posting the main one.
=====
Latest Free Trading Alerts:
The price of gold jumped back above $1,100. What caused this rise and what does it mean for the future of the precious metal market?
=====
Hand-picked precious-metals-related links:
Citi Research Revises Upward 2016 Gold Forecast To $1,070/Oz
Gold to average $1,075 an ounce in the first quarter of 2016: Barclays
=====
In other news:
U.S. stocks set for a comeback, or another blow?
Weak U.S. inflation, housing data lower March rate hike chances
Gross Says Global Selloff Shows Failure of Central Bank Efforts
PBOC Injects Most Cash in Three Years in Open-Market Operations
Even the ECB's Cash Can't Stop Investors Worrying About Portugal
Italy PM says govt following with concern bank share drops-paper
When Russia's money runs out, the 'real trouble starts'
IMF opens search for top job; Lagarde has offered to serve again
=====
Thank you.
Sincerely,
Przemyslaw Radomski, CFA
Founder, Editor-in-chief
Gold & Silver Trading Alerts
Forex Trading Alerts
Oil Investment Updates
Oil Trading Alerts

