

Briefly: In our opinion, short (full) speculative positions in gold, silver and mining stocks are justified from the risk/reward point of view.
Gold and silver moved temporarily higher last week, but ultimately closed the week without invalidating their previous major breakdowns. Consequently, the implications of the latter are even more important. What are these implications specifically?
Let’s take a look at the charts (charts courtesy of http://stockcharts.com).
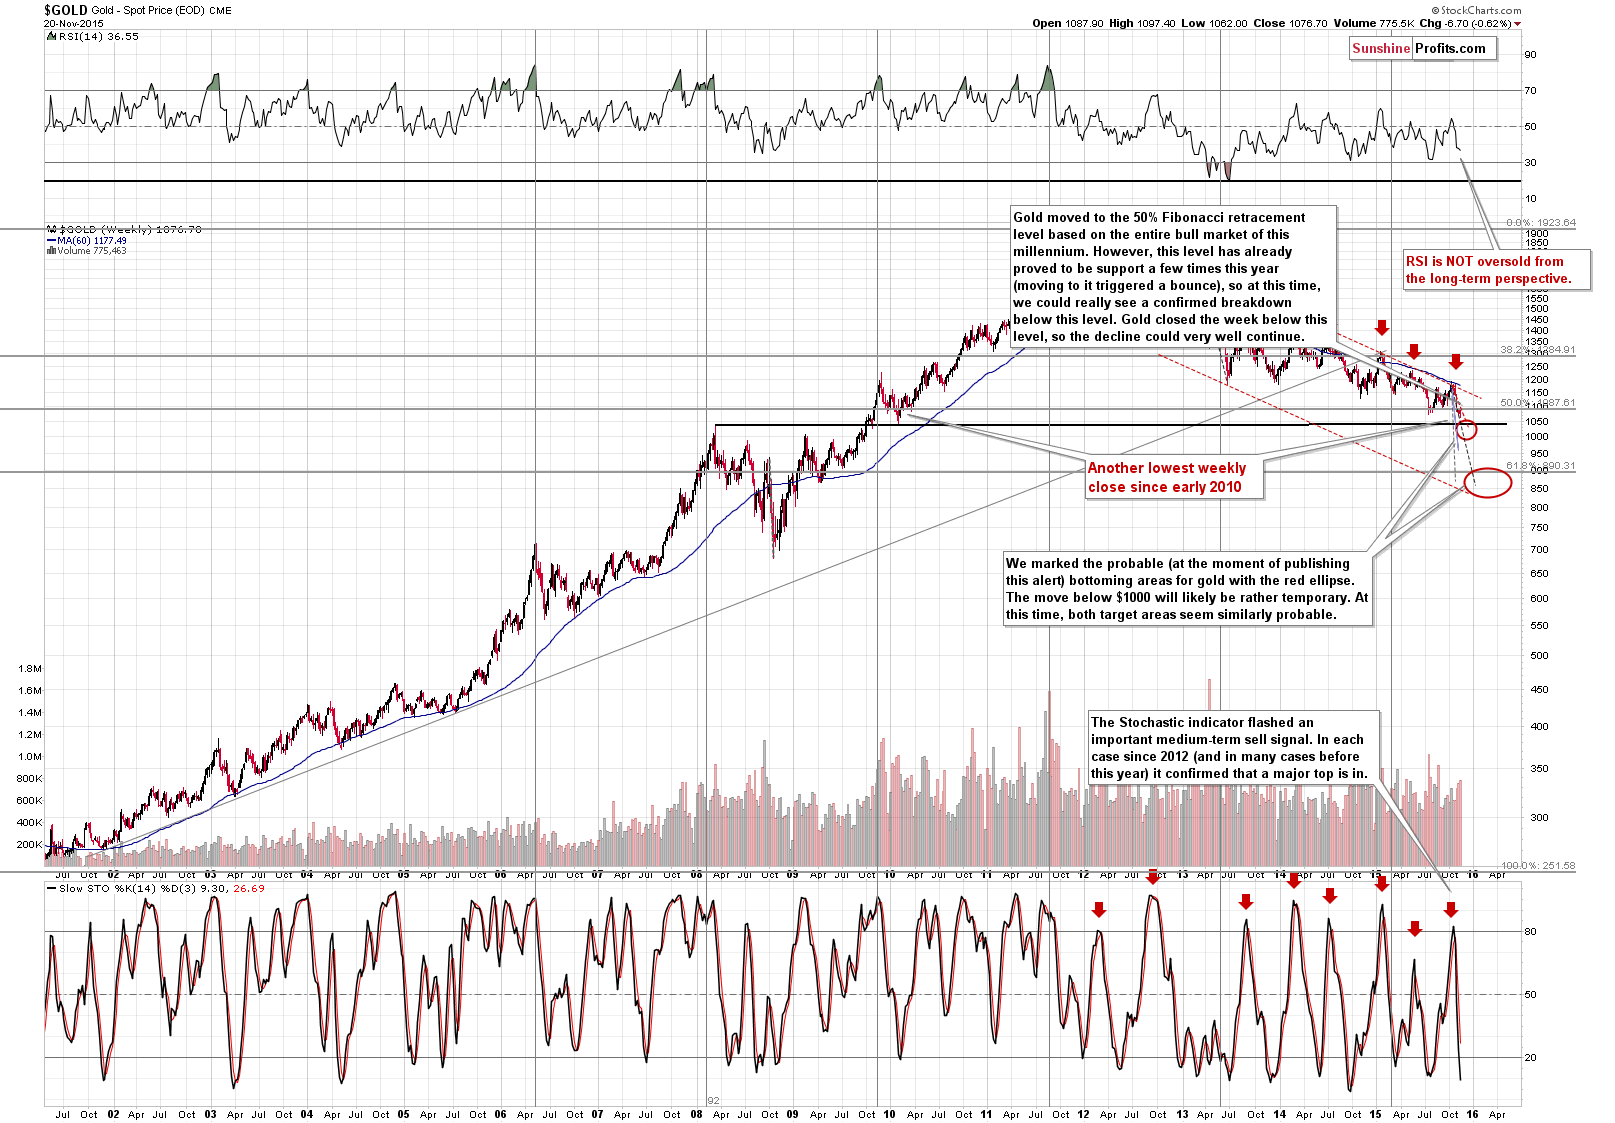
From the long-term perspective, there were no changes – gold moved lower once again and once again closed the week below the previous lowest weekly close of 2015. The weekly volume on which last week’s decline took place was relatively high, and the implications are bearish.
The sell signal from the Stochastic indicator remains in place and, at the same time, the RSI indicator does not indicate an oversold situation.
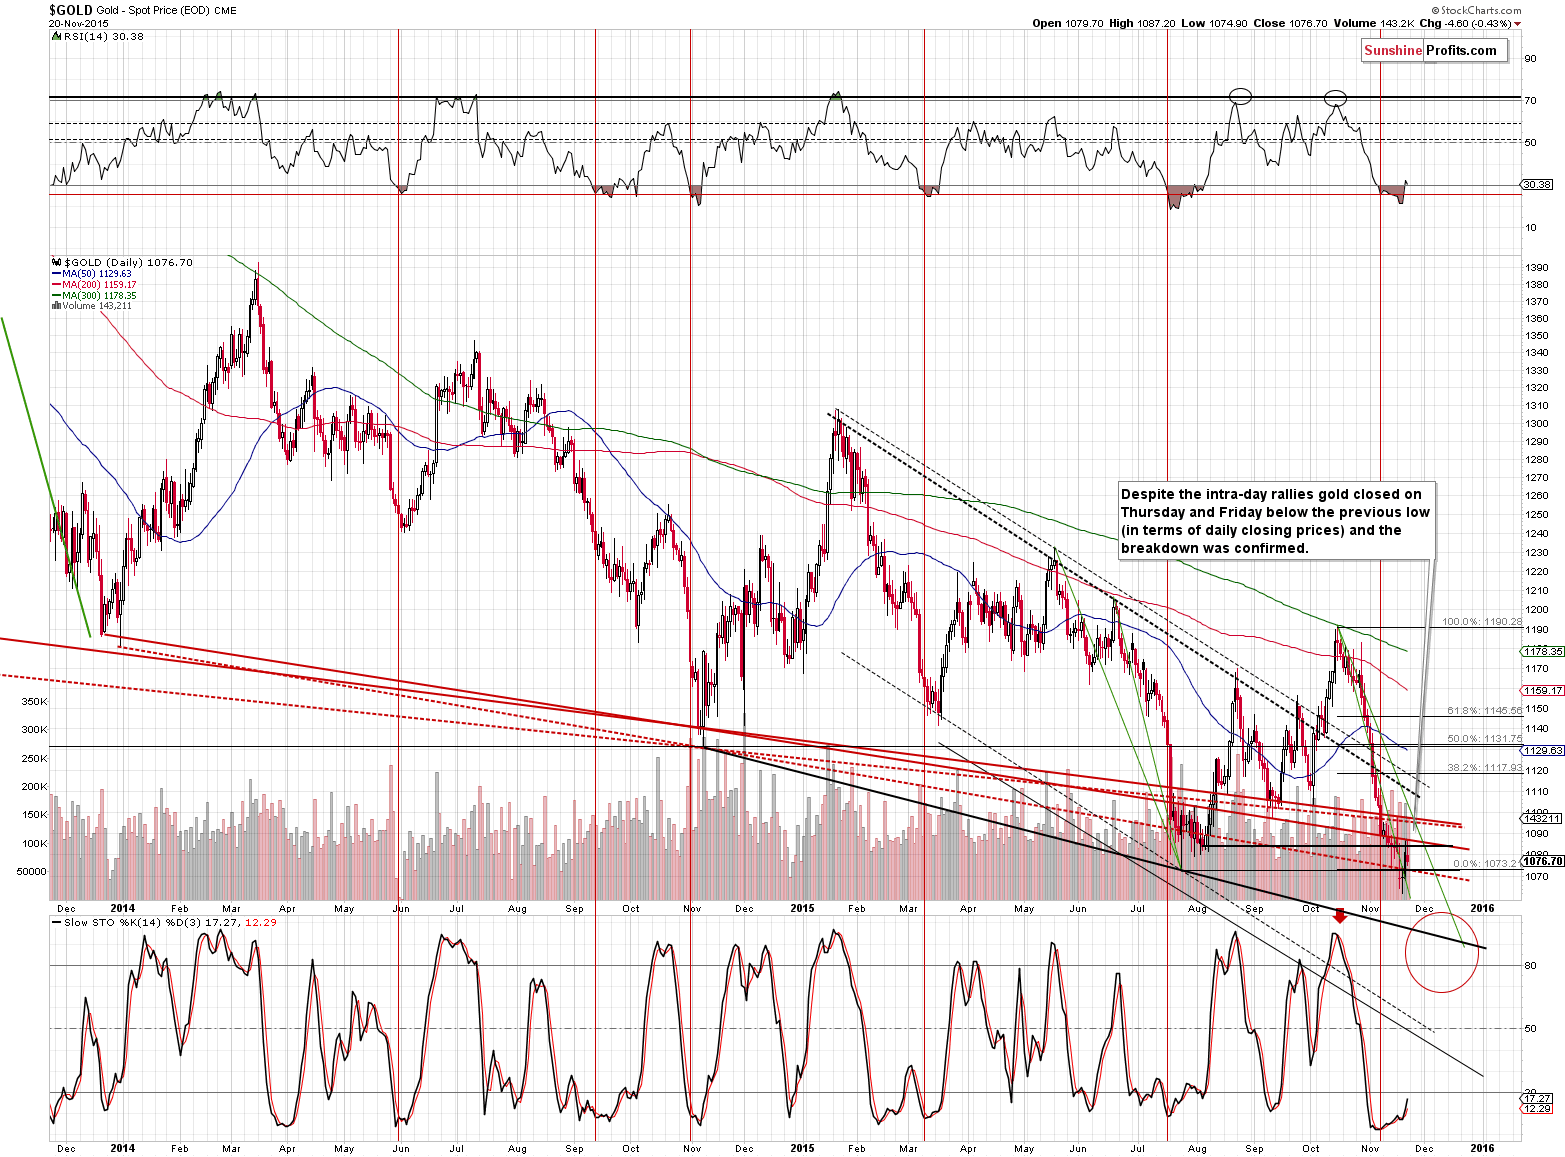
On a short-term basis, we see more or less a confirmation of our previous comments. Gold has not only broken below previous lows in weekly terms, but also in daily terms. Again, the implications are bearish.
The RSI indicator may seem to suggest higher prices as it moved back above the 30 level, but we don’t think that this is the case as confirmed breakdowns are much more important and we saw a similar situation in late September 2014. The only thing that followed was an intra-day rally followed by further declines. We already saw something like that, so perhaps there will be no additional bullish reaction.
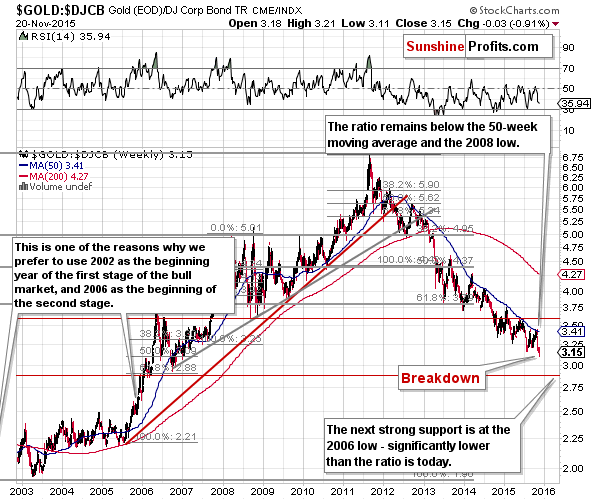
The gold to bonds ratio has also broken below the previous lows – we have a bearish confirmation.
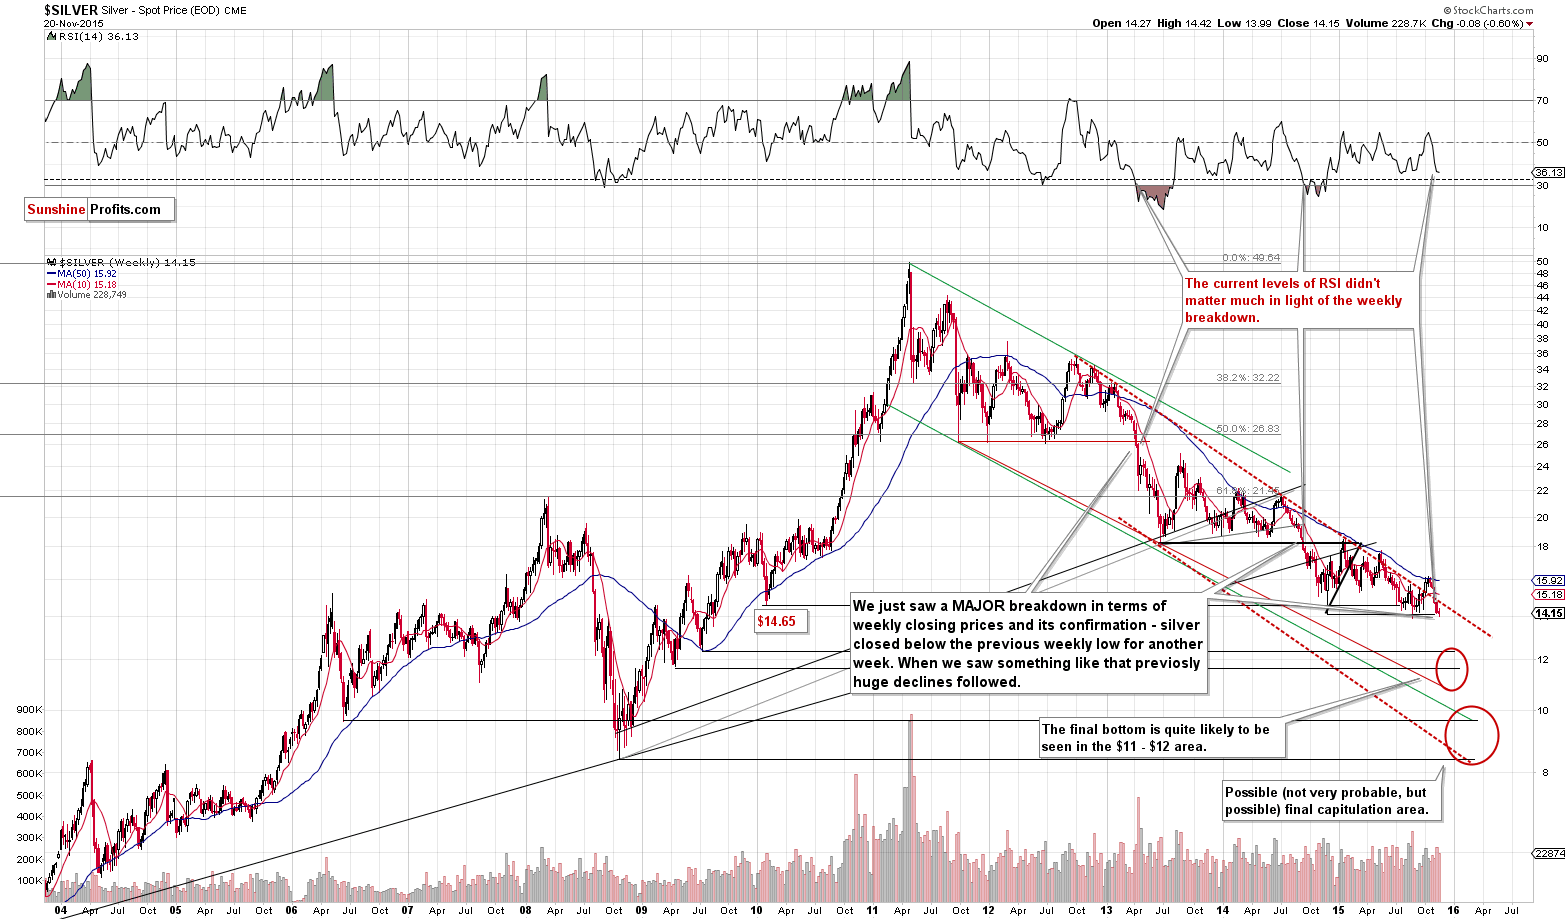
Silver didn’t do much last week. It closed 8 cents lower than on the previous Friday, but just because silver didn’t move much, doesn’t mean that there are no implications. There are implications and they are bearish – the reason is that this was the second weekly close below the previous lows. The breakdown is confirmed.
Why is this so important? Because when that had happened previously, powerful declines followed. Some might say that the RSI indicator is pointing to higher prices, but please note that the RSI is actually more or less where it was after previous weekly breakdowns – it didn’t stop the decline back then and it’s not likely to stop it this time.
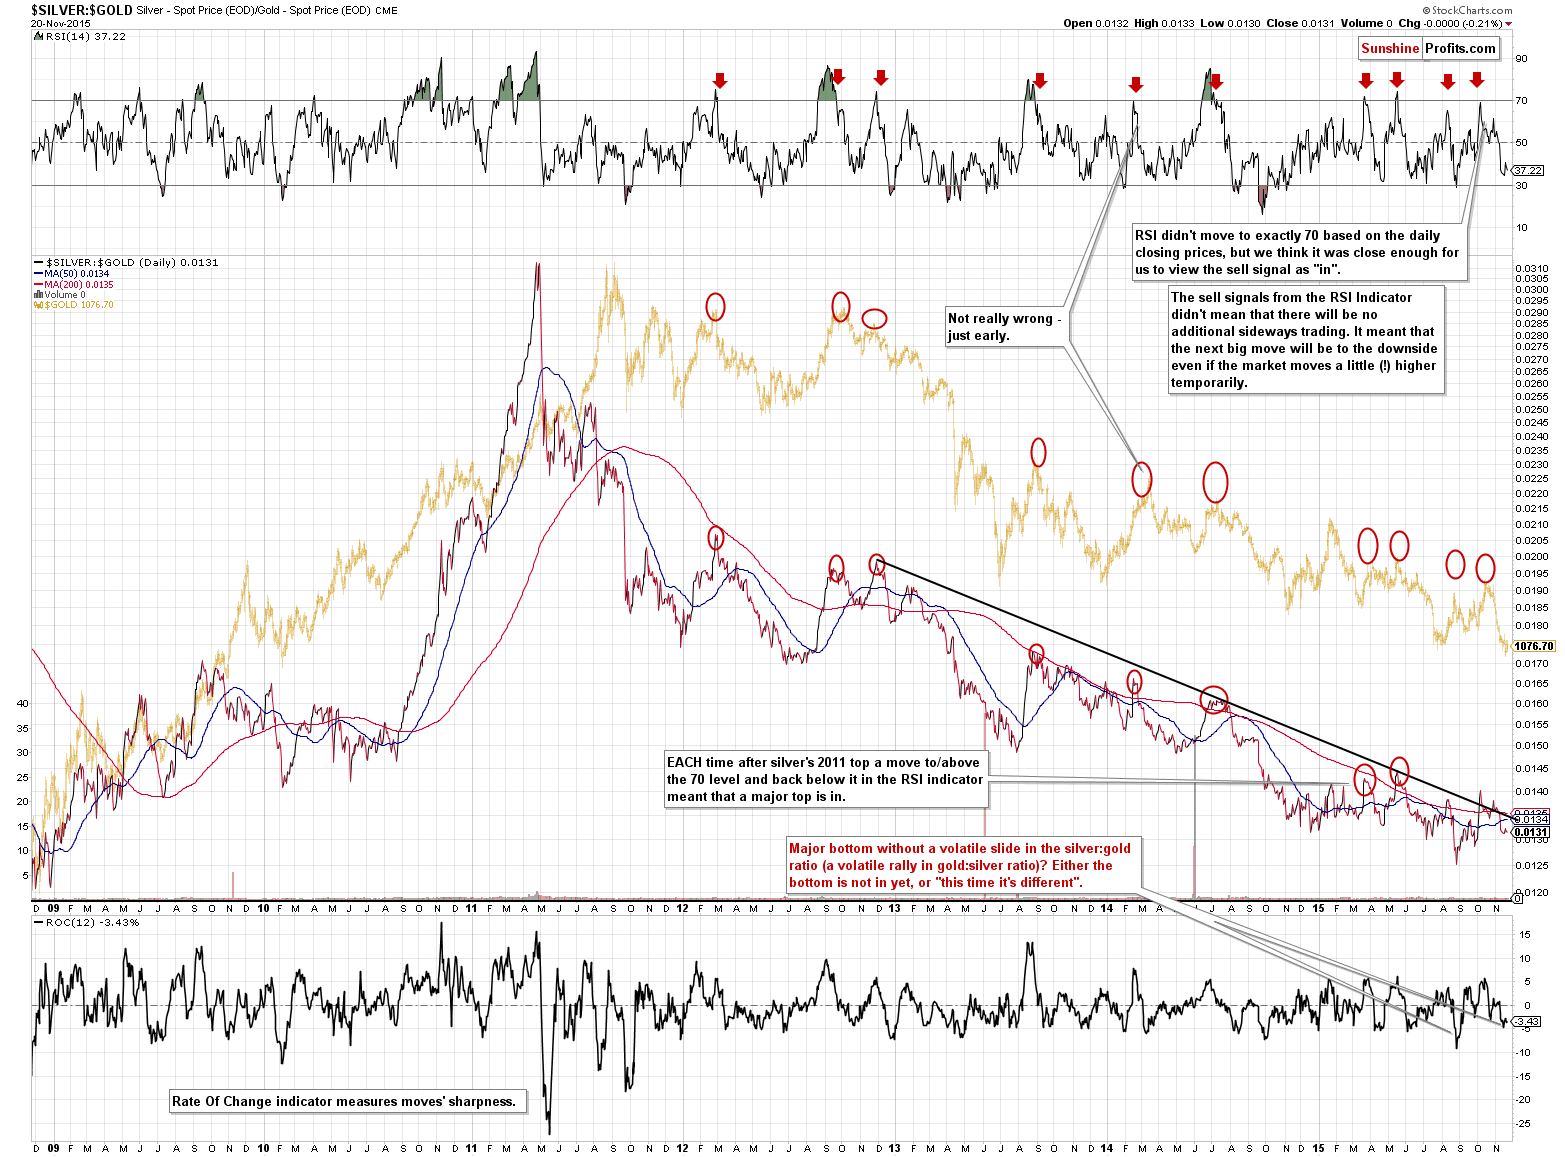
The silver to gold ratio tells us something as well and it’s that the final low has likely not been seen yet. The previous major lows were often accompanied by silver’s sharp underperformance (a panic sell-off) and we haven’t seen something similar this time.
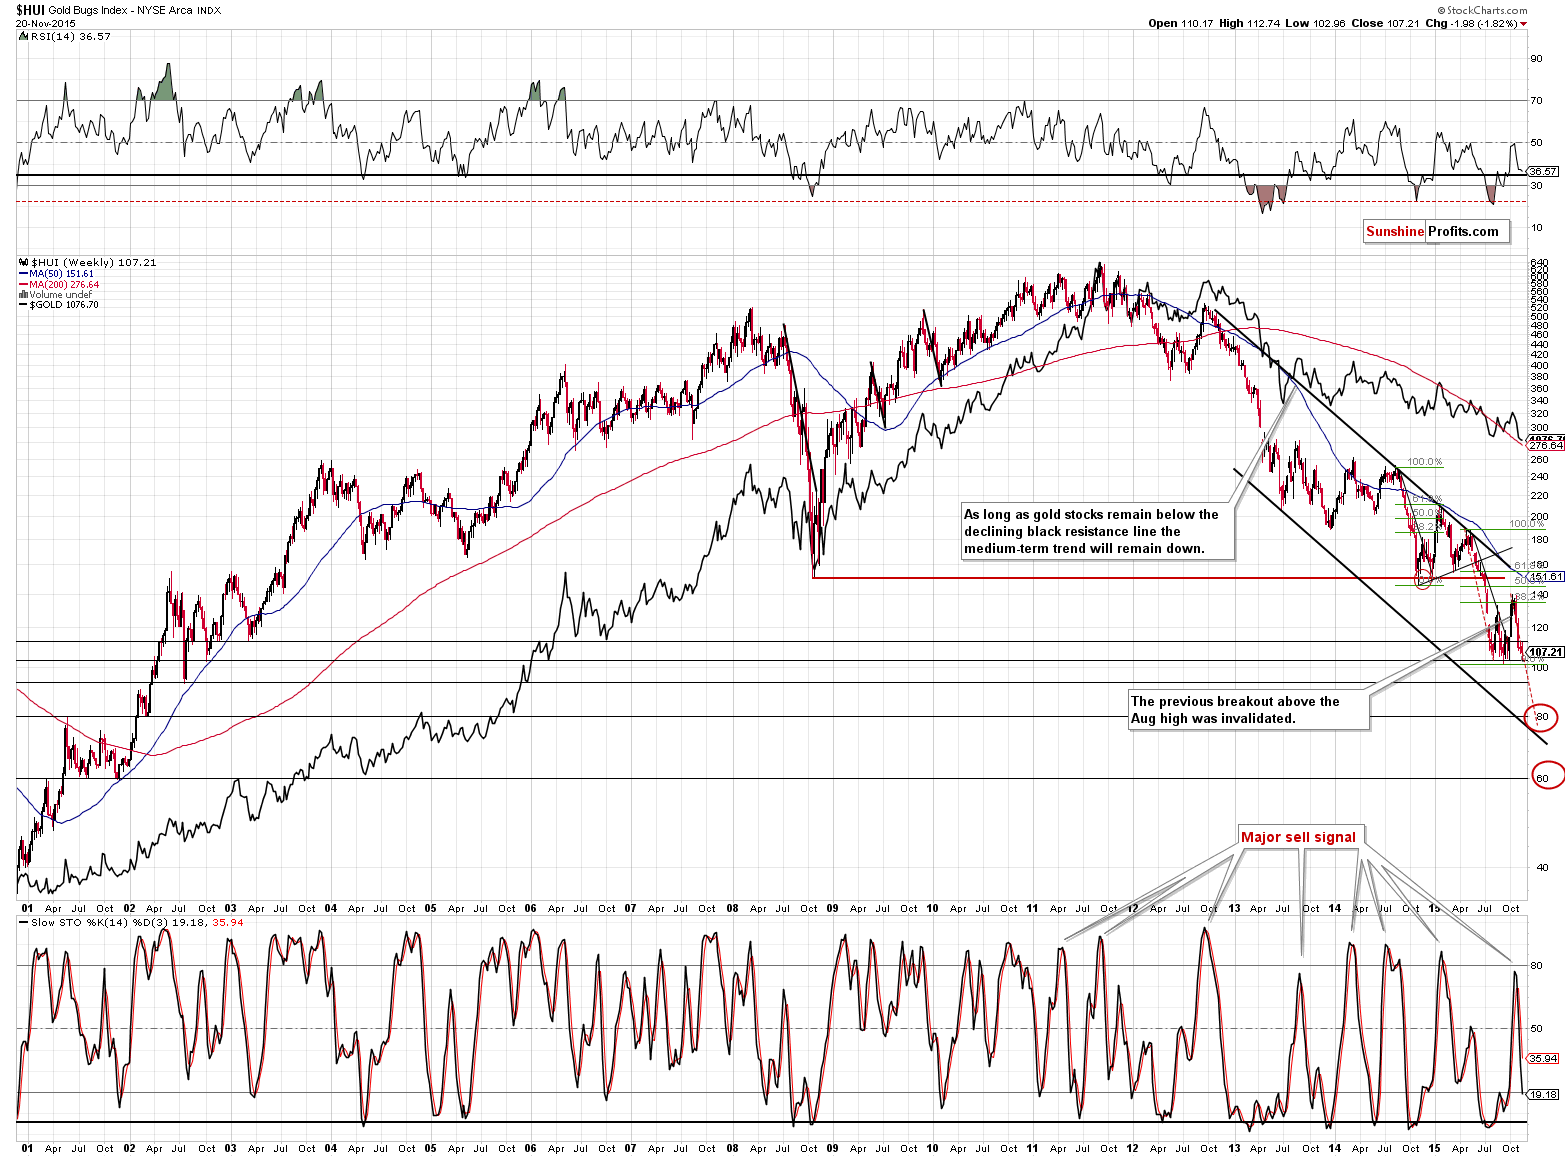
The decline in gold stocks continues normally – the fact that miners didn’t plunge more rapidly or simply lower does not indicate higher prices or that the decline is over. The implications are bearish.
As far as the short-term outlook for mining stocks is concerned, the outlook remains bearish as well, even though mining stocks moved higher on Wednesday and Thursday. In Friday’s alert we wrote the following:
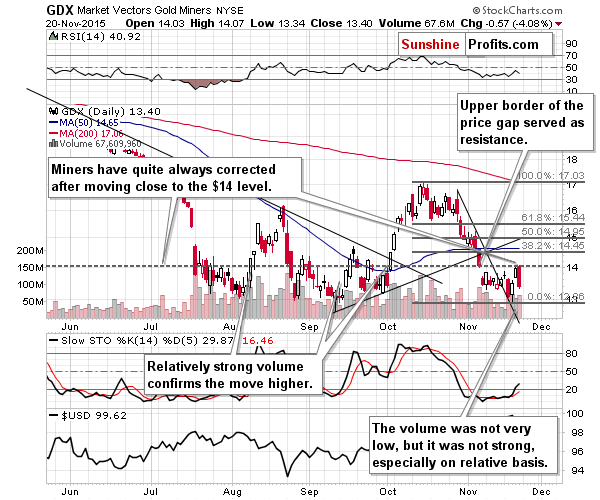
Finally, the most exciting chart for today (not the most important one, though, as we think gold’s confirmed breakdown is more important) – mining stocks. Miners moved over 3% higher yesterday and there had been some cases when the mining stocks’ strong performance heralded higher prices. Is the history repeating?
Not likely. Putting aside the major factors that we discussed regarding gold and silver, the above GDX ETF chart itself shows that this rally is not (yet) to be trusted. Here’s why:
- The previous 3 moves higher that were followed by further rallies had been accompanied by a big increase in volume. Yesterday’s rally was accompanied by volume that was lower than what we had seen in the previous days.
- The $14 level was quite often a target for a corrective upswing and yet declines followed (second half of July, late August, September).
- Miners moved to the upper border of the previous price gap. “Price gaps have to be filled” – is one of the sayings related to technical analysis and we simply may have seen just that.
- The size of the late-October rally (the one that ended in the pre-Fed-announcement fake sharp intra-day rally) was slightly greater than the size of this week’s rally. Corrective upswings that are bigger than the previously biggest corrective upswing are quite likely (generally) to indicate a change in the trend and at this time we haven’t seen this sign. Consequently, the rally is not significant enough to suggest that this is anything more than just another breather that is over or about to be over.
Again, that’s just what we see on the above chart – the most important things are the confirmed breakdown in gold (which makes this situation very different from the previous rallies in gold) and the weekly breakdown in silver.
The above is up-to-date also today – mining stocks corrected, but it’s quite likely that the corrective upswing is already over. The volume during Friday’s decline was higher than what we had seen during Thursday’s rally and the implications are bearish.
Before summarizing, we would like to cover one additional market that’s become more popular recently – copper.
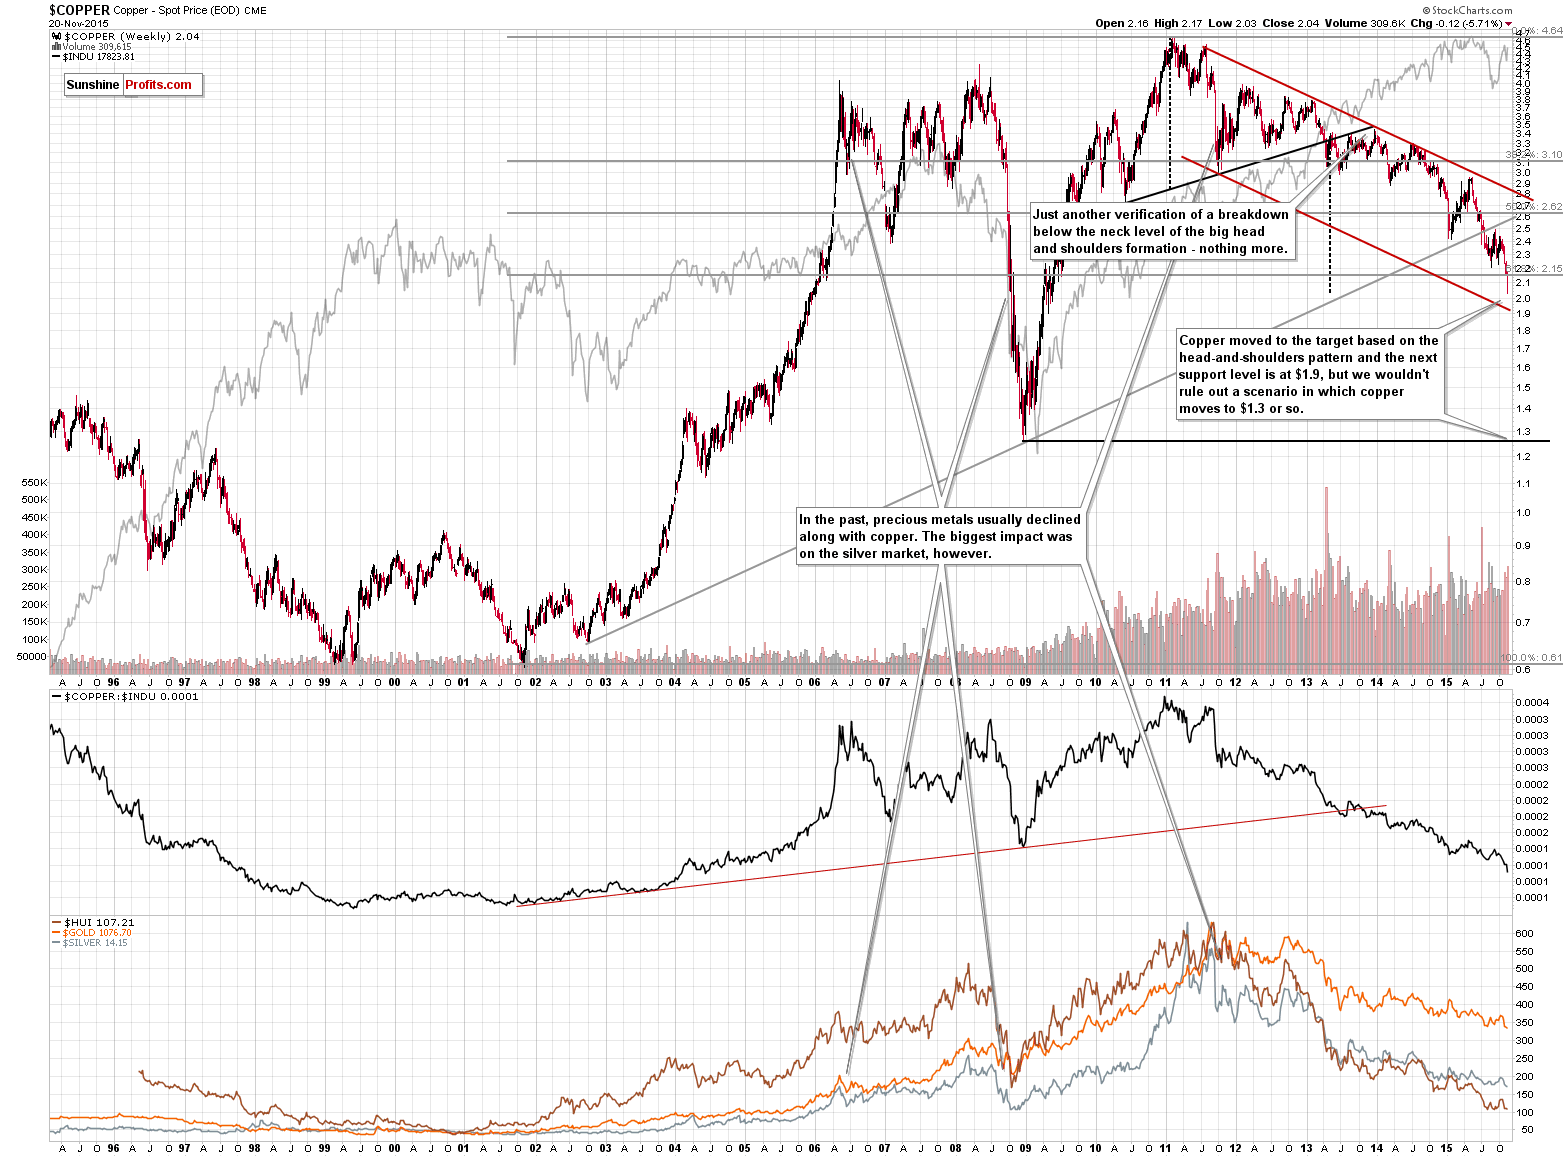
Copper became more popular recently as it broke below the previous 2015 lows. Naturally, the breakdown has bearish implications. We’ve been bearish on copper for many months and when we first wrote about the target based on the bearish head-and-shoulders pattern (formed from late-2009 to 2013), it seemed unrealistic. This target was reached last week. Is the decline over? This may not be the case. The target based on the head-and-shoulders pattern is only one of the ways in which we can estimate how low copper could go. The other support levels are created by the lower border of the declining red trading channel and… the 2008 low. That’s right, copper could slide all the way down below the $1.30 level. Please note that in the past 2 decades in each case when copper moved through the $2.15 level (Fibonacci 61.8% retracement), it continued to move significantly and rather sharply: in 2006 it continued to rally, in 2008 it plunged, and in 2009 it rallied once again. Consequently, reaching $1.30 is not out of the question. We would say it’s actually quite likely.
What does the above have to do with the precious metals market? The mentioned major moves in copper were seen along with major moves in the precious metals sector and we expect the history to repeat itself. Consequently, the breakdown in copper is another bearish confirmation of the bearish outlook for gold, silver and mining stocks.
Summing up, the outlook for the precious metals market deteriorated last week because of major breakdowns in gold and silver and also because of the move lower in the copper market. The intra-week move higher in mining stocks was invalidated on Friday and based on today’s decline it seems that it will shortly be erased entirely.
While we can’t rule out another corrective upswing in the coming days (based on what we have seen this week, it seems that there approximately is a 25% probability of seeing a corrective upswing shortly), but if we see it, it seems unlikely that gold would move above $1,100 or so. It’s more likely that the profits from the current short position will become even bigger in the coming days and weeks.
As always, we will keep you – our subscribers – updated.
To summarize:
Trading capital (our opinion): Short position (full) position in gold, silver and mining stocks is justified from the risk/reward perspective with the following stop-loss orders and initial (! – this means that reaching them doesn’t automatically close the position) target prices:
- Gold: initial target price: $1,012; stop-loss: $1,103, initial target price for the DGLD ETN: $109.27; stop loss for the DGLD ETN $85.51
- Silver: initial target price: $12.60; stop-loss: $14.73, initial target price for the DSLV ETN: $96.67; stop loss for DSLV ETN $61.00
- Mining stocks (price levels for the GDX ETF): initial target price: $11.57; stop-loss: $14.73, initial target price for the DUST ETF: $26.61; stop loss for the DUST ETF $15.49
In case one wants to bet on junior mining stocks' prices (we do not suggest doing so – we think senior mining stocks are more predictable in the case of short-term trades – if one wants to do it anyway, we provide the details), here are the stop-loss details and initial target prices:
- GDXJ ETF: initial target price: $16.27; stop-loss: $20.73
- JDST ETF: initial target price: $46.47; stop-loss: $26.04
Long-term capital (our opinion): No positions
Insurance capital (our opinion): Full position
Plus, you might want to read why our stop-loss orders are usually relatively far from the current price.
Please note that a full position doesn’t mean using all of the capital for a given trade. You will find details on our thoughts on gold portfolio structuring in the Key Insights section on our website.
As a reminder – “initial target price” means exactly that – an “initial” one, it’s not a price level at which we suggest closing positions. If this becomes the case (like it did in the previous trade) we will refer to these levels as levels of exit orders (exactly as we’ve done previously). Stop-loss levels, however, are naturally not “initial”, but something that, in our opinion, might be entered as an order.
Since it is impossible to synchronize target prices and stop-loss levels for all the ETFs and ETNs with the main markets that we provide these levels for (gold, silver and mining stocks – the GDX ETF), the stop-loss levels and target prices for other ETNs and ETF (among other: UGLD, DGLD, USLV, DSLV, NUGT, DUST, JNUG, JDST) are provided as supplementary, and not as “final”. This means that if a stop-loss or a target level is reached for any of the “additional instruments” (DGLD for instance), but not for the “main instrument” (gold in this case), we will view positions in both gold and DGLD as still open and the stop-loss for DGLD would have to be moved lower. On the other hand, if gold moves to a stop-loss level but DGLD doesn’t, then we will view both positions (in gold and DGLD) as closed. In other words, since it’s not possible to be 100% certain that each related instrument moves to a given level when the underlying instrument does, we can’t provide levels that would be binding. The levels that we do provide are our best estimate of the levels that will correspond to the levels in the underlying assets, but it will be the underlying assets that one will need to focus on regarding the sings pointing to closing a given position or keeping it open. We might adjust the levels in the “additional instruments” without adjusting the levels in the “main instruments”, which will simply mean that we have improved our estimation of these levels, not that we changed our outlook on the markets. We are already working on a tool that would update these levels on a daily basis for the most popular ETFs, ETNs and individual mining stocks.
Our preferred ways to invest in and to trade gold along with the reasoning can be found in the how to buy gold section. Additionally, our preferred ETFs and ETNs can be found in our Gold & Silver ETF Ranking.
As always, we'll keep you - our subscribers - updated should our views on the market change. We will continue to send out Gold & Silver Trading Alerts on each trading day and we will send additional Alerts whenever appropriate.
The trading position presented above is the netted version of positions based on subjective signals (opinion) from your Editor, and the Tools and Indicators.
As a reminder, Gold & Silver Trading Alerts are posted before or on each trading day (we usually post them before the opening bell, but we don't promise doing that each day). If there's anything urgent, we will send you an additional small alert before posting the main one.
=====
Latest Free Trading Alerts:
The Baltic Dry Index crashed to an all-time low. What does it mean for the gold market?
S&P 500 index trades closer to its early November local high. Will it break above it? Is holding short position still justified?
Although crude oil increased after Baker Hughes report, the combination of a stronger greenback and ongoing worries over a supply glut encouraged oil bears to act. In this way, light crude lost 0.93% and invalidated small breakout above the short-term resistance. Will this negative signal trigger further deterioration in the coming week?
=====
Hand-picked precious-metals-related links:
Hedge Funds Are Back to Bearish on Gold as Price Slump Deepens
Gold prices drop as dollar’s strength weighs on metals
=====
In other news:
What we got right and wrong in coverage of the Paris attacks
Eastern Europe fears closer French-Russian ties amid Ukraine crisis
=====
Thank you.
Sincerely,
Przemyslaw Radomski, CFA
Founder, Editor-in-chief
Gold & Silver Trading Alerts
Forex Trading Alerts
Oil Investment Updates
Oil Trading Alerts

