

Briefly: In our opinion, short (full) speculative positions in gold, silver and mining stocks are justified from the risk/reward point of view.
Gold and silver moved higher yesterday, but their rally was rather small – the bigger move was seen in mining stocks. In today’s alert we focus on all of them with special emphasis on miners.
Let’s take a look at the charts (charts courtesy of http://stockcharts.com).
In yesterday’s alert we wrote the following:
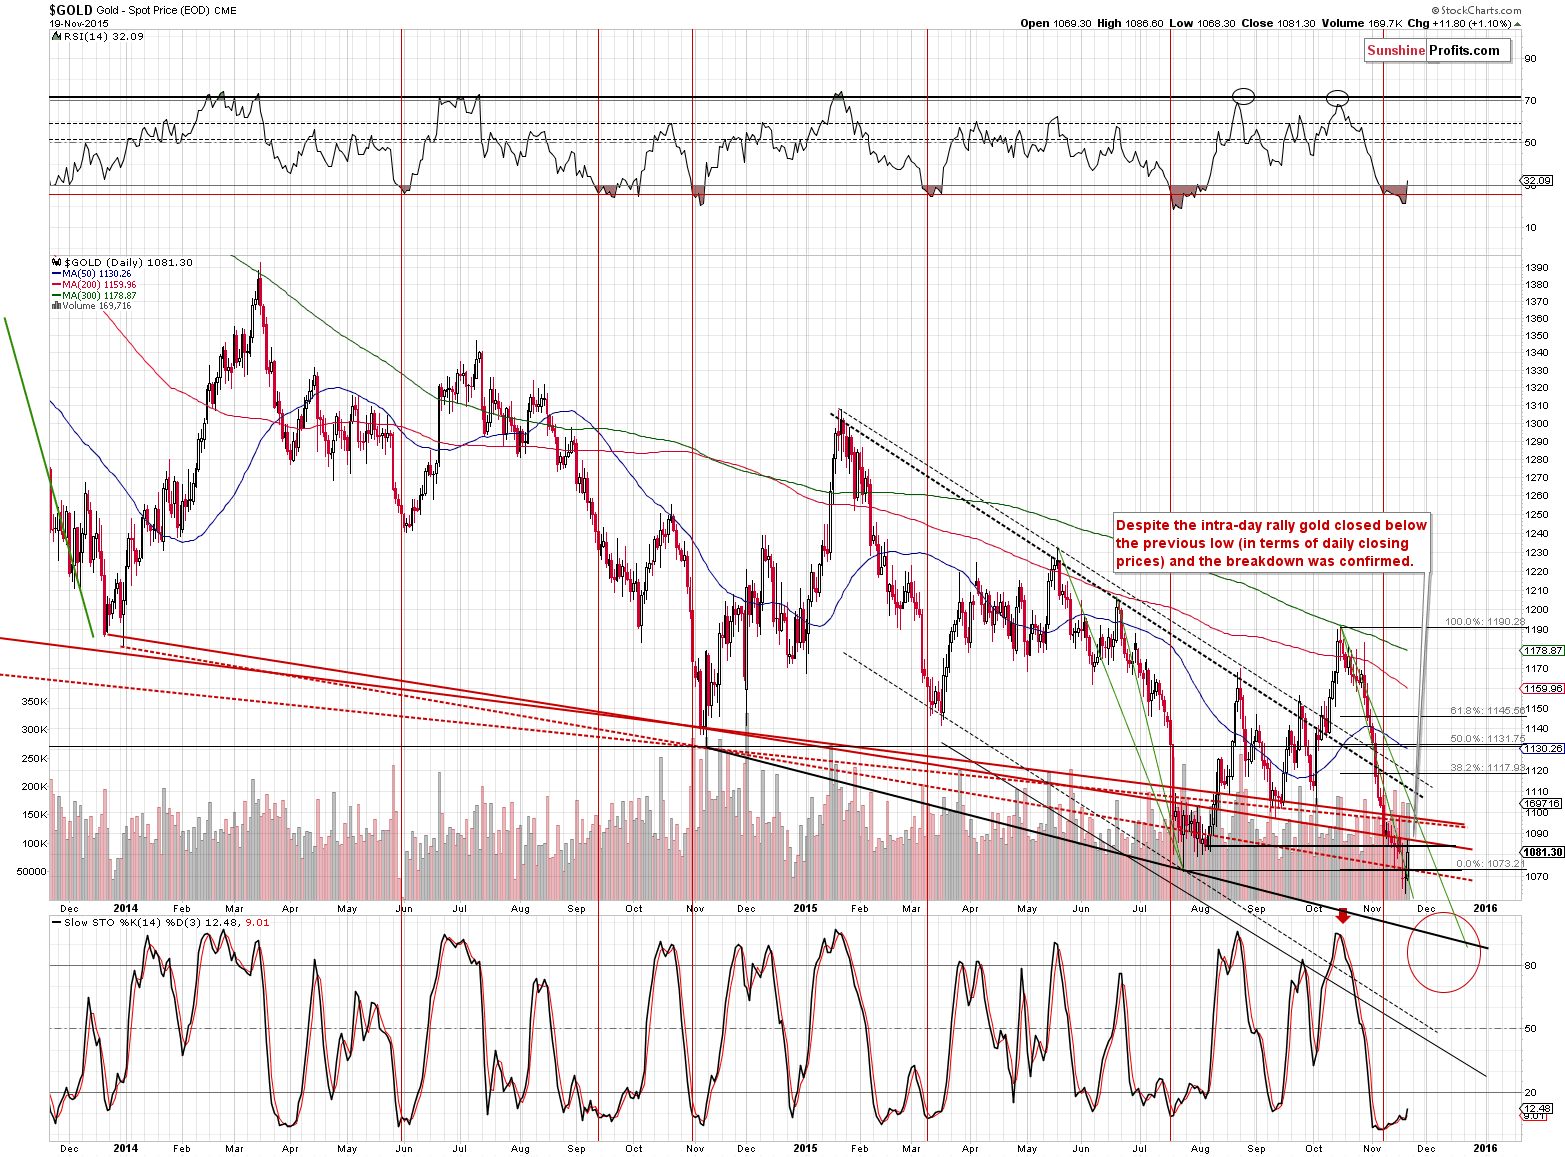
Gold is more or less where it was on Tuesday and with another daily close below the key support levels, the breakdown is getting verified. Ideally, we would like to see a third close below the previous 2015 low as well – then the road to $1,050 or much lower will be fully open.
Gold moved higher yesterday and the implications of yesterday’s action are… bearish. Why? Because gold didn’t rally far enough to invalidate the previous breakdown. Gold has just closed below the previous 2015 low for the third consecutive trading day, so the breakdown was confirmed.
The above is particularly interesting because the USD Index declined quite significantly on an intra-day basis yesterday and even given this bullish factor gold didn’t invalidate the previous breakdown – instead, the breakdown was confirmed. The implications are bearish.
On an intra-day basis, gold simply moved to one of the previous declining resistance lines and then moved back down – nothing to call home about.
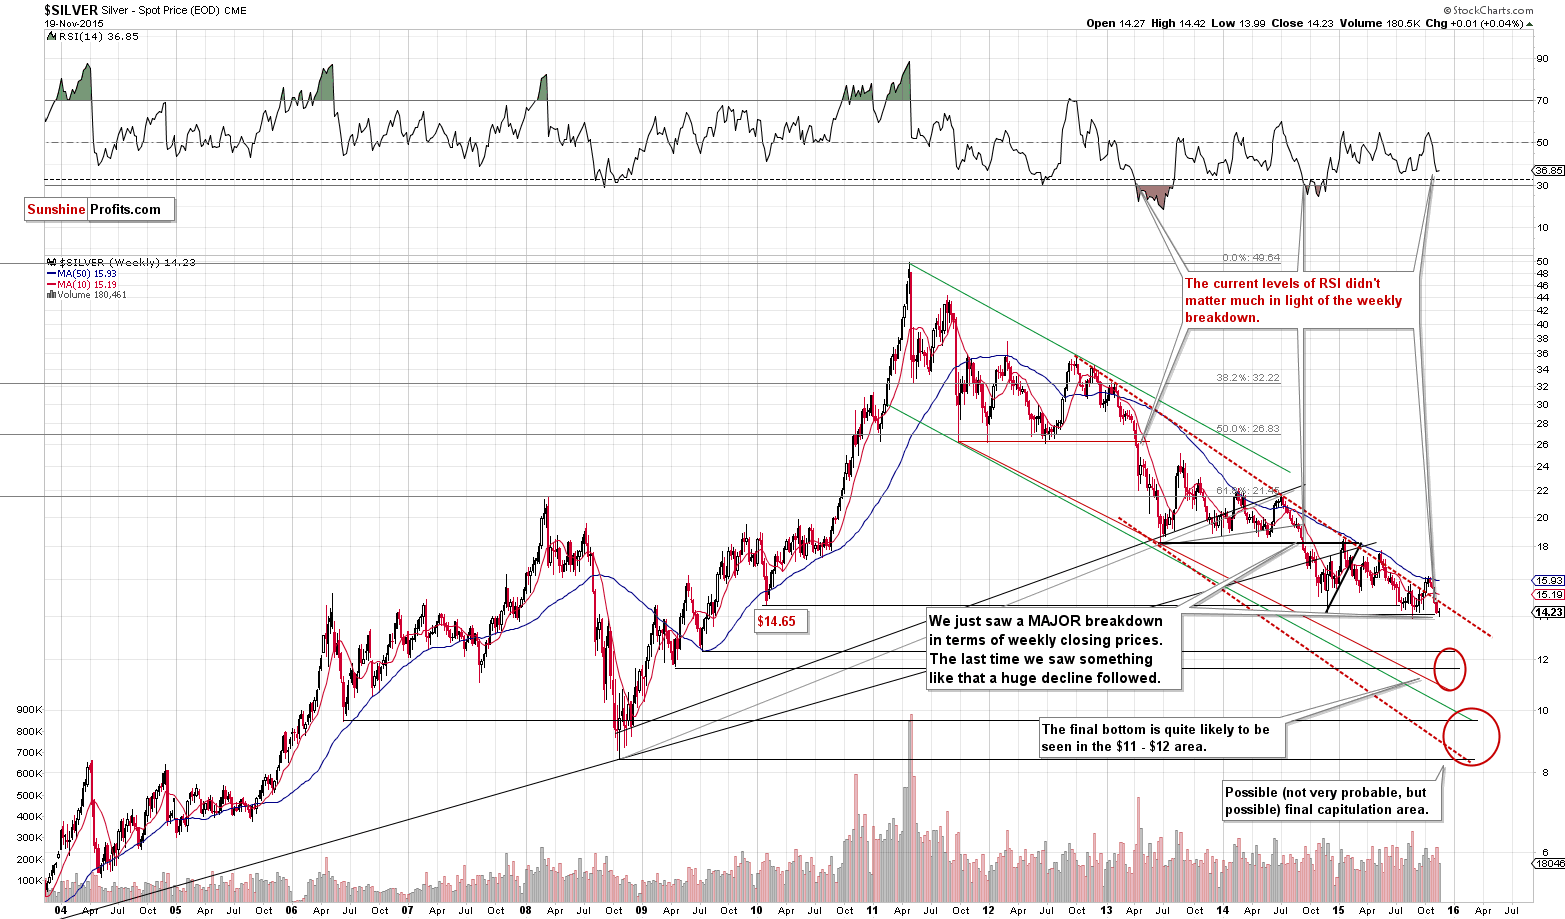
Silver didn’t do much yesterday – it closed $0.10 higher, which is very little. The most important thing about the silver market right now is that it closed last week at a new low (in terms of weekly closing prices, that is) and when that had happened previously, powerful declines followed. Some might say that the RSI indicator is pointing to higher prices, but please note that the RSI is actually more or less where it was after previous weekly breakdowns – it didn’t stop the decline back then and it’s not likely to stop it this time.
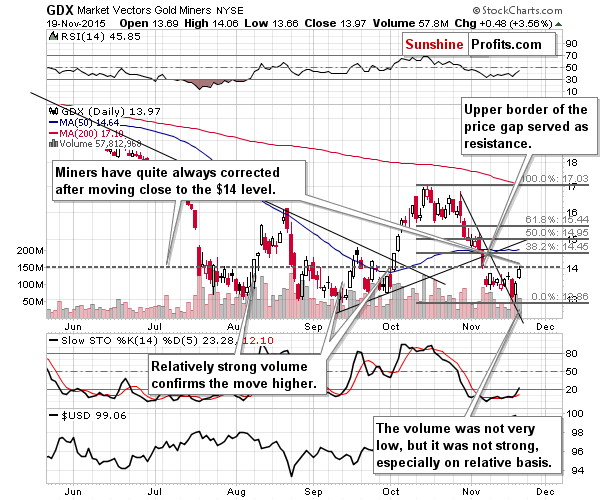
Finally, the most exciting chart for today (not the most important one, though, as we think gold’s confirmed breakdown is more important) – mining stocks. Miners moved over 3% higher yesterday and there had been some cases when the mining stocks’ strong performance heralded higher prices. Is the history repeating?
Not likely. Putting aside the major factors that we discussed regarding gold and silver, the above GDX ETF chart itself shows that this rally is not (yet) to be trusted. Here’s why:
- The previous 3 moves higher that were followed by further rallies had been accompanied by a big increase in volume. Yesterday’s rally was accompanied by volume that was lower than what we had seen in the previous days.
- The $14 level was quite often a target for a corrective upswing and yet declines followed (second half of July, late August, September).
- Miners moved to the upper border of the previous price gap. “Price gaps have to be filled” – is one of the sayings related to technical analysis and we simply may have seen just that.
- The size of the late-October rally (the one that ended in the pre-Fed-announcement fake sharp intra-day rally) was slightly greater than the size of this week’s rally. Corrective upswings that are bigger than the previously biggest corrective upswing are quite likely (generally) to indicate a change in the trend and at this time we haven’t seen this sign. Consequently, the rally is not significant enough to suggest that this is anything more than just another breather that is over or about to be over.
Again, that’s just what we see on the above chart – the most important things are the confirmed breakdown in gold (which makes this situation very different from the previous rallies in gold) and the weekly breakdown in silver.
Summing up, the situation deteriorated a little yesterday as gold closed below the previous 2015 low for the third consecutive day which has important bearish implications (more important in our opinion than the implications of the mining stocks’ upswing). The move higher in mining stocks may indicate some strength in the precious metals market, but in our opinion, it’s unlikely because of several technical reasons and the recent developments in gold and silver.
Consequently, we think that overall the outlook didn’t change based on yesterday’s developments and it remains bearish. We can’t rule out another corrective upswing in the coming days (based on what we have seen this week, it seems that there’s an about 30% probability of seeing a corrective upswing shortly), but if we see it, it seems unlikely that gold would move above $1,100 or so.
Since the situation deteriorated a bit and, at the same time, miners moved closer to our stop-loss level, we are moving the latter a bit higher – above the 38.2% Fibonacci retracement and the 50-day moving average in the GDX ETF.
As always, we will keep you – our subscribers – updated.
To summarize:
Trading capital (our opinion): Short position (full) position in gold, silver and mining stocks is justified from the risk/reward perspective with the following stop-loss orders and initial (! – this means that reaching them doesn’t automatically close the position) target prices:
- Gold: initial target price: $1,012; stop-loss: $1,103, initial target price for the DGLD ETN: $109.27; stop loss for the DGLD ETN $85.51
- Silver: initial target price: $12.60; stop-loss: $14.73, initial target price for the DSLV ETN: $96.67; stop loss for DSLV ETN $61.00
- Mining stocks (price levels for the GDX ETF): initial target price: $11.57; stop-loss: $14.73, initial target price for the DUST ETF: $26.61; stop loss for the DUST ETF $15.49
In case one wants to bet on junior mining stocks' prices (we do not suggest doing so – we think senior mining stocks are more predictable in the case of short-term trades – if one wants to do it anyway, we provide the details), here are the stop-loss details and initial target prices:
- GDXJ ETF: initial target price: $16.27; stop-loss: $20.73
- JDST ETF: initial target price: $46.47; stop-loss: $26.04
Long-term capital (our opinion): No positions
Insurance capital (our opinion): Full position
Plus, you might want to read why our stop-loss orders are usually relatively far from the current price.
Please note that a full position doesn’t mean using all of the capital for a given trade. You will find details on our thoughts on gold portfolio structuring in the Key Insights section on our website.
As a reminder – “initial target price” means exactly that – an “initial” one, it’s not a price level at which we suggest closing positions. If this becomes the case (like it did in the previous trade) we will refer to these levels as levels of exit orders (exactly as we’ve done previously). Stop-loss levels, however, are naturally not “initial”, but something that, in our opinion, might be entered as an order.
Since it is impossible to synchronize target prices and stop-loss levels for all the ETFs and ETNs with the main markets that we provide these levels for (gold, silver and mining stocks – the GDX ETF), the stop-loss levels and target prices for other ETNs and ETF (among other: UGLD, DGLD, USLV, DSLV, NUGT, DUST, JNUG, JDST) are provided as supplementary, and not as “final”. This means that if a stop-loss or a target level is reached for any of the “additional instruments” (DGLD for instance), but not for the “main instrument” (gold in this case), we will view positions in both gold and DGLD as still open and the stop-loss for DGLD would have to be moved lower. On the other hand, if gold moves to a stop-loss level but DGLD doesn’t, then we will view both positions (in gold and DGLD) as closed. In other words, since it’s not possible to be 100% certain that each related instrument moves to a given level when the underlying instrument does, we can’t provide levels that would be binding. The levels that we do provide are our best estimate of the levels that will correspond to the levels in the underlying assets, but it will be the underlying assets that one will need to focus on regarding the sings pointing to closing a given position or keeping it open. We might adjust the levels in the “additional instruments” without adjusting the levels in the “main instruments”, which will simply mean that we have improved our estimation of these levels, not that we changed our outlook on the markets. We are already working on a tool that would update these levels on a daily basis for the most popular ETFs, ETNs and individual mining stocks.
Our preferred ways to invest in and to trade gold along with the reasoning can be found in the how to buy gold section. Additionally, our preferred ETFs and ETNs can be found in our Gold & Silver ETF Ranking.
As always, we'll keep you - our subscribers - updated should our views on the market change. We will continue to send out Gold & Silver Trading Alerts on each trading day and we will send additional Alerts whenever appropriate.
The trading position presented above is the netted version of positions based on subjective signals (opinion) from your Editor, and the Tools and Indicators.
As a reminder, Gold & Silver Trading Alerts are posted before or on each trading day (we usually post them before the opening bell, but we don't promise doing that each day). If there's anything urgent, we will send you an additional small alert before posting the main one.
=====
Latest Free Trading Alerts:
The Consumer Price Index increased 0.2 percent in October. What does it mean for the gold market?
U.S. CPI Rises in October. Will It Affect Gold?
The yield curve is an overlooked, but potentially important factor for the gold market. We invite you to read our today’s article on the relationship between the yield curve and the price of gold and learn why the shape of yield curve may be a useful indicator for gold investors.
Is the Yield Curve a Driver of Gold Prices?
S&P 500 index continued its rally on Wednesday, following Fed's data release. Is this a new uptrend or just volatile short-term consolidation following October rally?
Stock Trading Alert: Investors' Sentiment Continues To Improve, But Will It Last?
Yesterday, the USD Index extended gains and climbed to an intraday high of 99.97 on hopes that the Federal Reserve will raise interest rates on its next meeting in Dec. This improvement encouraged investors to take profits from the greenback’s rally, which resulted in a small pullback earlier today. What impact did this move have on the euro, Canadian dollar and Swiss franc?
Forex Trading Alert: USD Index Approaches Barrier of 100
=====
Hand-picked precious-metals-related links:
India monetizes 14 ounces of gold
Forecast of Platinum SUPPLY & DEMAND IN 2015
ScotiaMocatta: Commitments of Traders (CFTC)
Is there really a future for gold mining in South Africa?
=====
In other news:
14 Predictions for 2016 from the Brightest Minds in Finance
Peter Schiff thinks Fed is playing a ‘dangerous game’ with Wall Street
Dovish Draghi ready to act 'quickly' to boost inflation
The real reason behind China's latest 'stimulus'
Chinese commodity trade barometer at record low
Fear & Greed Index: What emotion is driving the market now?
=====
Thank you.
Sincerely,
Przemyslaw Radomski, CFA
Founder, Editor-in-chief
Gold & Silver Trading Alerts
Forex Trading Alerts
Oil Investment Updates
Oil Trading Alerts

