

Briefly: In our opinion, short (full) speculative positions in gold, silver and mining stocks are justified from the risk/reward point of view.
Yesterday’s session was the exact opposite to what we had seen previously, when metals and miners rallied – mining stocks declined (and the HUI Index invalidated its breakout above the August high in terms of daily closing prices) even though gold closed higher. If it wasn’t enough, gold is moving lower today despite a move higher in the USD Index. It seems that the rally is over – but is it really the case?
Most likely – yes. The situation deteriorated based on the above and the risk/reward ratio for our short position seems even better. In fact, it seems that doubling the size of the short position in the case of the mining stocks is also justified from the risk/reward point of view.
The points made in yesterday’s alert are up-to-date, so in today’s issue we’ll focus more on what changed and if you haven’t had the chance to read yesterday’s alert, we encourage you to do so today. Having said that, let’s take a look at the charts (charts courtesy of http://stockcharts.com).
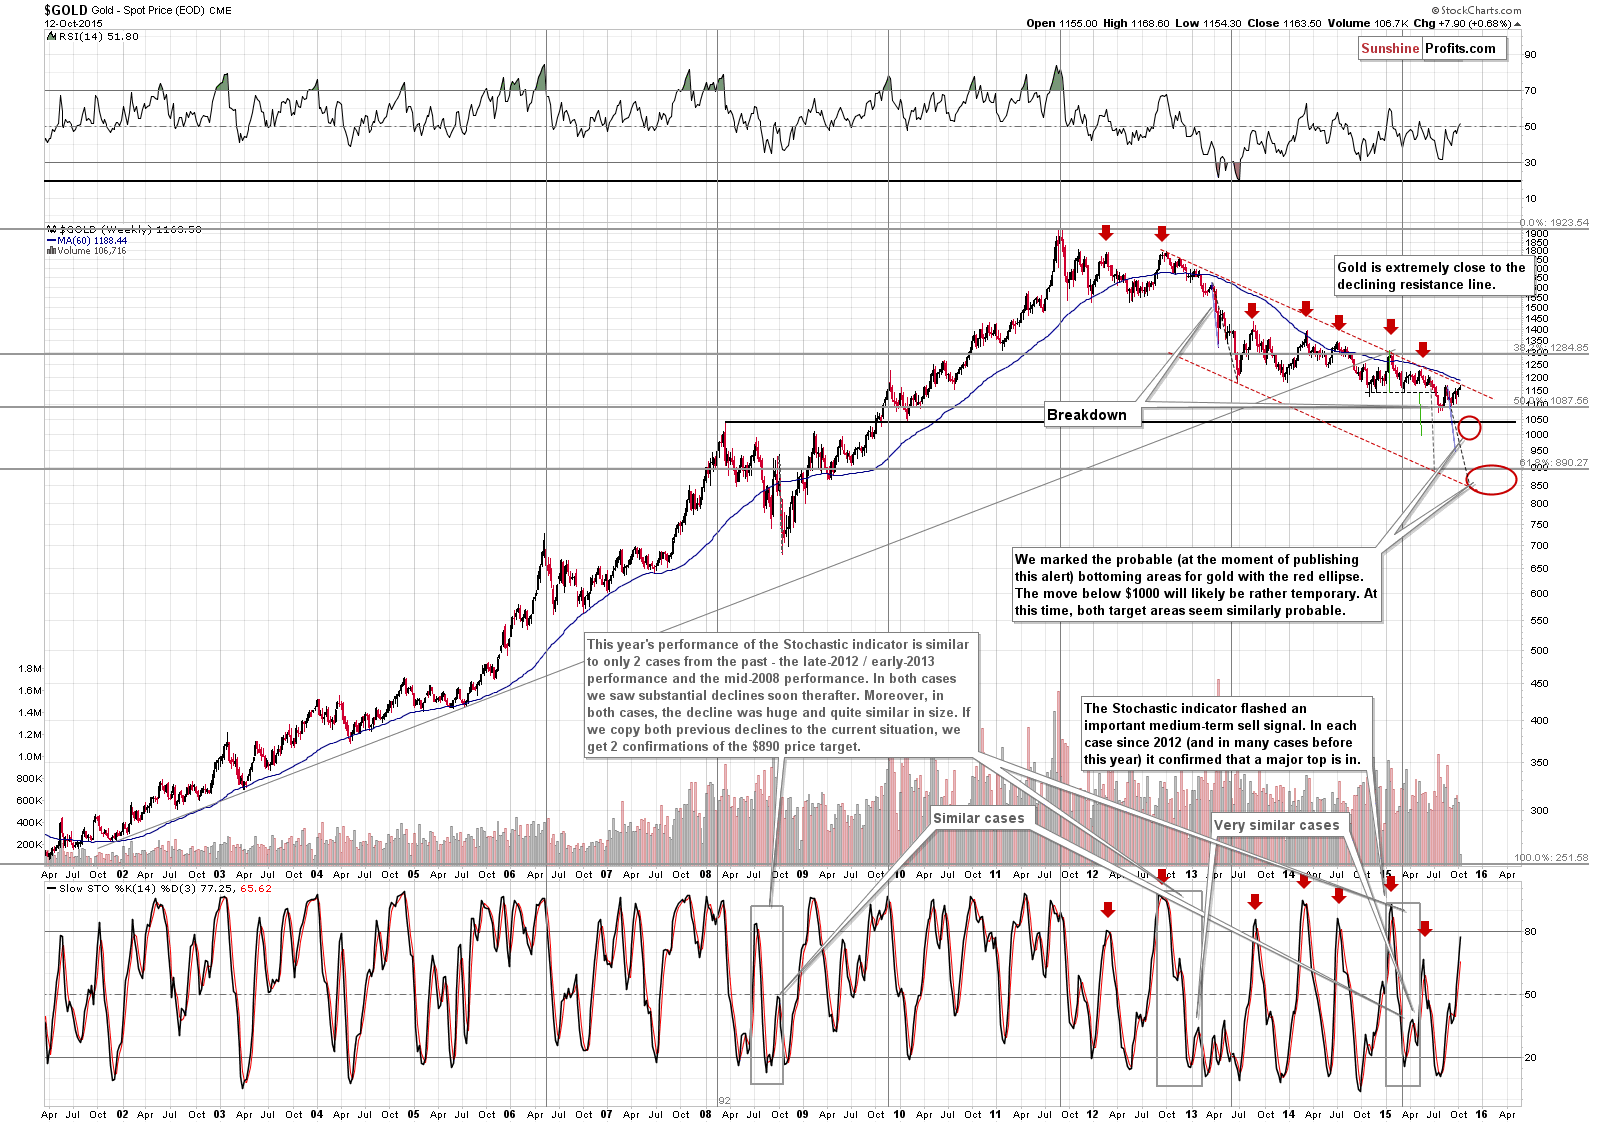
Gold moved close to its August high, but much more importantly, it moved very close, or practically to the declining long-term red resistance line. The strength of this resistance is huge and it’s no wonder that gold reversed on an intra-day basis yesterday. It closed higher than on the previous, day, but such days, when we saw a decline during normal market hours, and a close higher than on the previous day nonetheless, were often local tops.
Please note that the Stochastic indicator is very close to the 80 level (at 77.25) and sell signals from this indicator around this level were very often associated with important medium-term tops. We have not seen a sell signal yet, but given today’s pre-market decline ($8 at the moment of writing these words – along with a 0.20 decline in the USD Index) suggests that we will get this bearish signal very soon.
Speaking of bearish signals…
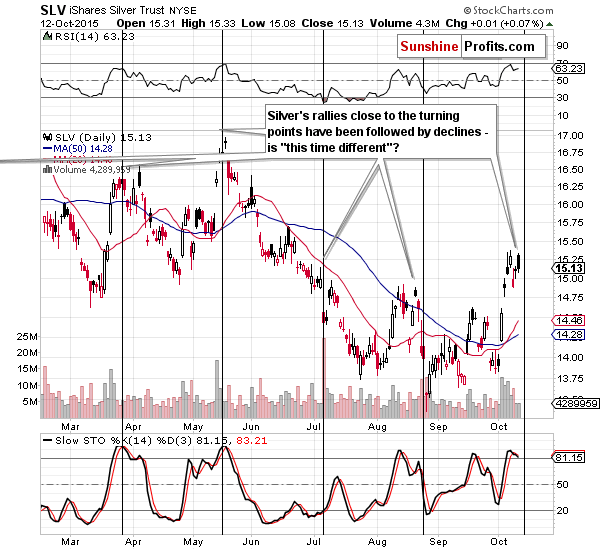
Silver’s cyclical turning point is just around the corner and in the recent past silver always either declined or truly plunged after these turning points. The implications are clearly bearish. The sell signal from the Stochastic indicator and RSI touching the 70 level make the outlook even more bearish.
Additionally, even though silver rallied early in the session, the overall volume for that day was relatively low, which also doesn’t bode well for the precious metals sector.
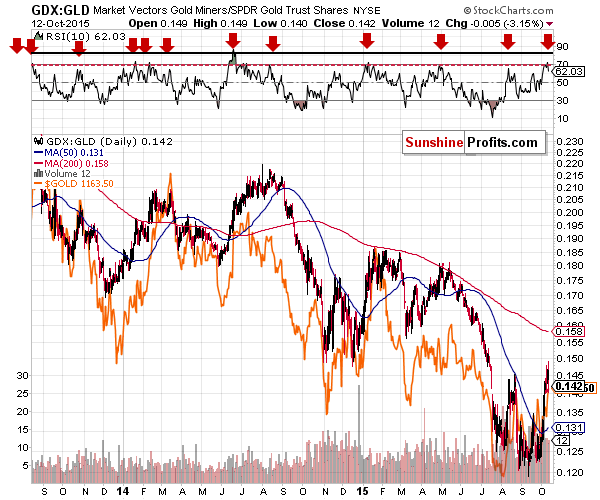
The GDX to GLD ratio also suggests that lower prices are on the horizon. In the past years when the RSI based on this ratio moved to 70 and then declined, it meant that a local top was in – we have just seen this signal once again.
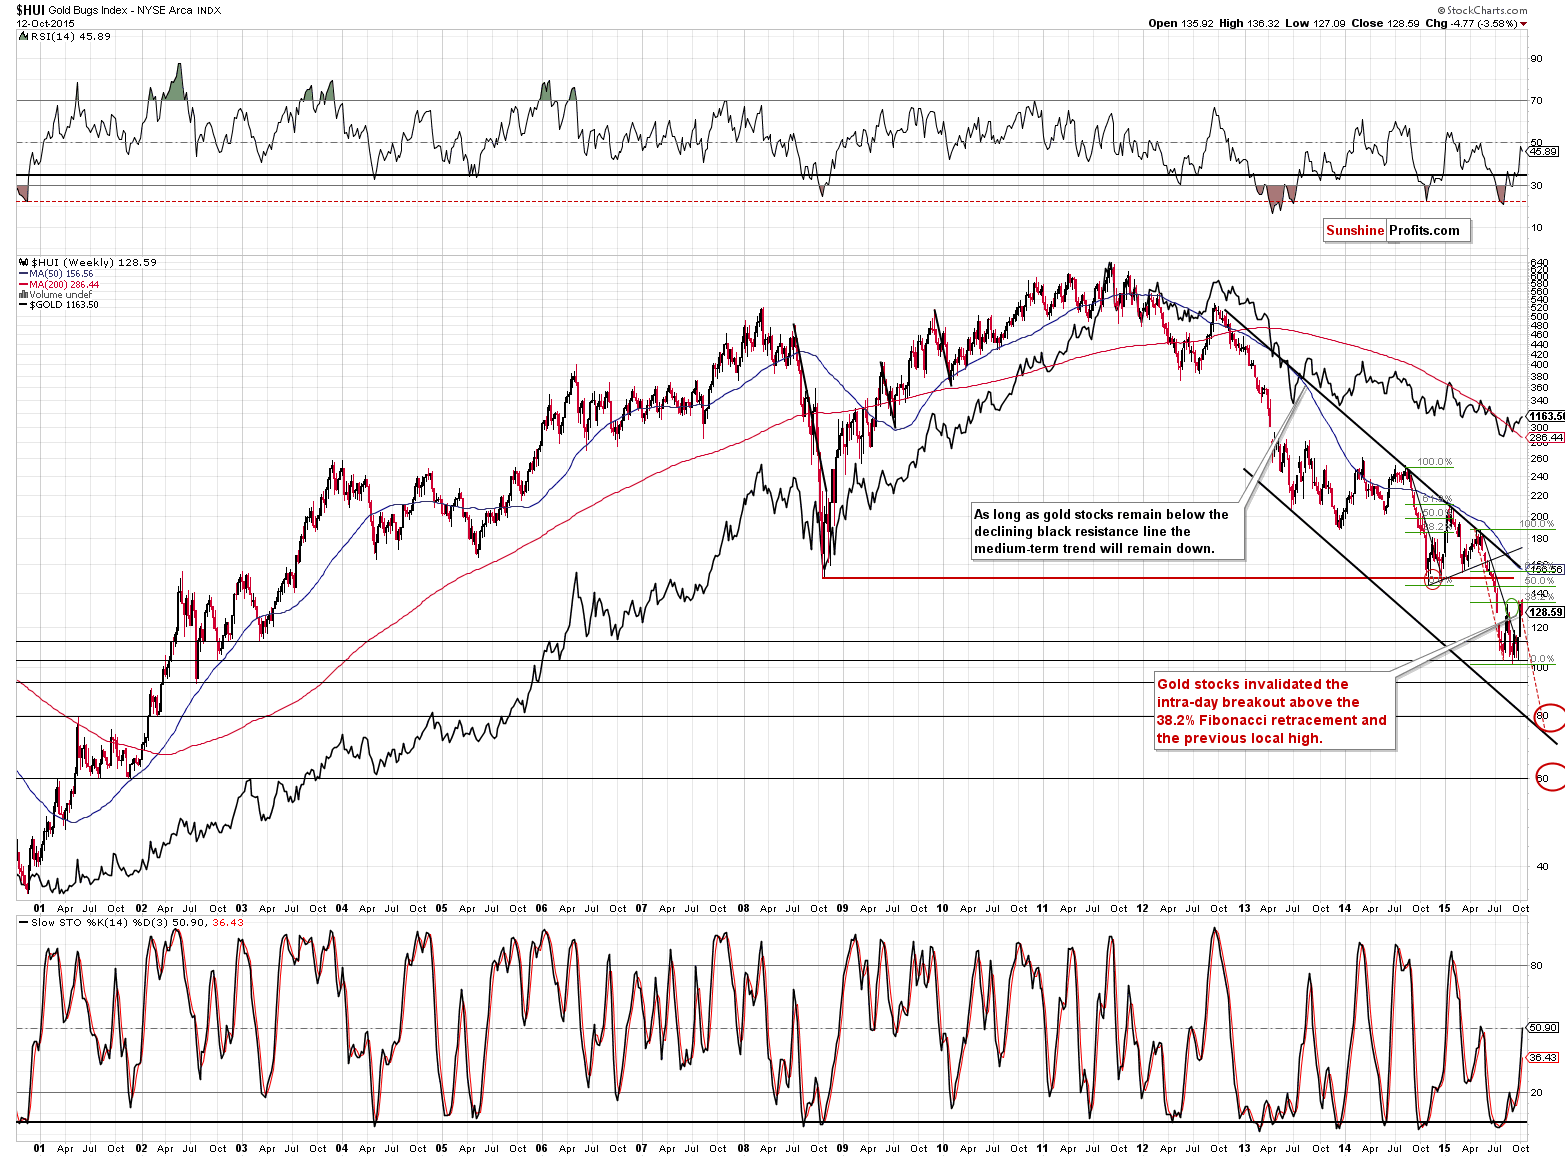
Another bearish signal comes from the HUI Index. The index closed below its August 2015 high, so the breakout above it was invalidated. In our yesterday’s second alert, we wrote the following:
The breakouts above the August highs in case of GDX and HUI Index were not invalidated and that’s why we are only re-opening the position using half of the capital that would normally be used to do it.
Since these breakouts were invalidated after all and we saw additional bearish signs, it seems that a full short position is once again justified from the risk/reward perspective.
In yesterday’s alert we wrote the following:
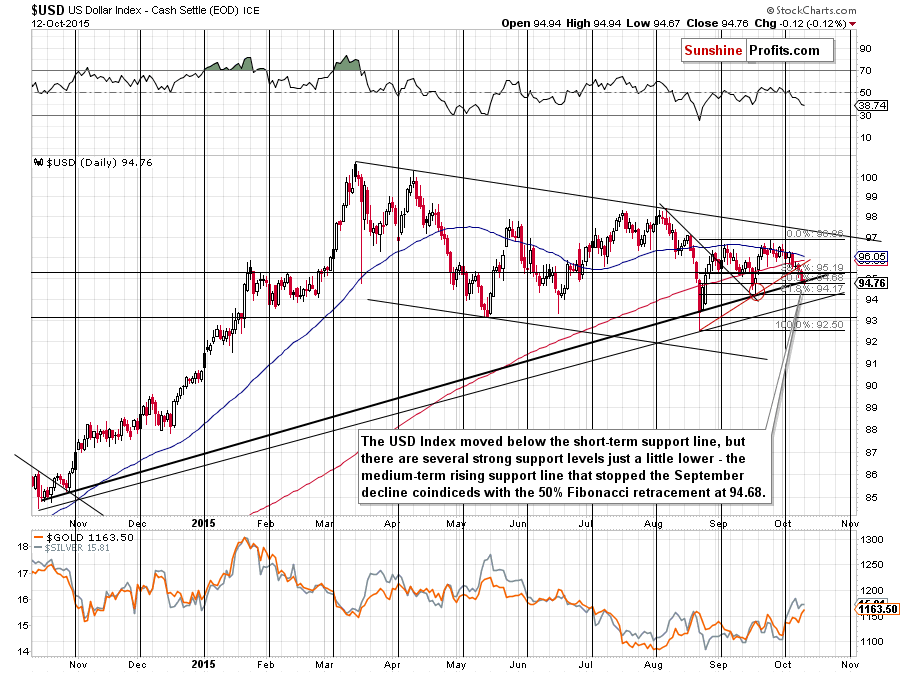
(…) The medium-term rising support line based on the lows (in terms of daily closing prices) of Oct. 2014 and Aug. 2015 is at 94.68, which is where we also have the Fibonacci 50% retracement. This support level is more significant than the rising red support/resistance line, so we don’t think that today’s decline (and yesterday’s one) changed much.
The USD Index moved even lower and it even moved to the rising support line (and almost moved to the 50% Fibonacci retracement level on Friday – it managed to reach this level in today’s pre-market trading), which is quite significant. It suggests that USD is likely to turn around and trigger a decline in commodity prices (including the precious metals sector).
The USD Index is attempting to move a little lower, but the mentioned combination of support levels is stopping it. The fact that gold is trying to decline before the USD’s rally only confirms the bearish outlook in the case of the former.
Summing up, we have seen an invalidation of the breakout above the August 2015 high in the case of mining stocks and we have seen additional bearish signals from the metals and related ratios. Consequently, it seems that a full short position is now justified from the risk/reward perspective. Naturally, the medium-term trend remains down as well.
As always, we will keep you – our subscribers – updated.
To summarize:
Trading capital (our opinion): Short position (full) position in gold, silver and mining stocks is justified from the risk/reward perspective with the following stop-loss orders and initial (! – this means that reaching them doesn’t automatically close the position) target prices:
- Gold: initial target price: $1,050; stop-loss: $1,213, initial target price for the DGLD ETN: $98.37; stop loss for the DGLD ETN $65.60
- Silver: initial target price: $12.60; stop-loss: $16.73, initial target price for the DSLV ETN: $96.67; stop loss for DSLV ETN $40.28
- Mining stocks (price levels for the GDX ETN): initial target price: $11.57; stop-loss: $17.33, initial target price for the DUST ETN: $26.61; stop loss for the DUST ETN $10.42
In case one wants to bet on junior mining stocks' prices (we do not suggest doing so – we think senior mining stocks are more predictable in the case of short-term trades – if one wants to do it anyway, we provide the details), here are the stop-loss details and initial target prices:
- GDXJ: initial target price: $16.27; stop-loss: $24.33
- JDST: initial target price: $46.47; stop-loss: $17.14
Long-term capital (our opinion): No positions
Insurance capital (our opinion): Full position
Please note that a full position doesn’t mean using all of the capital for a given trade. You will find details on our thoughts on gold portfolio structuring in the Key Insights section on our website.
As a reminder – “initial target price” means exactly that – an “initial” one, it’s not a price level at which we suggest closing positions. If this becomes the case (like it did in the previous trade) we will refer to these levels as levels of exit orders (exactly as we’ve done previously). Stop-loss levels, however, are naturally not “initial”, but something that, in our opinion, might be entered as an order.
Since it is impossible to synchronize target prices and stop-loss levels for all the ETFs and ETNs with the main markets that we provide these levels for (gold, silver and mining stocks – the GDX ETF), the stop-loss levels and target prices for other ETNs and ETF (among other: UGLD, DGLD, USLV, DSLV, NUGT, DUST, JNUG, JDST) are provided as supplementary, and not as “final”. This means that if a stop-loss or a target level is reached for any of the “additional instruments” (DGLD for instance), but not for the “main instrument” (gold in this case), we will view positions in both gold and DGLD as still open and the stop-loss for DGLD would have to be moved lower. On the other hand, if gold moves to a stop-loss level but DGLD doesn’t, then we will view both positions (in gold and DGLD) as closed. In other words, since it’s not possible to be 100% certain that each related instrument moves to a given level when the underlying instrument does, we can’t provide levels that would be binding. The levels that we do provide are our best estimate of the levels that will correspond to the levels in the underlying assets, but it will be the underlying assets that one will need to focus on regarding the sings pointing to closing a given position or keeping it open. We might adjust the levels in the “additional instruments” without adjusting the levels in the “main instruments”, which will simply mean that we have improved our estimation of these levels, not that we changed our outlook on the markets. We are already working on a tool that would update these levels on a daily basis for the most popular ETFs, ETNs and individual mining stocks.
Our preferred ways to invest in and to trade gold along with the reasoning can be found in the how to buy gold section. Additionally, our preferred ETFs and ETNs can be found in our Gold & Silver ETF Ranking.
As always, we'll keep you - our subscribers - updated should our views on the market change. We will continue to send out Gold & Silver Trading Alerts on each trading day and we will send additional Alerts whenever appropriate.
The trading position presented above is the netted version of positions based on subjective signals (opinion) from your Editor, and the Tools and Indicators.
As a reminder, Gold & Silver Trading Alerts are posted before or on each trading day (we usually post them before the opening bell, but we don't promise doing that each day). If there's anything urgent, we will send you an additional small alert before posting the main one.
=====
Latest Free Trading Alerts:
Is a recession possible in Singapore? How could it affect the global economy and the gold market?
Is Singapore Heading for Recession?
In recent days, the USD Index has been trading around the level of 95, which resulted in the consolidation in GBP/USD. Will the proximity to important resistance levels encourage currency bears to act in the coming days?
Forex Trading Alert: GBP/USD – Sinking or Rebounding?
=====
Hand-picked precious-metals-related links:
China may now be close to new gold benchmark pricing system
=====
In other news:
Goldman: This is the third wave of the financial crisis
Citi's Buiter: World faces recession next year
Brexit would mean EU collapse: LSE CEO
U.S. stocks: The punches keep coming
UK economy falls into deflation in September
China to put growth before reform ambitions amid slowdown fear
Oil demand growth to slow but OPEC keeps pumping
=====
Thank you.
Sincerely,
Przemyslaw Radomski, CFA
Founder, Editor-in-chief
Gold & Silver Trading Alerts
Forex Trading Alerts
Oil Investment Updates
Oil Trading Alerts

