

Briefly: In our opinion, short (full) speculative positions in gold, and silver are justified from the risk/reward point of view. We think that no speculative positions are currently justified from the risk/reward perspective in the mining stocks.
Yesterday was yet another day when the mining stocks and silver performed very strongly. The breakout in mining stocks is a confirmed fact, and now we saw a breakout in silver (above its August high). Is this the beginning of another major bull market?
Our reply to the above question hasn’t changed since yesterday:
In our opinion – no, the medium-term trend didn’t change and it remains bearish and it seems likely that the next big move will be to the downside. By „big“ we mean „big“, not a 20-index-point rally in the HUI or a $30 rally in gold. We mean a $100+ move in gold (similarly to the previous short trade, when we profited on a $100+ slide). The only thing that changed in the recent days is the short-term outlook (especially for the mining stocks). Let’s examine the charts and see what’s likely to happen next (charts courtesy of http://stockcharts.com).
Let’s start with the long-term charts.
Basically nothing changed on the long-term chart, and our previous comments remain up-to-date:
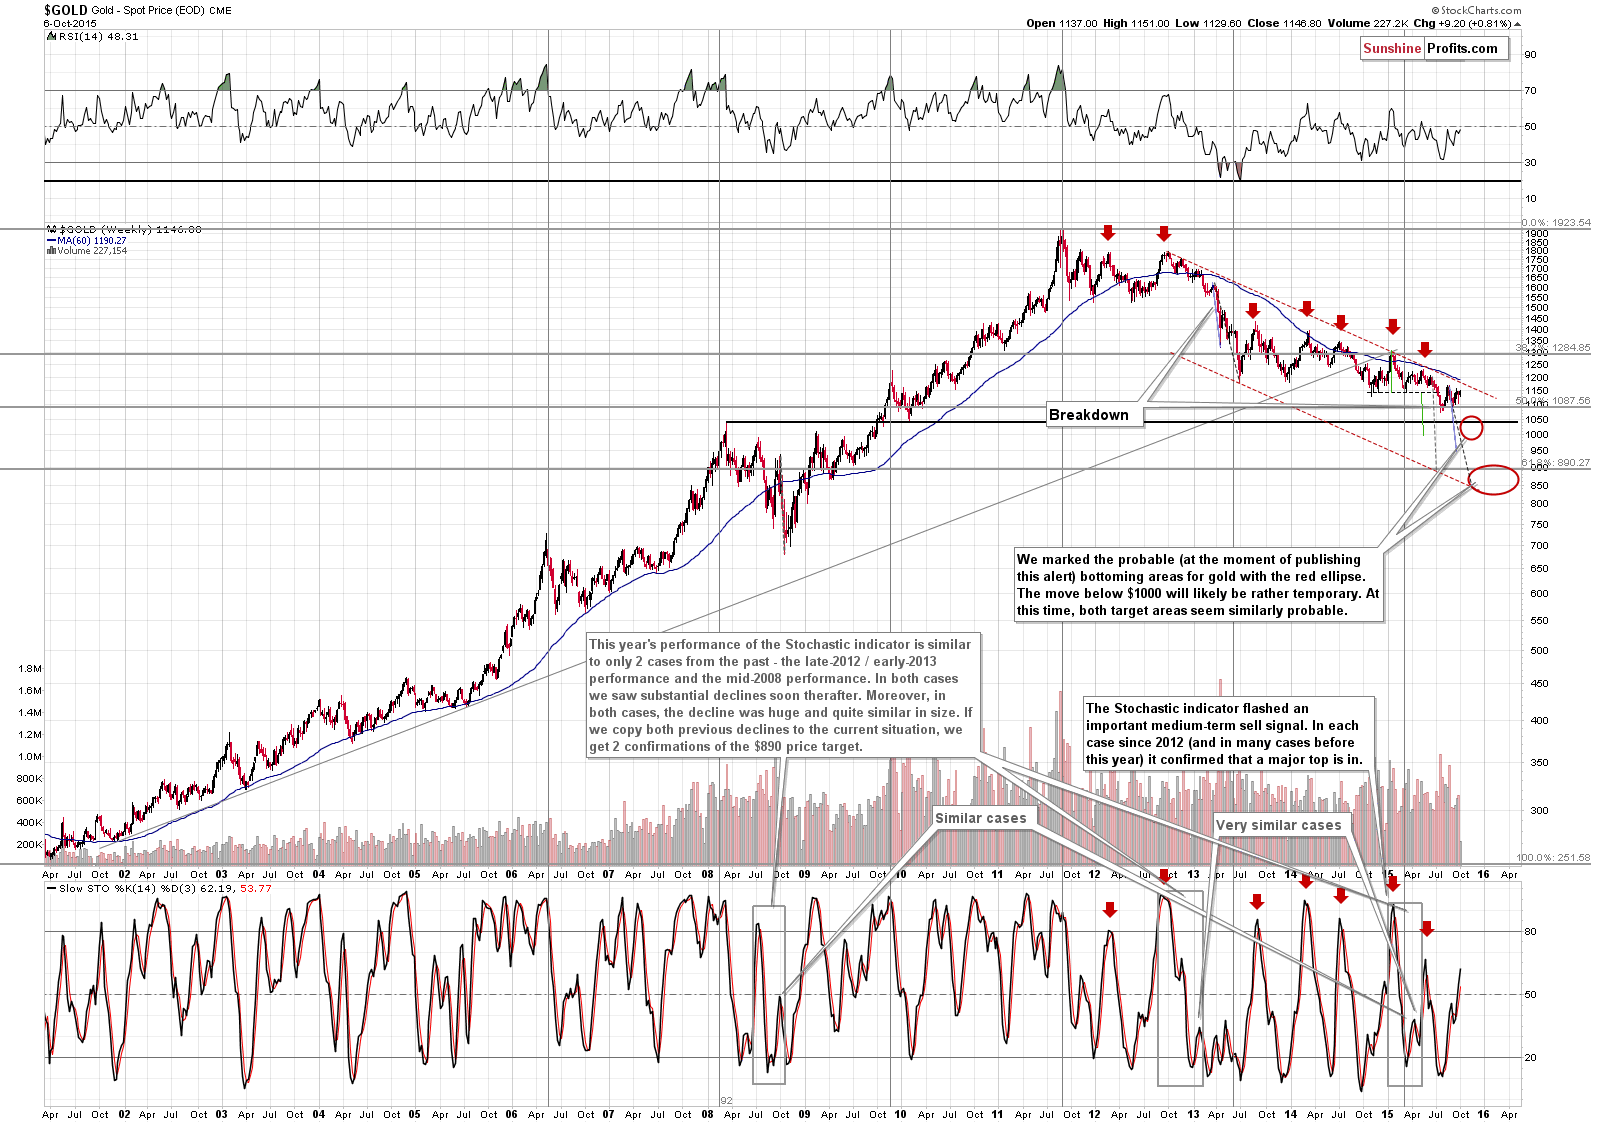
Gold declined $7.90 last week. Most of the initial decline was corrected, but still, gold closed the week $7.90 lower than it had on the previous Friday. The decline continues and the medium-term downtrend remains in place.
Please note that even if gold moves higher from here, it will remain in a major, medium-term downtrend, even if it moves to $1,200 or so. Of course, if such a short-term move becomes likely, we will let you know – it’s not likely, but we just want to put big emphasis on the fact that we are not even close to the breakout that would make the medium-term picture bullish.
In yesterday’s alert we commented on the above chart in the following way:
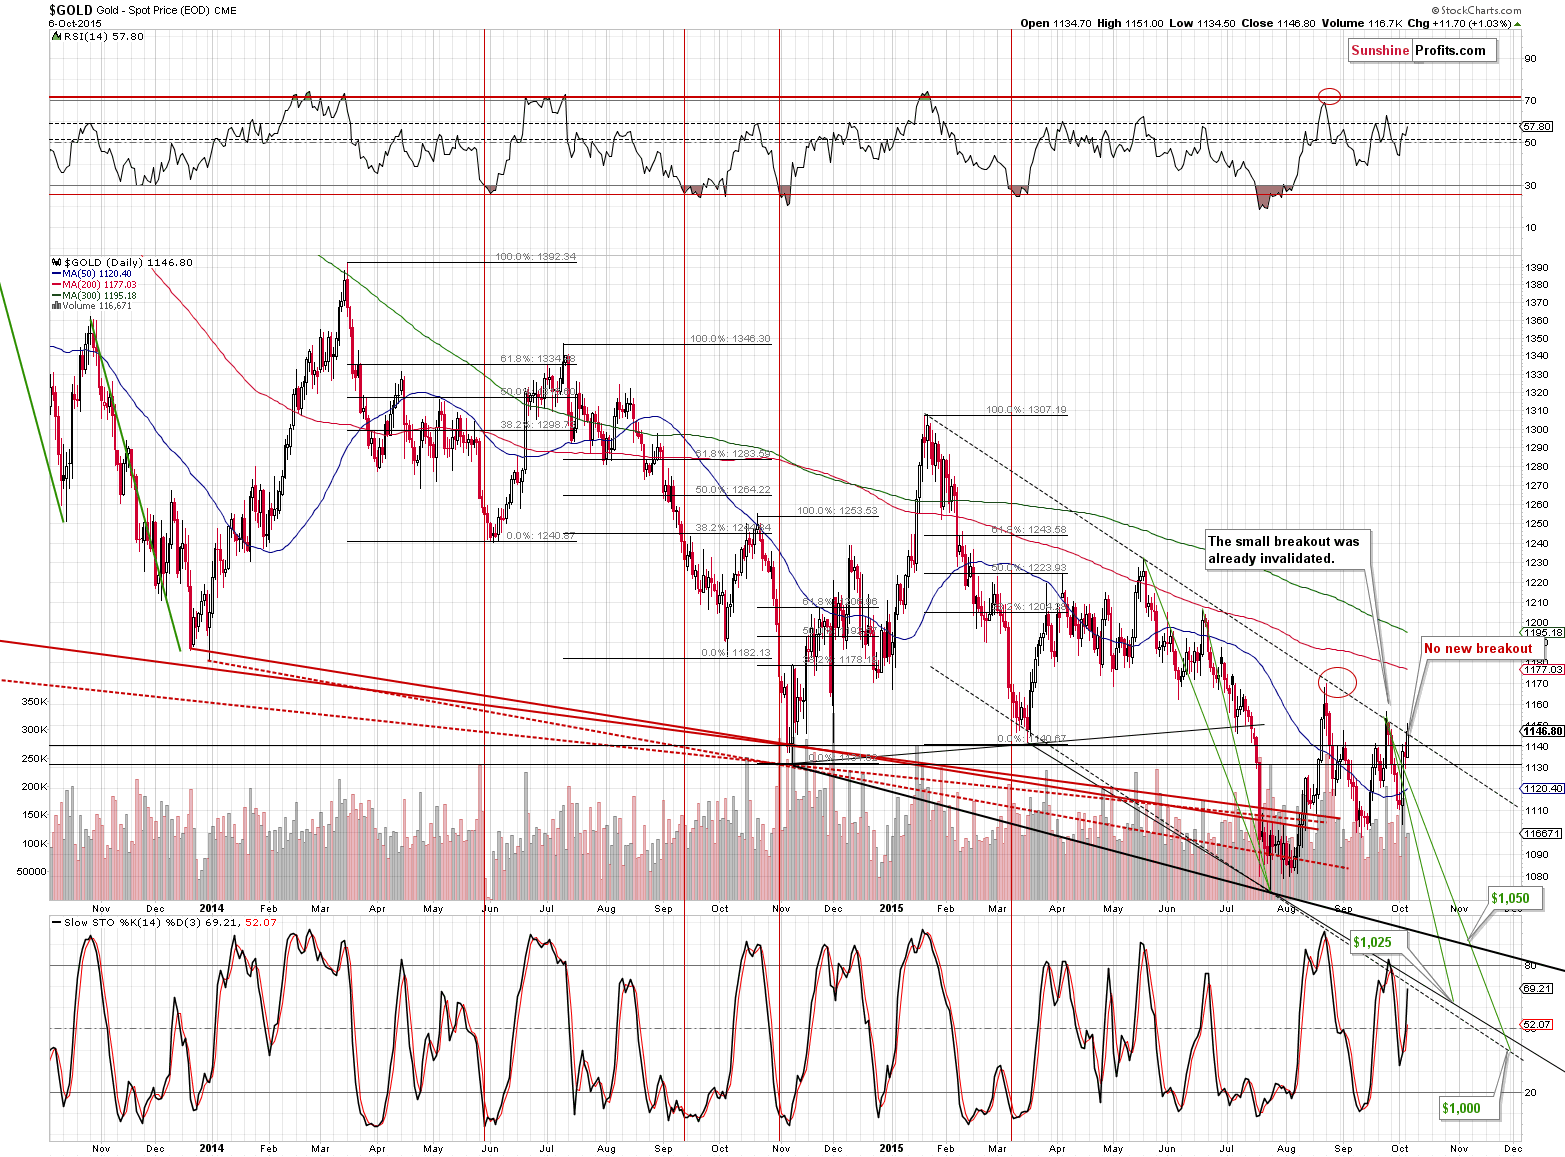
Earlier today we wrote that the medium-term trend in gold would remain bearish even if it moved to $1,200 or so. The above chart shows that it’s not likely that such move would be seen – gold didn’t move above the declining short-term resistance line and the short-term trend remains bearish.
Gold closed more or less at the declining resistance line – it was reached but there was no breakout, let alone a confirmed breakout. The short-term trend still remains down.
In yesterday’s alert we wrote the following about silver:
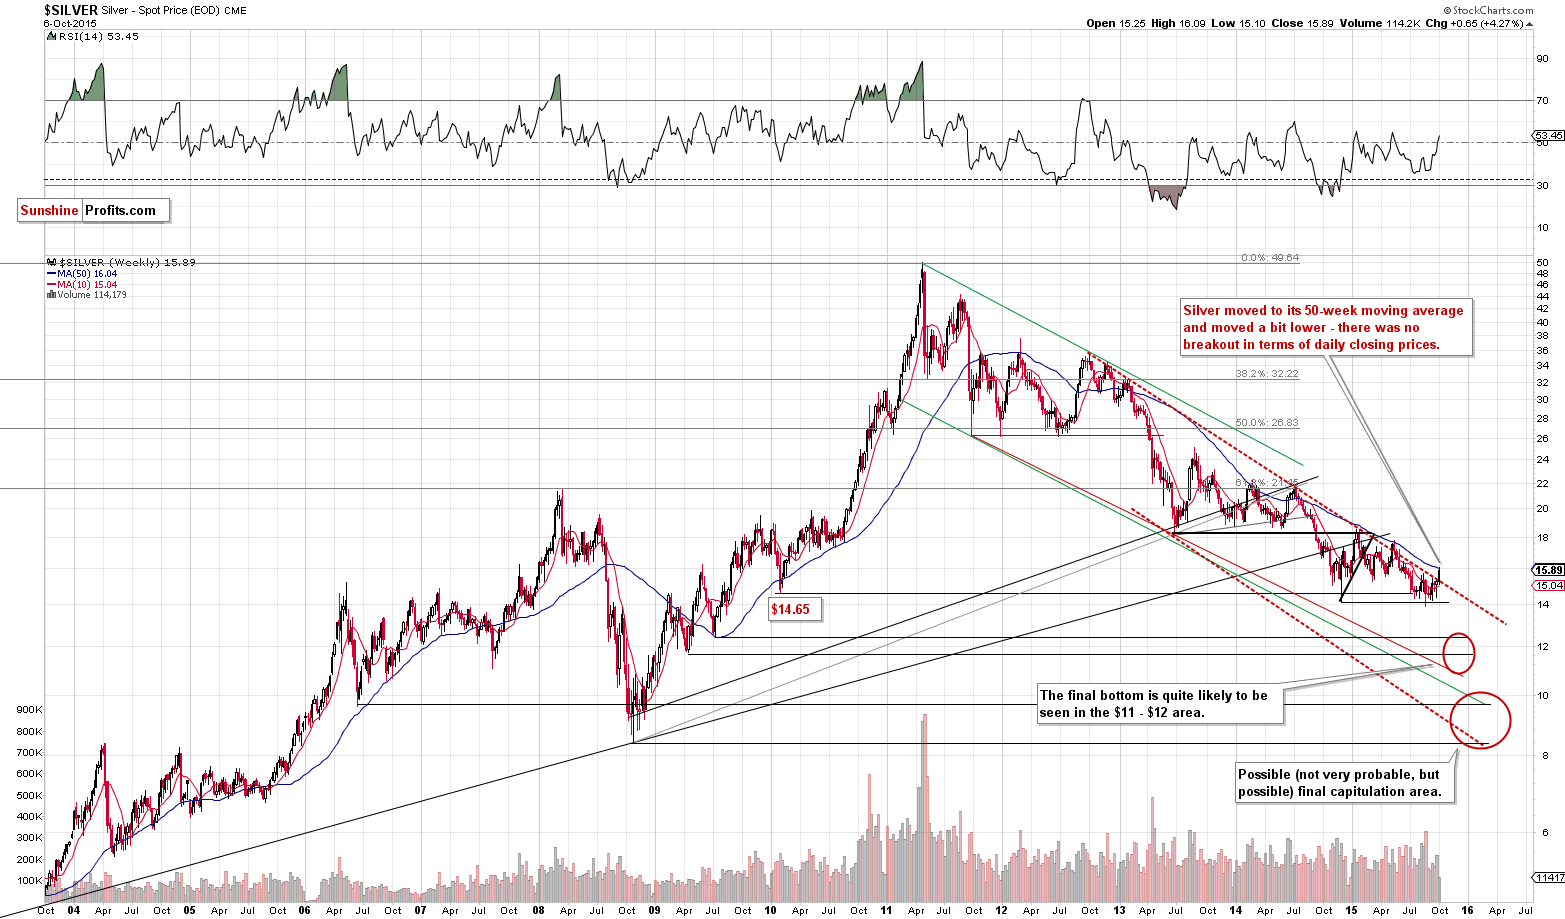
Silver has indeed moved above the declining red resistance line, and while it may seem bullish, it really isn’t. The 50-week moving average serves as strong resistance and even a small, temporary move above it would not make the picture bullish without some kind of bullish confirmations. Again, we are not even close to seeing a technical development that would mean a change in the medium-term trend.
Silver moved to the 50-week moving average (actually, a few cents above it) and declined once again. Is the rally over? It could be the case, or we could see another attempt to move above this resistance line.
What about silver’s relative (out)performance?
In yesterday’s alert, we wrote the following:
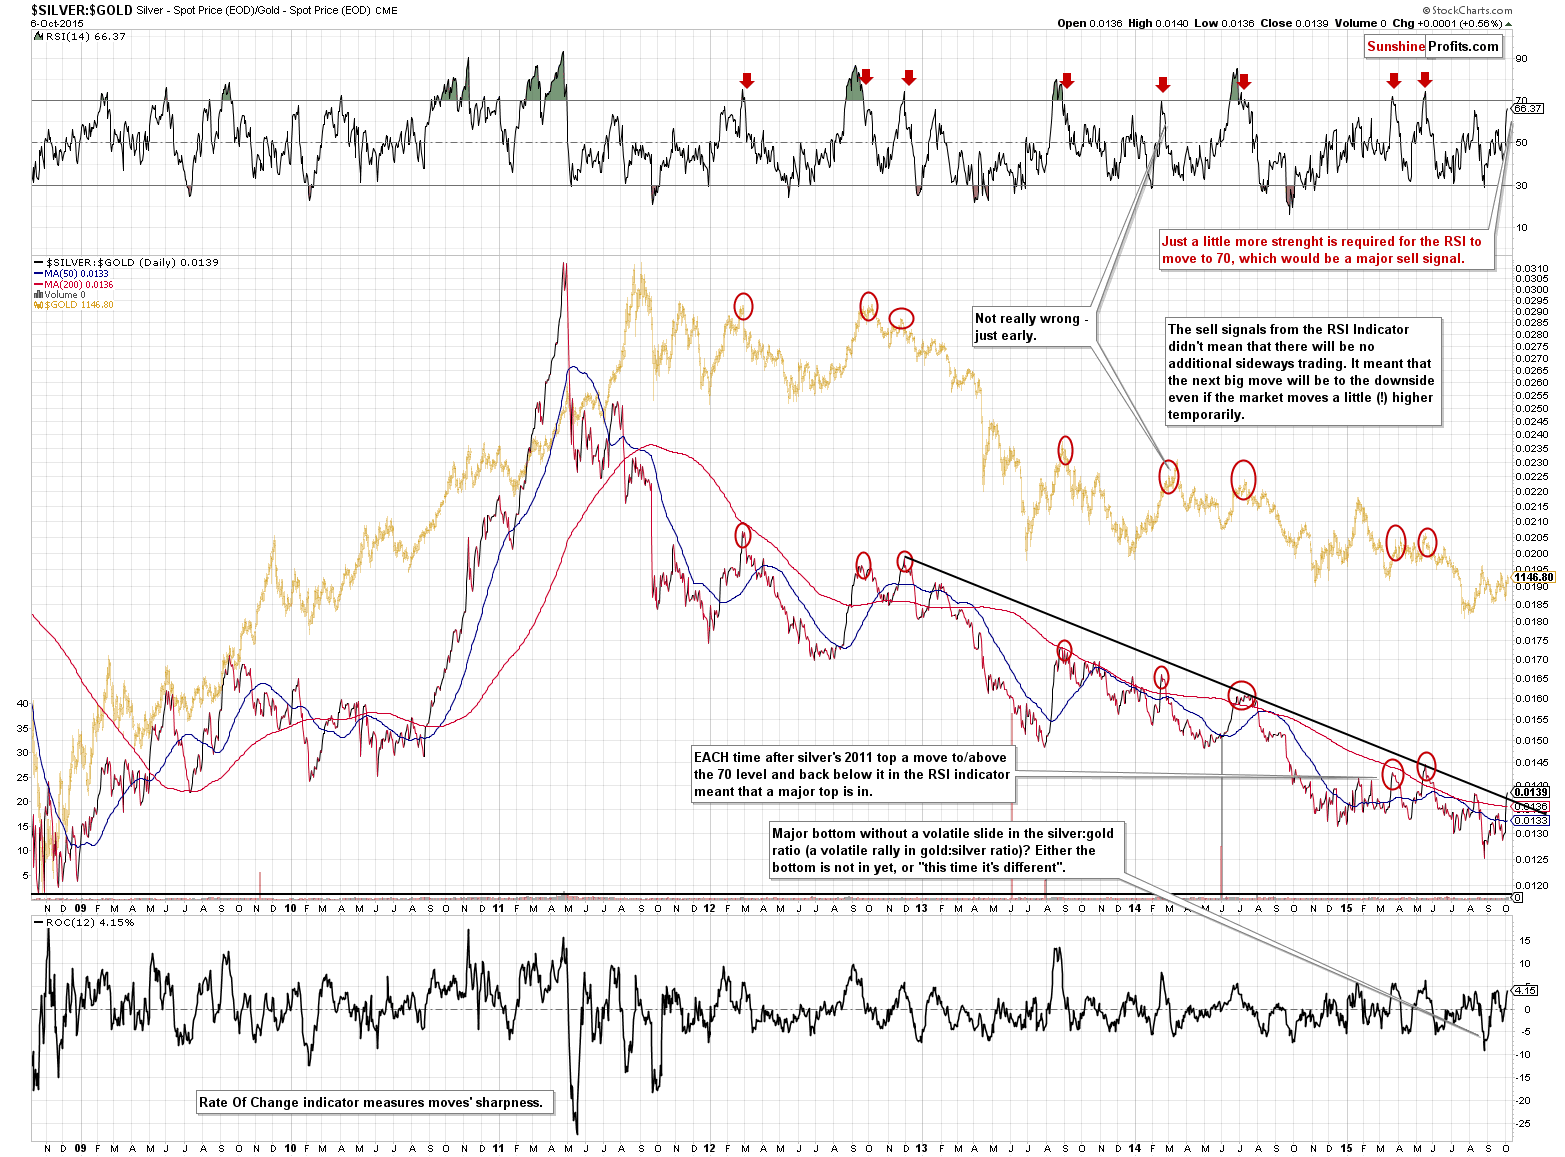
The silver to gold ratio doesn’t indicate a change in the medium-term trend. It moved to its declining resistance line and the last time it moved to it, a local top was in.
Moreover, if the silver to gold ratio moves a bit higher, it will also push the RSI based on the ratio higher. At this time the RSI is at 65 and practically each time the RSI moved above 70 and reversed an important local top was in. Consequently, the medium-term trend remains down and the prices could slide right away or after some additional short-term strength.
The ratio indeed moved a bit higher – to 66.37, however, if we look at the intra-day high of silver, it was even higher. Is the local top in? It could be, but we could still see some temporary strength before the next major slide.
As far as the HUI Index is concerned, we wrote the following yesterday:
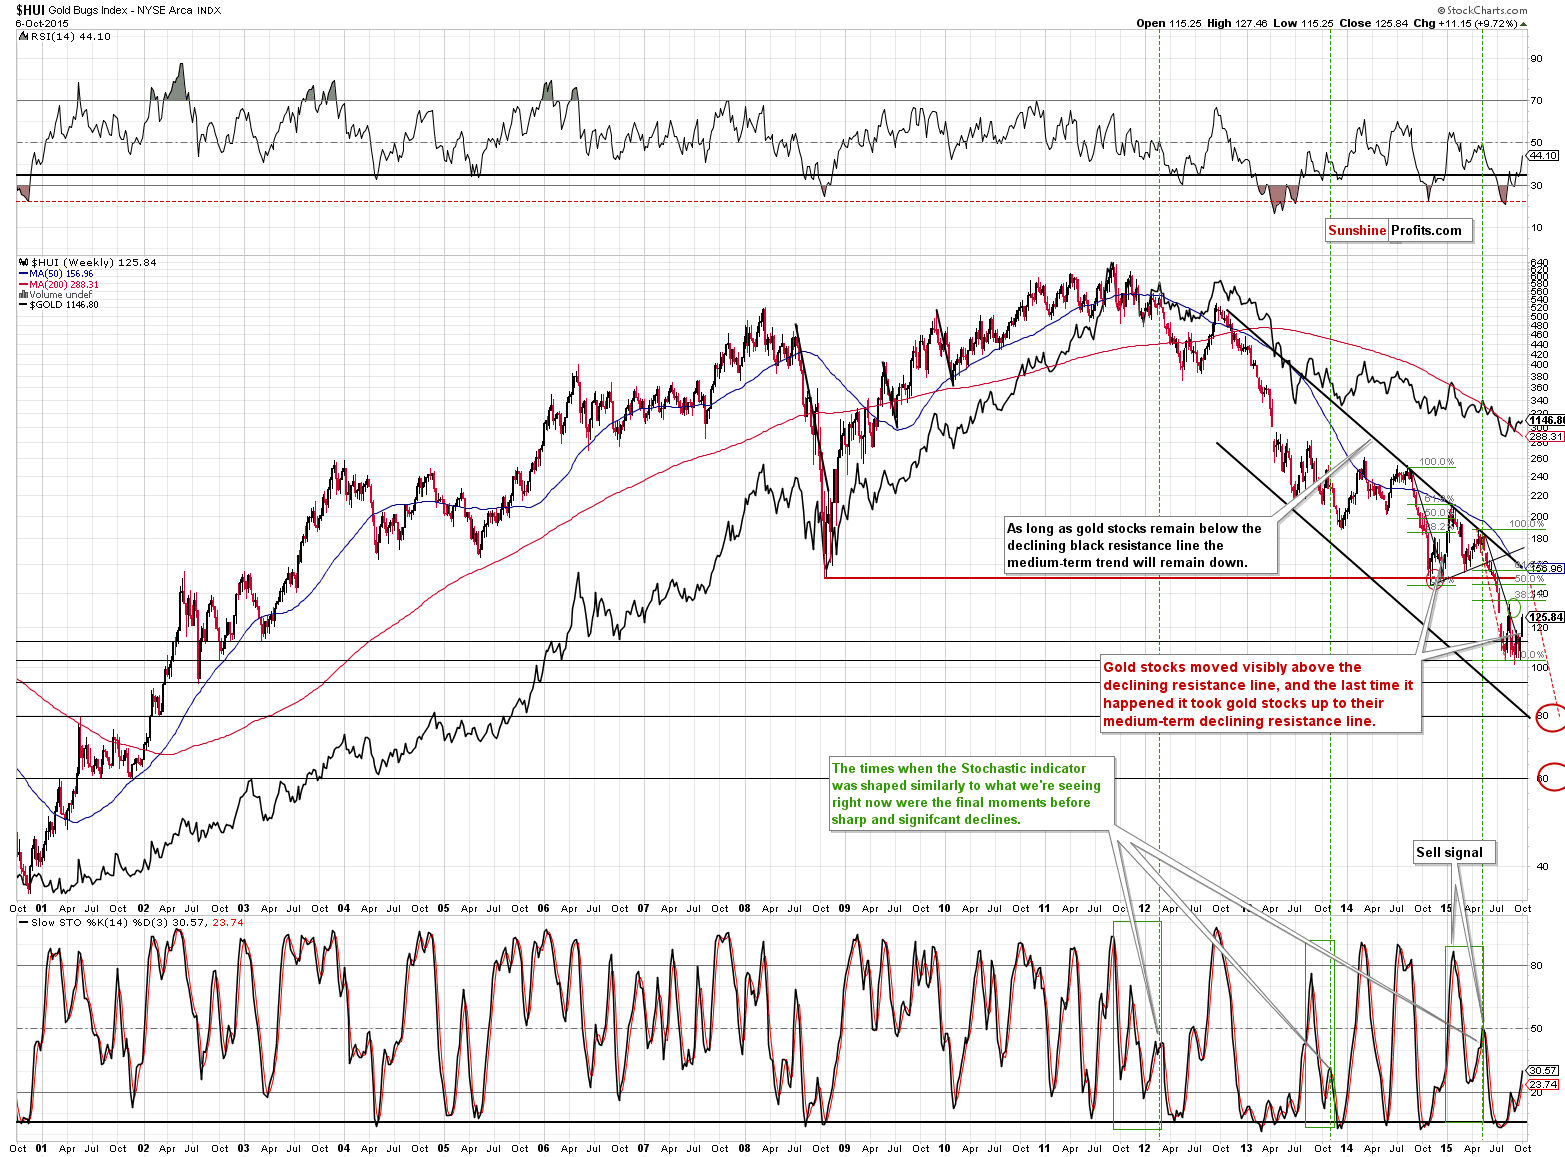
Meanwhile, on the HUI Index chart we can see that the decline in gold stocks simply continues. Gold miners are still relatively close to their 2003 low, but we can see short-term strength even from this perspective.
This year’s big decline is somewhat similar to the late-2014 decline – both declines were similar in size and both initially corrected to their declining resistance line and more or less to the 38.2% Fibonacci retracement level only to decline back to their previous lows.
If this self-similarity is to continue, the HUI Index could move higher, up to 156 and… still remain (!) in a medium-term downtrend. Consequently, this analogy doesn’t really have important medium- or long-term implications. It does, however, have bullish short-term implications as a 30+ index point move is significant from the day-to-day perspective. Will gold stocks really rally up to 156 or so? The very important thing here is that this is not a precise prediction – the more distant target we have in the case of a self-similar pattern, the less precise it becomes. The self-similar pattern doesn’t have to work very precisely, it can be in place but only to a more-or-less extent. For instance, we could see a move to the August high, just like it was the case in silver, or we could see a reversal right away (after all, we already saw some strength after the second local bottom).
Speaking of analogous patterns, if we look at the RSI in order to see what past situations were similar to what we have today, we’ll see that in the last decade there was only one time when the RSI was below 20 – after which it moved back above 40 – in 2012. Given this analogy, we are in a similar situation to what we saw in the middle of 2012. Back then, when the RSI was close to 40, a local top was very close (in fact, prices higher than the ones at that top have not been seen up to this day). Back in 2012, the HUI topped at its previous local high, which at this time would imply a move to 130 or so.
The HUI Index moved to 127.46 yesterday, which is very close to 130. Is the local top in? Perhaps, but we could see some more strength in the very short term. We would like to see more sell signs and bearish confirmations before moving back on the short side with the mining stocks.
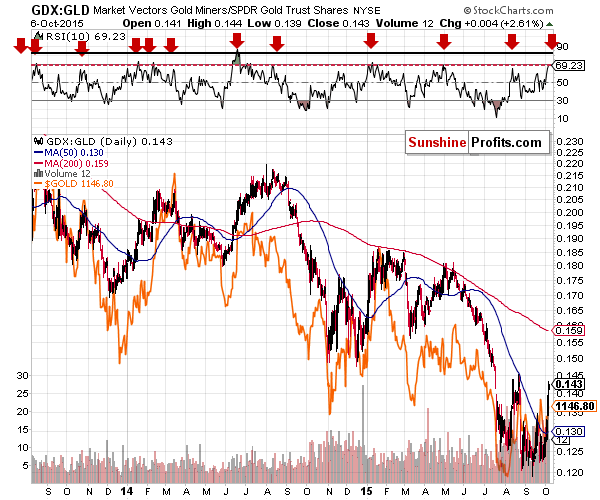
Speaking of bearish signs, the RSI indicator based on the GDX to GLD ratio (miners vs. gold) moved very close to the 70 level and this meant that a local top was in or at hand multiple times in the past months and years. This signal was quite reliable, so it’s important to keep it in mind.
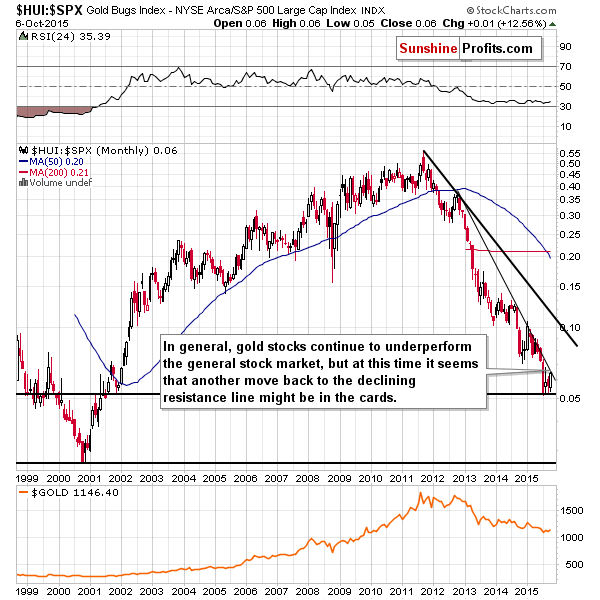
Performance of gold stocks relative to other stocks also suggests that the end of the rally is likely at hand. The HUI to S&P 500 ratio moved to the declining resistance line without breaking it. Consequently, we are likely to see another downleg sooner rather than later.
Before summarizing, we would like to once again quote our recent comments on the stock market and the USD Index, as they remain up-to-date and important in light of yesterday’s and previous days’ developments:
Was there a good reason for silver and mining stocks to rally – one outside of the precious metals realm? Yes – the general stock market rallied (by the way, Paul entered long positions on Sep. 29). Silver tends to move in tune with stocks at times due to its multiple industrial uses and mining stocks are… well, stocks and also tend to move in tune with the general stock market at times. Consequently, the mining stocks’ rally is not necessarily bullish – it doesn’t show or prove the strength of the precious metals sector.
There was also a very good reason for the precious metals sector to rally in the form of the initial (early in the session) decline in the USD Index. The index plunged and investors seem to have overreacted assuming that the decline would continue. The opposite happened – the USD Index reversed and its outlook actually improved based on this action. The reason is the cyclical turning point – the USD Index declined and reversed exactly at it. With this action behind us, it seems that the rally in the USD Index can continue. This is likely to have a negative impact on the precious metals sector. As you may recall, precious metals market tends to react particularly well to the USD’s breakouts. Consequently, once the USD rallies above the previous highs, the impact on the precious metals sector is likely to intensify.
The above tells us that based on the outlook for the USD Index, a bet on higher precious metals or mining stock prices would be risky, however, the positive outlook for the general stock market suggests that if we indeed are to see some more strength in the short term, then it will likely be silver and mining stocks that will be most affected. Of the above, the outlook for silver is less bullish because of the proximity to the 50-week moving average and the August high (which was just reached). Moreover, the important thing is that when silver reverses, it can plunge very far, very fast (intraday), so waiting on the sidelines could result in missing out on a big part of the move. This leaves us with the mining stocks that currently have a relatively good chance (60% or so) of moving visibly higher in the short term. How high could they go? The HUI Index could move to between 130 and 156 and it would not invalidate the medium-term trend, but would likely have a very negative impact on the short-term speculative short position.
Summing up, while it continues to seem justified from the risk/reward perspective to wait out any temporary strength in gold and silver, it seems no positions are justified in the case of the mining stocks due to the bullish outlook for the general stock market.
Consequently, while we are not going long, we do think that staying on the sidelines in the case of the trading capital dedicated to the mining stocks, while keeping the existing short positions in gold and silver, is currently justified from the long-term perspective. Despite this rather long consolidation, it seems that the next big move will be to the downside and that significant profits will be made thanks to this move – likely higher than the ones from the previous trade and perhaps just as big (or higher) than from the previous short trade.
As always, we will keep you – our subscribers – updated.
To summarize:
Trading capital (our opinion): Short position (full) position in gold and silver (but not one in the mining stocks) is justified from the risk/reward perspective with the following stop-loss orders and initial (! – this means that reaching them doesn’t automatically close the position) target prices:
- Gold: initial target price: $1,050; stop-loss: $1,213, initial target price for the DGLD ETN: $98.37; stop loss for the DGLD ETN $65.60
- Silver: initial target price: $12.60; stop-loss: $16.73, initial target price for the DSLV ETN: $96.67; stop loss for DSLV ETN $40.28
Long-term capital (our opinion): No positions
Insurance capital (our opinion): Full position
Please note that a full position doesn’t mean using all of the capital for a given trade. You will find details on our thoughts on gold portfolio structuring in the Key Insights section on our website.
As a reminder – “initial target price” means exactly that – an “initial” one, it’s not a price level at which we suggest closing positions. If this becomes the case (like it did in the previous trade) we will refer to these levels as levels of exit orders (exactly as we’ve done previously). Stop-loss levels, however, are naturally not “initial”, but something that, in our opinion, might be entered as an order.
Since it is impossible to synchronize target prices and stop-loss levels for all the ETFs and ETNs with the main markets that we provide these levels for (gold, silver and mining stocks – the GDX ETF), the stop-loss levels and target prices for other ETNs and ETF (among other: UGLD, DGLD, USLV, DSLV, NUGT, DUST, JNUG, JDST) are provided as supplementary, and not as “final”. This means that if a stop-loss or a target level is reached for any of the “additional instruments” (DGLD for instance), but not for the “main instrument” (gold in this case), we will view positions in both gold and DGLD as still open and the stop-loss for DGLD would have to be moved lower. On the other hand, if gold moves to a stop-loss level but DGLD doesn’t, then we will view both positions (in gold and DGLD) as closed. In other words, since it’s not possible to be 100% certain that each related instrument moves to a given level when the underlying instrument does, we can’t provide levels that would be binding. The levels that we do provide are our best estimate of the levels that will correspond to the levels in the underlying assets, but it will be the underlying assets that one will need to focus on regarding the sings pointing to closing a given position or keeping it open. We might adjust the levels in the “additional instruments” without adjusting the levels in the “main instruments”, which will simply mean that we have improved our estimation of these levels, not that we changed our outlook on the markets. We are already working on a tool that would update these levels on a daily basis for the most popular ETFs, ETNs and individual mining stocks.
Our preferred ways to invest in and to trade gold along with the reasoning can be found in the how to buy gold section. Additionally, our preferred ETFs and ETNs can be found in our Gold & Silver ETF Ranking.
As always, we'll keep you - our subscribers - updated should our views on the market change. We will continue to send out Gold & Silver Trading Alerts on each trading day and we will send additional Alerts whenever appropriate.
The trading position presented above is the netted version of positions based on subjective signals (opinion) from your Editor, and the Tools and Indicators.
As a reminder, Gold & Silver Trading Alerts are posted before or on each trading day (we usually post them before the opening bell, but we don't promise doing that each day). If there's anything urgent, we will send you an additional small alert before posting the main one.
=====
Latest Free Trading Alerts:
We move to the Antipodes, as the Reserve Bank of New Zealand lowered rates again at the September meeting. Is the recession possible in New Zealand? How could it affect the global economy and the gold market?
Is New Zealand Heading for Recession?
=====
Hand-picked precious-metals-related links:
China may have boosted gold reserves 0.9% last month, data show
=====
In other news:
Will the Bank of England Ever Raise Rates?
BoJ keeps policy steady, more easing still seen at end of month
Chinese money flows into US housing
Why the worst commodity collapse in a generation is nowhere near hitting bottom yet
Even top juniors are running out of money
=====
Thank you.
Sincerely,
Przemyslaw Radomski, CFA
Founder, Editor-in-chief
Gold & Silver Trading Alerts
Forex Trading Alerts
Oil Investment Updates
Oil Trading Alerts

