

Briefly: In our opinion, long (full) speculative positions in gold, silver and mining stocks are justified from the risk/reward point of view.
Yesterday was not the next day during which the precious metals sector moved higher. Silver seems to have paused, but mining stocks declined more visibly. Was the rally just a corrective upswing and is it already over?
It likely is a corrective upswing within a bigger decline, but we don’t think that it’s over just yet. It’s true that in the case of mining stocks, the decline was most significant, but it didn’t erase more than 38.2% of the previous rally, so it’s not really meaningful. Let’s take a look at the charts (charts courtesy of http://stockcharts.com).
Let’s start by saying that most of our yesterday’s comments on gold remain up-to-date:
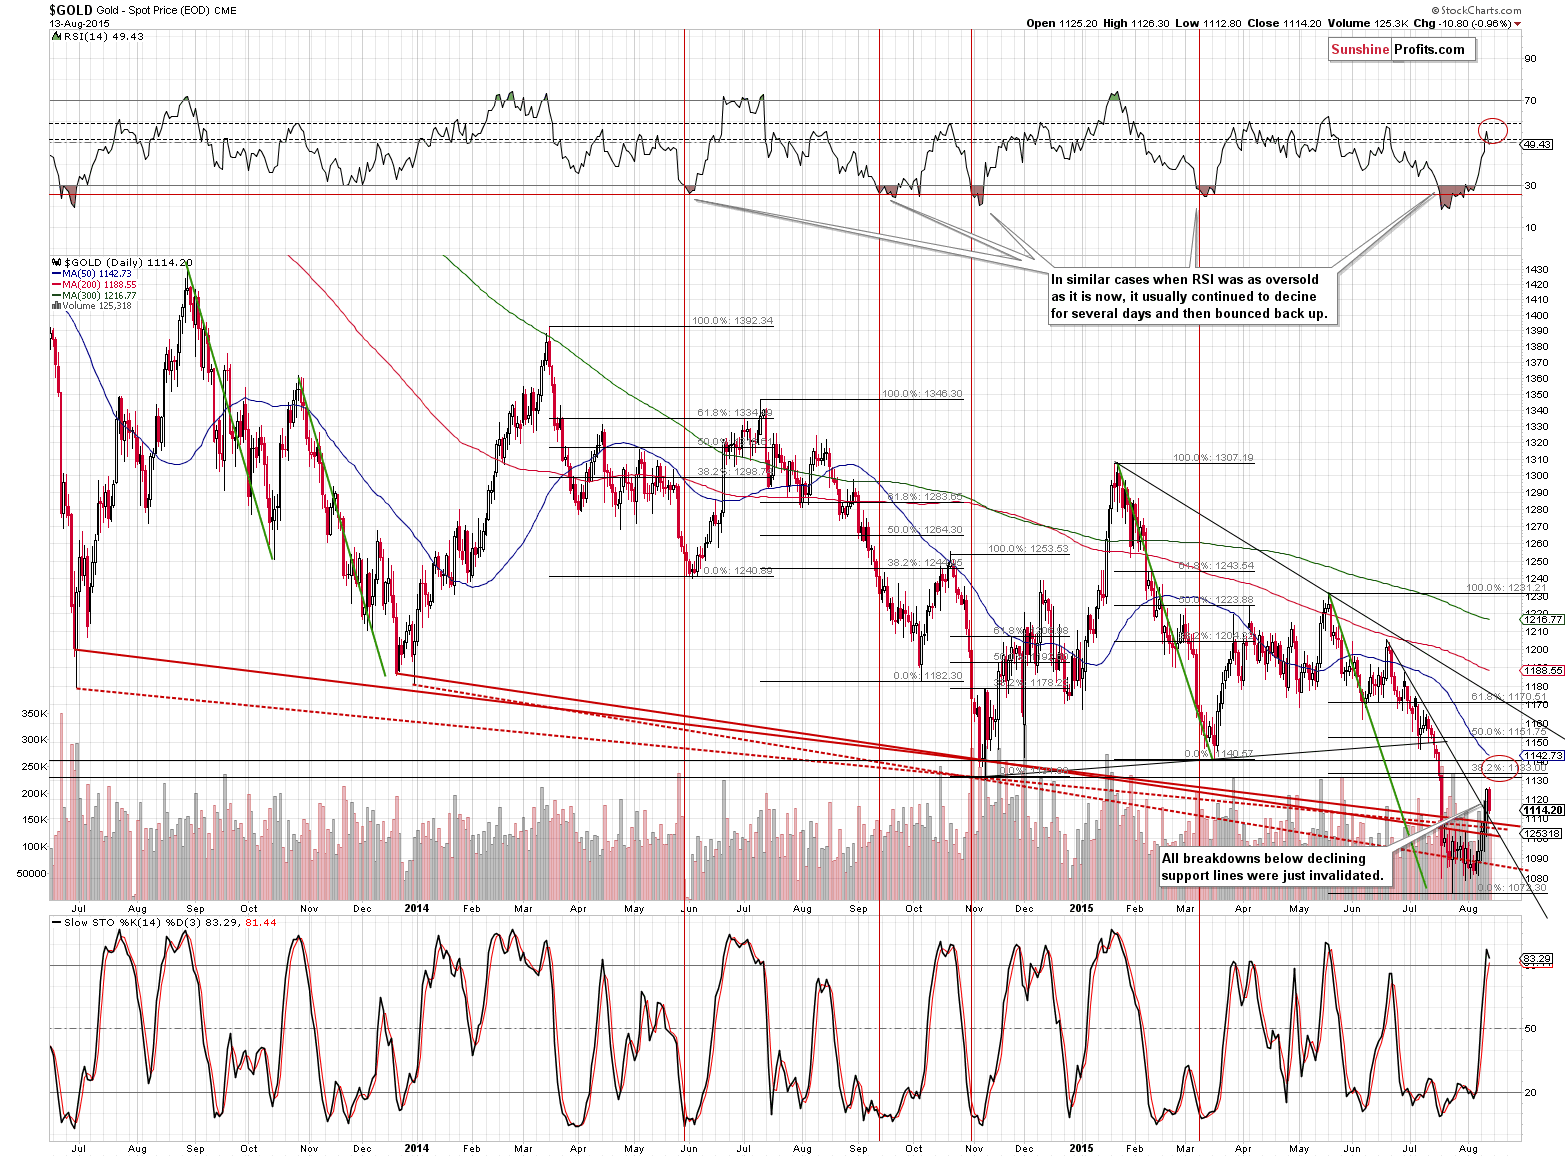
Gold rallied quite visibly yesterday and it finally closed below the July 20 close – something that they yellow metal didn’t manage to do since that day. (…)
Another thing that has bullish implications (but not extremely bullish) is the RSI indicator. As you can see in the upper part of the above chart, when the RSI (and gold) moved higher from oversold levels, the rally very often took place until RSI moved to the 50 - 60 range (marked with dashed lines on the above chart). This tells us that gold is likely to move somewhat higher but not significantly (at least that’s not what we can infer from the previous oversold situations).
Considering how low the RSI was, where it is today, and how high it could go, and translating it to where gold was and currently is gives us a very rough estimation of $1,125 – 1,145 as a target price. Naturally, the RSI alone is not enough to provide a reliable target price or area.
However, if we apply other analogies, we also end up with more or less the same target area.
The 50-day moving average is currently at $1,147.15, but given the pace at which it has been declining, it seems likely that it could meet gold right in the mentioned target area.
Moreover, this area includes the Nov. 2014 low, which was a major support and now serves as a major resistance.
Finally, if we consider the sizes of corrective upswings after situations when the RSI was similarly oversold as it has been recently, we see that gold usually corrected between 38.2% and 61.8% of the preceding decline (or close to these levels). The mentioned area is mostly within the 38.2% - 61.8% range, which serves as another confirmation that this target area is likely to include the next local top.
The RSI indicator moved above the 50 level, but gold didn’t move to our target area. The implication is simply that gold might have not rallied enough.
In fact, gold rallied on huge volume and broke above the short-term declining resistance line, which is a bullish factor for the short term.
The important thing is that yesterday’s decline didn’t take gold back below the previously broken declining support/resistance line. Without the breakout’s invalidation, the bullish implications remain in place. In other words, yesterday’s decline didn’t change anything and the short-term outlook remains bullish.
Will the top be within our target area? Well, the only true answer is that “nobody knows”, but taking into account the past patterns allows us to say that it’s likely, but not imminent. We can’t rule out a move even higher (on a short-term basis), but if / once gold moves above our target area it will mean that the most likely / profitable part of the move higher is over. The following part is something that could take place, but it’s not certain enough to be worth betting on.
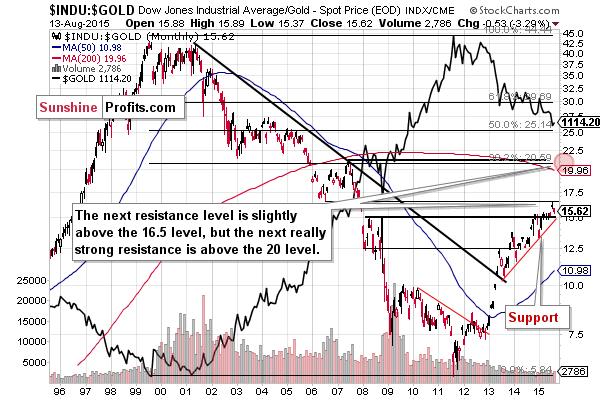
The Dow to gold ratio shows that there is a correction underway, but nothing more bearish. There was no breakdown below the previously broken 15 level, so the medium-term outlook remains bullish for the ratio and bearish for gold. However, the previously broken resistance has not been reached yet, so the ratio could drop a little more before reversing (and gold could rally some more before reversing).
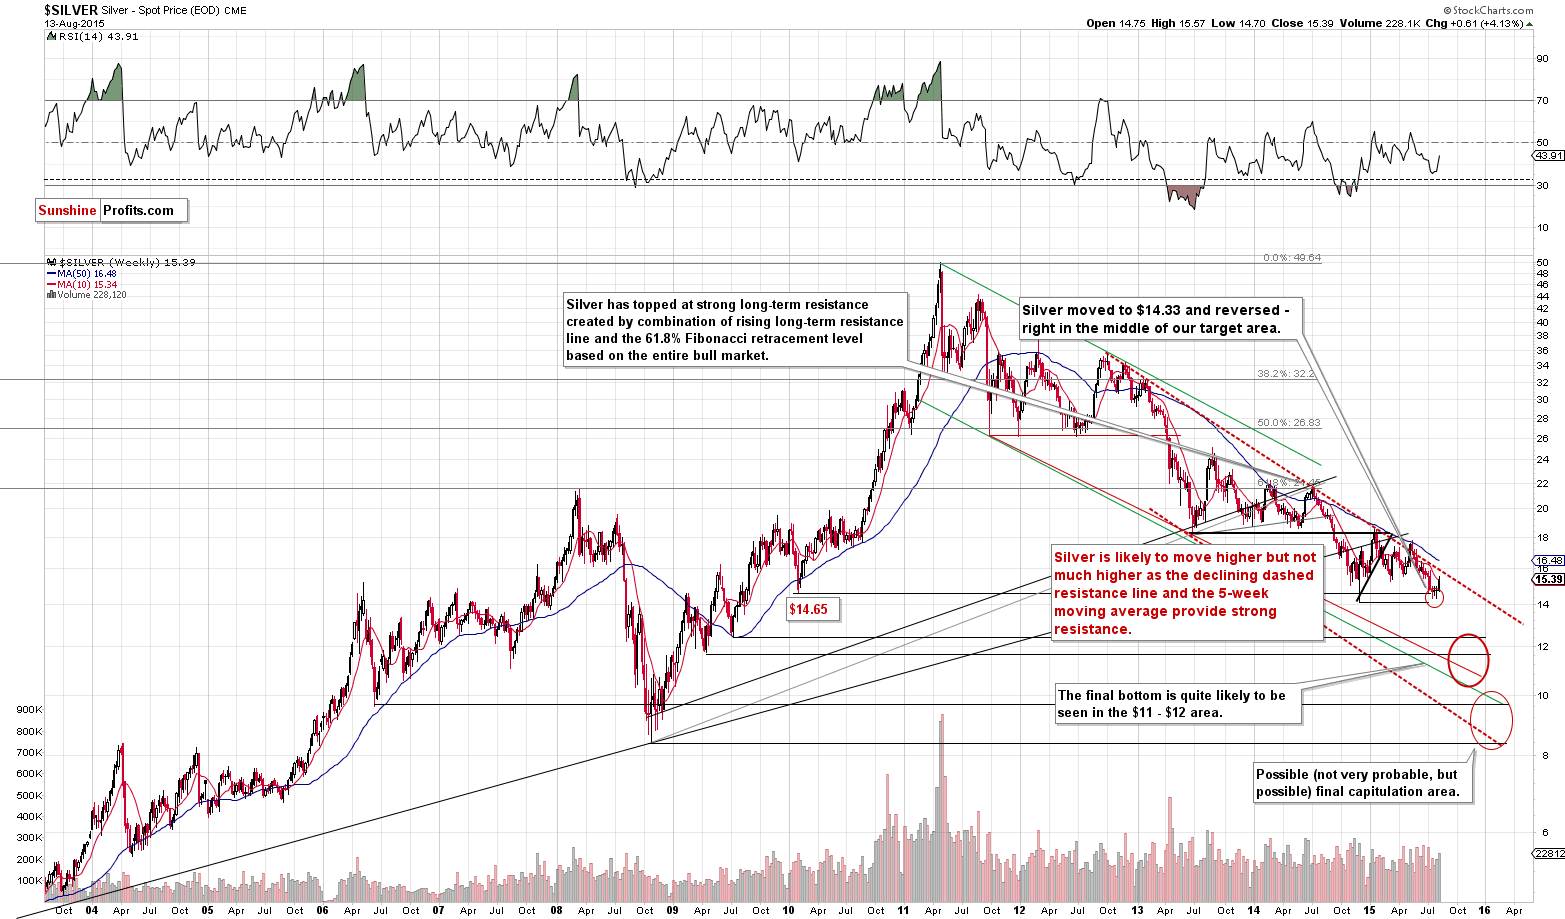
Silver has moved higher this week and yesterday’s 11 cent decline didn’t change anything. Our previous comments remain up-to-date:
There is significant long-term resistance relatively close to where silver currently is. The declining dashed resistance line and the 50-week moving average provide resistance close to the $16 level. It’s unclear whether silver’s next local top is more likely to take place a bit below or above this level, but it seems likely that we will get confirmation from another market (gold or mining stocks) once silver moves close to this area.
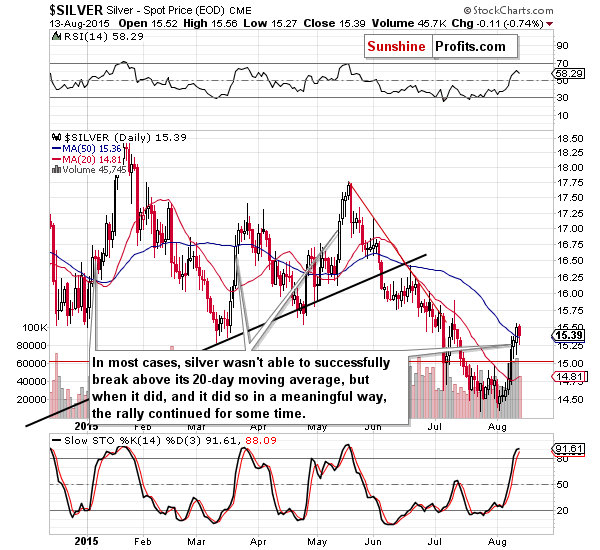
On the short-term chart, we can see that silver’s decline and ability to hold close to the previous levels is likely related to the fact that it moved above its 50-day moving average. Silver broke above this average and refused to close back below it. Plus, the daily decline took place on volume that was visibly lower than what we had seen the previous day. The implications are bullish.
We commented on the above chart in the following way yesterday:
The situation improved once again yesterday. In fact, the early corrective intra-day decline served as a very small consolidation and it made the subsequent gains more probable. The short-term outlook remains bullish and our target area remains up-to-date.
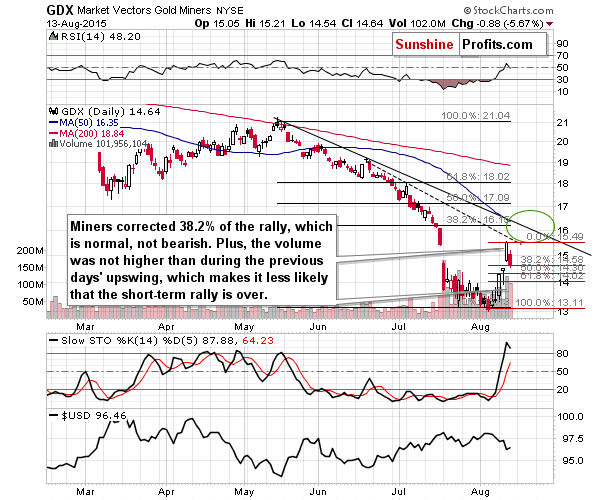
The target area is between the current price and the $17 level. Consequently, mining stocks are likely to move higher, but not much higher. Yesterday’s rally on strong volume clearly supports higher prices, so we wouldn’t be surprised by a move above the $16 level shortly, especially given the strong volume during yesterday’s rally.
Did anything change yesterday based on the miners’ decline? Not really. No market can move up or down without periodic corrections and miners are not an exception to this rule. The decline took place on volume that was lower than what we had seen the previous day (during the daily rally), so there are no bearish signs here. Plus, mining stocks only corrected to the first (38.2%) of the classic Fibonacci retracement levels without breaking lower, so technically, nothing changed. The outlook remains bullish.
So, is this a good time to enter binding profit-take orders for our long position in the precious metal sector? At the first time it seems so, but after a closer examination it turns out that it might not be the case. The outlook is very bullish for the short term, and we can’t rule out the possibility that gold, silver and miners will move to the upper part of our target areas before declining once again. Consequently, we will wait for more bearish signs before taking profits off the table and (possibly) re-entering short positions.
Before summarizing, we would like to discuss why we don’t think that the final bottom is already behind us.
In short, we don’t think that the final bottom is in, because we have not seen enough signs thereof, our technical targets were not met (only the very first one in case of gold and silver) and there is not enough bearishness among precious metals analysts. The list of confirmations that we want to see remains up-to-date (we discussed them in the April 27 alert and if you haven’t had the chance to read it, we invite you to do so today):
Quoting from the mentioned alert (we added comments in CAPITAL LETTERS):
Consequently, we’ll be looking for signals that indicate extreme bearishness:
- Silver declining extremely sharply – greatly underperforming gold (the last parts of a given move are quite often more volatile in the case of silver than in the case of gold; plus practically all major declines ended with silver’s sharp underperformance) - NOT PRESENT
- Headlines in major financial portals like finance.yahoo.com about gold’s extremely bearish outlook - SOMEWHAT PRESENT, BUT NOT EXTREME
- Gold and silver’s medium-term decline is once again evident in terms of all major currencies - NOT PRESENT
- Silver, HUI and XAU indices, HUI to gold ratio, XAU to gold ratio, HUI to S&P 500 ratio all (or almost all of them) move to major support levels - PRESENT
- A lot of hate mail in our e-mail inbox from readers that will be holding precious metals at that time (given that we are bearish at that time and it is known publicly) - NOT PRESENT
- USD Index at a major resistance level - SOMEWHAT PRESENT
- We would like to see the gold stocks to gold ratio plunge (as mentioned in point 4) but we would like gold stocks to show strength after a while, thus refusing to follow gold’s declines - THE FIRST PART IS PRESENT, THE SECOND ONE IS NOT
- Websites dedicated to gold freeze for a while when people are so interested in the volatile downswing and keep refreshing these websites for latest prices (did you know that something like that occurred in 2011 right before the final top?) - NOT PRESENT
- We would like our non-investing friends to call us asking what’s going on with gold as they’ve heard that it has declined so badly - SOMEWHAT PRESENT.
Technically speaking, it’s very unlikely that gold broke below the 2-year-long consolidation to decline only several dollars. Plus, gold and miners are not reacting particularly well (taking the last few weeks into account) to bullish events.
Overall, since nothing really changed yesterday, we can summarize today’s alert just as we summarized yesterday’s issue:
Summing up, Summing up, from the medium-term perspective nothing changed in the precious metals market recently as the situation was and still is bearish (we don’t think the final bottom for this decline is in yet), but it seems very likely that we will see a corrective rally before the decline continues (and we continue to think that taking profits off the table and closing our previous short position when silver moved to $14.33 was a good idea).
There are more bullish factors than bearish ones (the bearishness in the mainstream media being the most significant bullish factors) and we believe that it’s currently justified from the risk/reward perspective to keep the full size of the profitable speculative long position in the precious metals sector. It seems quite likely that our profits on this trade will become even bigger.
We will keep you – our subscribers – updated.
To summarize:
Trading capital (our opinion): Long position (full) position in gold, silver and mining stocks is justified from the risk/reward perspective with the following stop-loss orders and initial (! – this means that reaching them doesn’t automatically close the position) target prices:
- Gold: initial target price: $1,135; stop-loss: $1,063, initial target price for the UGLD ETN: $9.44; stop loss for the UGLD ETN $7.69
- Silver: initial target price: $15.90; stop-loss: $14.12, initial target price for the USLV ETN: $16.54; stop loss for USLV ETN $11.51
- Mining stocks (price levels for the GDX ETN): initial target price: $15.87; stop-loss: $12.37, initial target price for the NUGT ETN: $5.17; stop loss for the NUGT ETN $2.46
In case one wants to bet on junior mining stocks' prices (we do not suggest doing so – we think senior mining stocks are more predictable in the case of short-term trades – if one wants to do it anyway, we provide the details), here are the stop-loss details and initial target prices:
- GDXJ: initial target price: $21.78; stop-loss: $17.67
- JNUG: initial target price: $12.01; stop-loss: $6.39
Long-term capital (our opinion): No positions
Insurance capital (our opinion): Full position
Please note that a full position doesn’t mean using all of the capital for a given trade. You will find details on our thoughts on gold portfolio structuring in the Key Insights section on our website.
As a reminder – “initial target price” means exactly that – an “initial” one, it’s not a price level at which we suggest closing positions. If this becomes the case (like it did in the previous trade) we will refer to these levels as levels of exit orders (exactly as we’ve done previously). Stop-loss levels, however, are naturally not “initial”, but something that, in our opinion, might be entered as an order.
Since it is impossible to synchronize target prices and stop-loss levels for all the ETFs and ETNs with the main markets that we provide these levels for (gold, silver and mining stocks – the GDX ETF), the stop-loss levels and target prices for other ETNs and ETF (among other: UGLD, DGLD, USLV, DSLV, NUGT, DUST, JNUG, JDST) are provided as supplementary, and not as “final”. This means that if a stop-loss or a target level is reached for any of the “additional instruments” (DGLD for instance), but not for the “main instrument” (gold in this case), we will view positions in both gold and DGLD as still open and the stop-loss for DGLD would have to be moved lower. On the other hand, if gold moves to a stop-loss level but DGLD doesn’t, then we will view both positions (in gold and DGLD) as closed. In other words, since it’s not possible to be 100% certain that each related instrument moves to a given level when the underlying instrument does, we can’t provide levels that would be binding. The levels that we do provide are our best estimate of the levels that will correspond to the levels in the underlying assets, but it will be the underlying assets that one will need to focus on regarding the sings pointing to closing a given position or keeping it open. We might adjust the levels in the “additional instruments” without adjusting the levels in the “main instruments”, which will simply mean that we have improved our estimation of these levels, not that we changed our outlook on the markets. We are already working on a tool that would update these levels on a daily basis for the most popular ETFs, ETNs and individual mining stocks.
Our preferred ways to invest in and to trade gold along with the reasoning can be found in the how to buy gold section. Additionally, our preferred ETFs and ETNs can be found in our Gold & Silver ETF Ranking.
As always, we'll keep you - our subscribers - updated should our views on the market change. We will continue to send out Gold & Silver Trading Alerts on each trading day and we will send additional Alerts whenever appropriate.
The trading position presented above is the netted version of positions based on subjective signals (opinion) from your Editor, and the Tools and Indicators.
As a reminder, Gold & Silver Trading Alerts are posted before or on each trading day (we usually post them before the opening bell, but we don't promise doing that each day). If there's anything urgent, we will send you an additional small alert before posting the main one.
=====
Latest Free Trading Alerts:
Yesterday, the World Gold Council published a new edition of its quarterly report on gold demand. What does Gold Demand Trends Q2 2015 say about the demand for gold in the second quarter of 2015?
=====
Hand-picked precious-metals-related links:
South Africa faces mining strike double whammy
Gold miners turn to payroll as next wave of cuts if rout deepens
South African Platinum Industry: Where has it all gone wrong?
=====
In other news:
The Greek crisis...in 2 minutes
=====
Thank you.
Sincerely,
Przemyslaw Radomski, CFA
Founder, Editor-in-chief
Gold & Silver Trading Alerts
Forex Trading Alerts
Oil Investment Updates
Oil Trading Alerts

