

Briefly: In our opinion, short (full) speculative positions in gold, silver and mining stocks are justified from the risk/reward point of view.
The key part of the precious metals market – gold – has just closed below its 2014 low (in terms of daily and weekly closing prices), and we didn’t have to wait for long for gold to plunge right after the breakdown. Gold declined to about $1,080 in overnight trading but moved back above $1,100 in a few hours. Was that THE bottom or is the decline likely to accelerate shortly?
Let’s take a look at the charts (charts courtesy of http://stockcharts.com).
On Friday, we wrote the following:
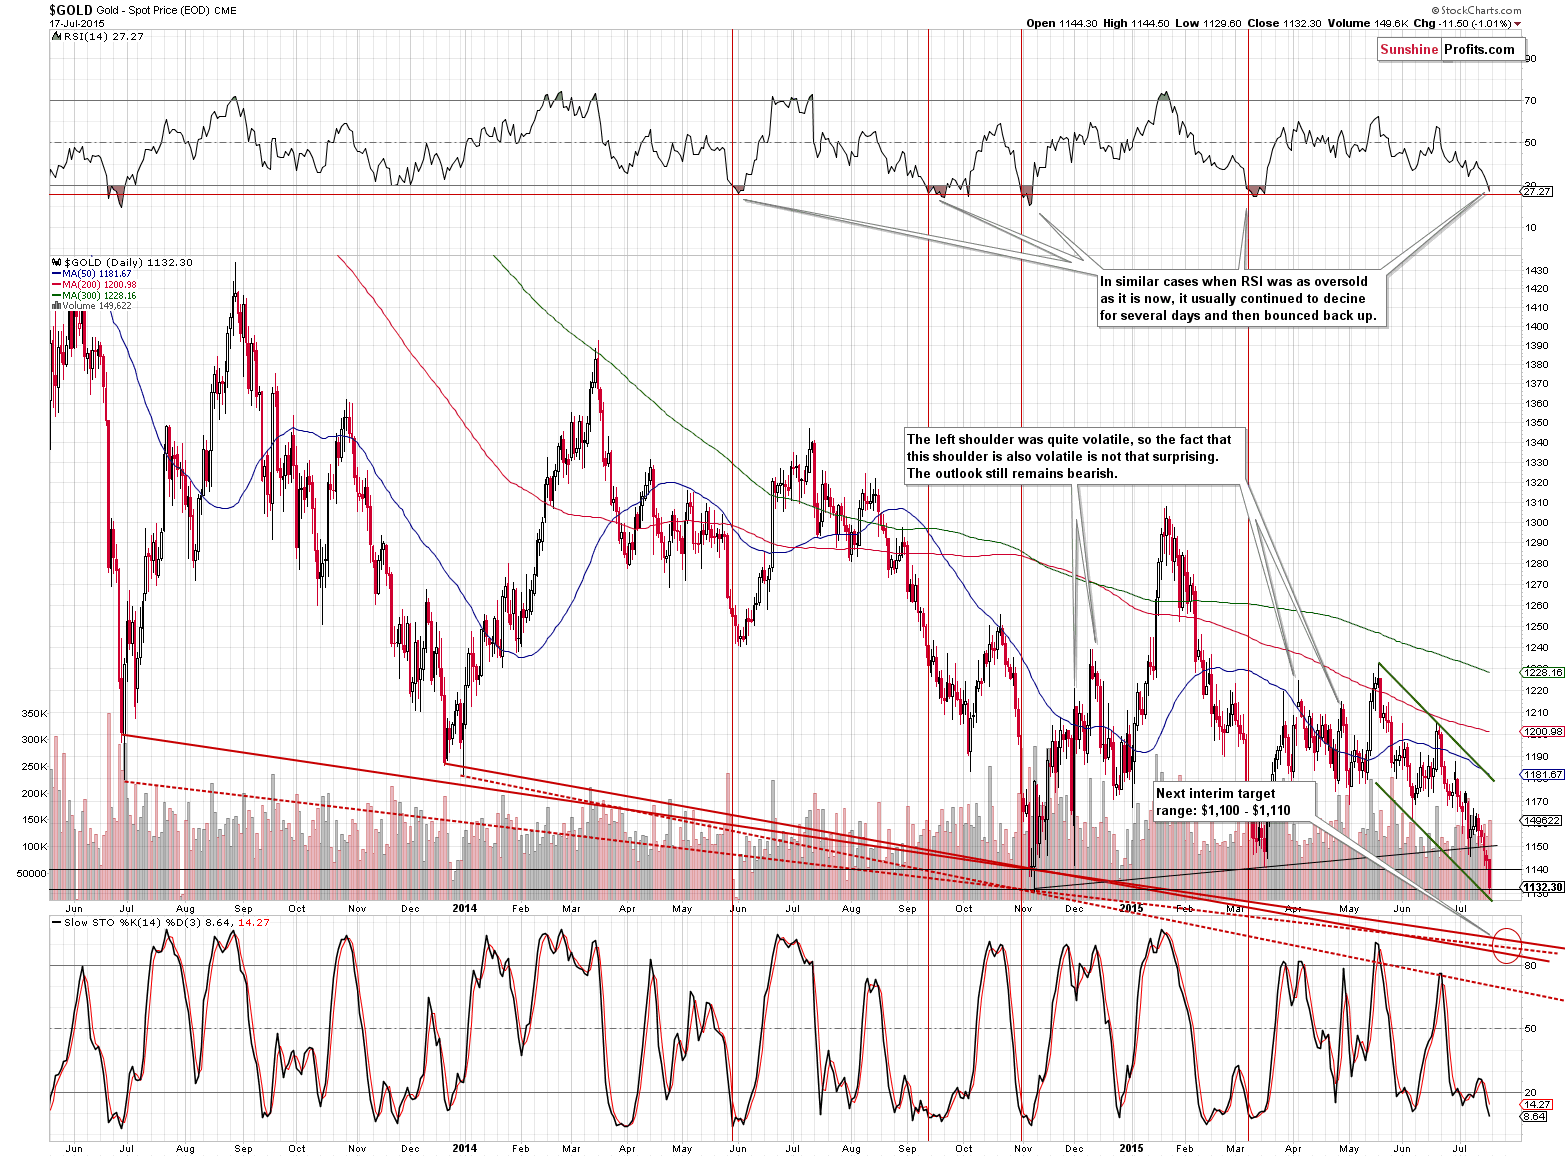
From the daily perspective, the decline simply continues. Gold moved lower in volume that was not low, so the implications are bearish. The downtrend remains in place. The support is relatively close, so it could trigger a counter trend rally, before we see a breakdown, but please note that each corrective upswing that started from these levels was smaller than the previous one. The latest move higher started in March and it took gold to about $1,230. If (!) we see a move higher also this time, then we don’t think that gold would be able to rally above the declining red resistance line (as that’s the closest significant resistance line) - a move back above $1,175 is unlikely to be seen.
How are we going to act when gold moves to the upper part of our target area - $1,130 - $1,135? It depends on volume, on what happens in other markets and on what news we have in the mainstream media when that happens. If we read something that should make gold decline further, but it doesn’t, then it will confirm that a corrective upswing is likely just around the corner. For now, we are not seeing such bullish confirmations (instead, we are seeing a new low in silver), so we are keeping the short position intact.
Gold has indeed moved lower – to the above-mentioned $1,130 - $1,135 range and even temporarily below it on Friday and well below it today. There was a reason for it in the form of the announcement regarding China’s gold reserves. The latter were much lower than many expected them to be and it showed that there was lower interest in purchasing the yellow metal than many had expected. The silver lining is that since there is less metal in the stockpiles, there is less that can be quickly sold, thus suppressing the price. Overall, however, little changed as far as immediate-term implications are concerned. The downtrend remains in place.
NOTE: we wrote the below paragraphs before Monday’s pre-market plunge.
The important change on the above chart is the interim target area, which is now more precise. The situation usually clarifies along the way (which is one of the reasons for which the analysis has to be continuously conducted and the markets need to be monitored) and at this time, it became more likely that gold will be stopped / it will take a breather close to the $1,110 level. Another support level is where gold closed on Friday, but the performance of mining stocks suggests that an important bottom was not formed on Friday (we are not seeing strength of the mining stocks, but exactly the opposite).
The target area is created by previous major bottoms and by taking into account lines that are created based on daily closing prices and those that are based on intra-day lows. Both are useful in case of gold. 3 out of 4 lines provide support in the $1,100 - $1,110 range, which makes them quite likely to generate a corrective upswing. How high would gold move after such a bottom? It’s rather unclear at this time, but our best guesstimate is that it would correct to the $1,130 level or so, thus verifying the breakdown.
NOTE: The following is being written 1 hour before market’s opening.
Gold didn’t just move to $1,100 - $1,110 – it plunged much lower and is now correcting this decline. Gold is trading at about $1,112 at the moment of writing these words. It could (but doesn’t have to) be the case that we saw an invalidation of the breakdown, but even if this is the case, the upside target for the rally (resistance) is quite close - $1,130 - $1,140. Is this rally worth trading? In our opinion it’s not justified from the risk/reward perspective. Gold could plunge once again shortly and the move could be even bigger than what we saw earlier today. As you may recall, the current situation is similar to what happened in April 2013 and if today’s breakdown is similar to the first breakdown in gold from April 2013, then staying short is a very good idea. When gold does indeed correct to the upside, please remember that if we don’t see major bullish confirmations, it will not likely be the final bottom and therefore the move higher will be only temporary.
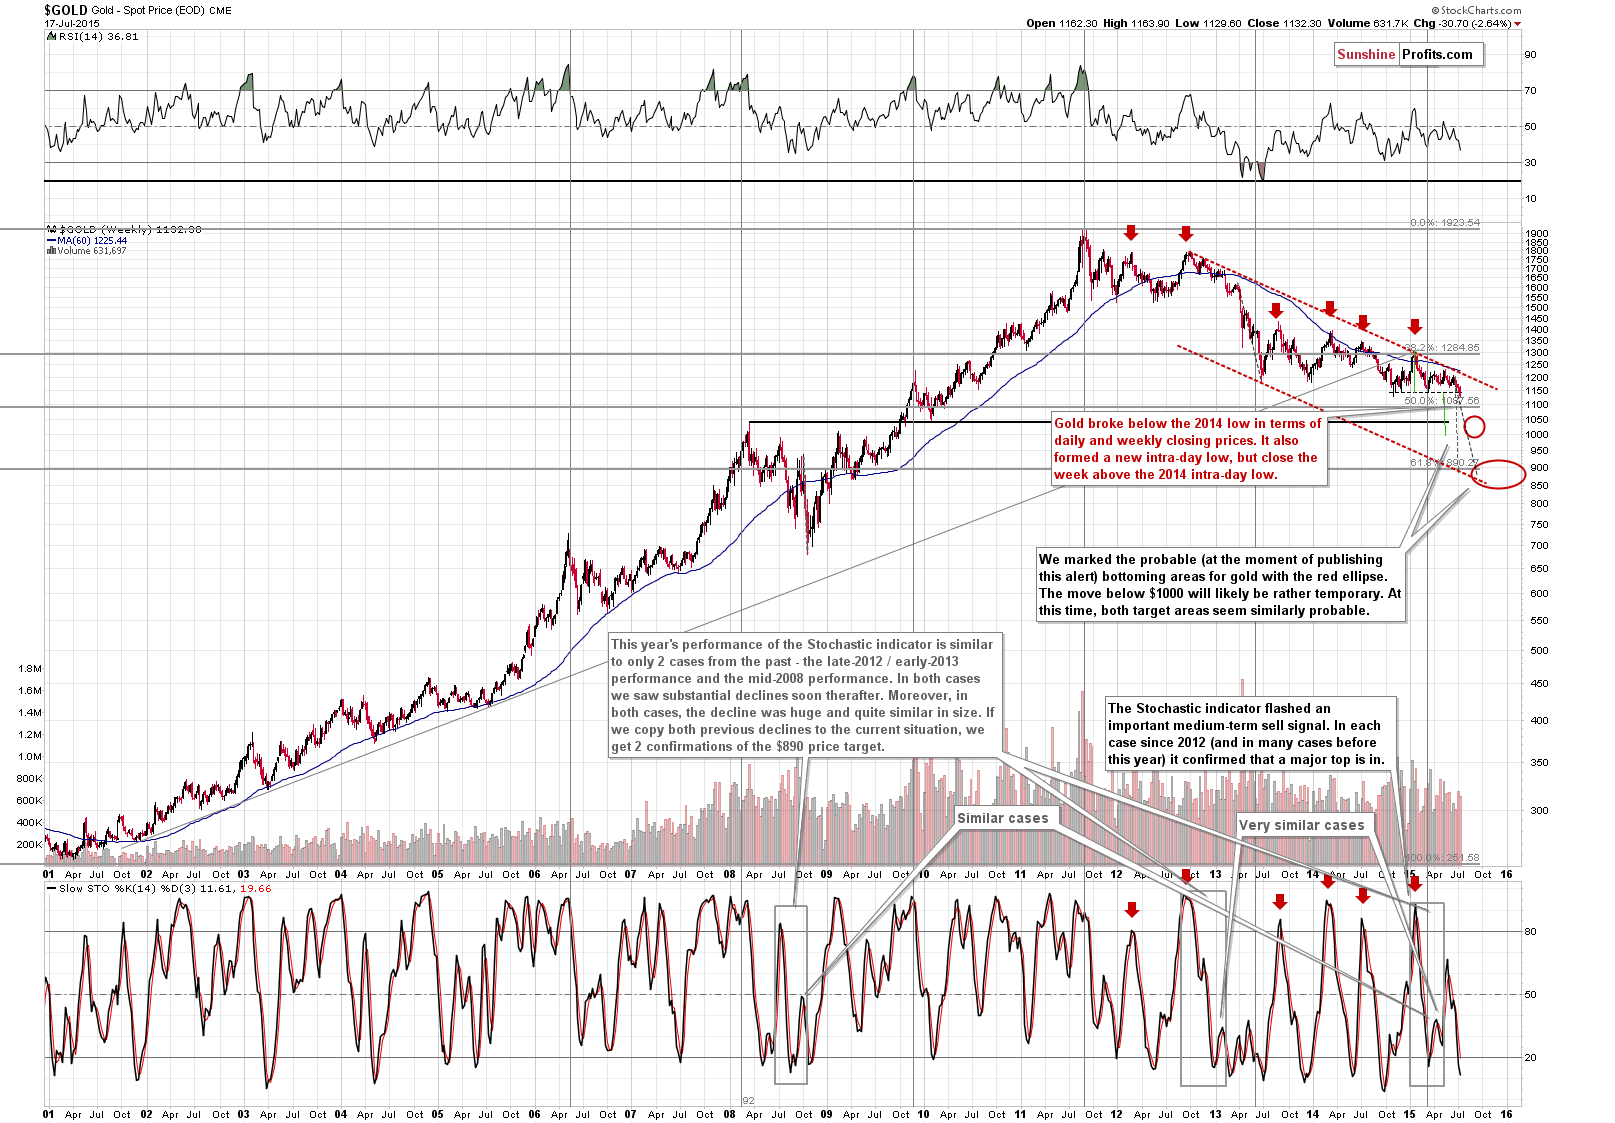
From the long-term perspective, not much changed on Friday – we saw a small, unconfirmed breakdown. Once it’s more visible (and it already is based on Monday’s pre-market decline) and confirmed (it’s not confirmed yet), the picture will become extremely bearish. Our previous comments on the above chart remain up-to-date:
The final target area for gold’s bottom is far away and the odds that the final bottom is just around the corner are small. In fact, nothing changed since we discussed the probabilities for different targets for gold, so if you haven’t had the chance to read our alert with the targets for gold, please do so today.
On Friday, we commented on the above chart in the following way:
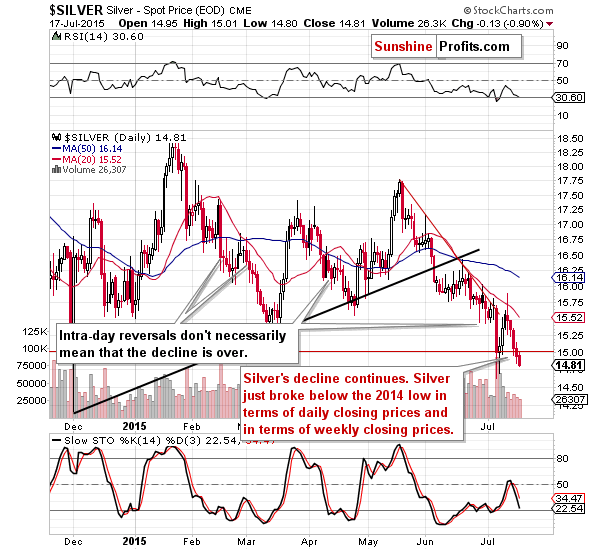
Silver broke below the previous low in terms of daily closing prices. At the moment of writing these words, the white metal is trading a few cents below $15. Entering, and then doubling the short positions has once again proved to be very profitable.
If gold was to decline once again and then to reverse, we would expect silver to do a similar thing – it could decline to the 2014 intra-day low and then to move back up again in a corrective upswing. Whether this move is worth trading (it’s not certain that this move will take place and we would miss the continuation of the decline if we exited the short position prematurely) or not will depend on the kind of confirmations that we get – just like it is the case with gold.
The above remains up-to-date. We saw another close below the 2014 low (in terms of daily closing prices) and we saw a breakdown in terms of the weekly closing prices. The situation deteriorated once again, but not extremely so.
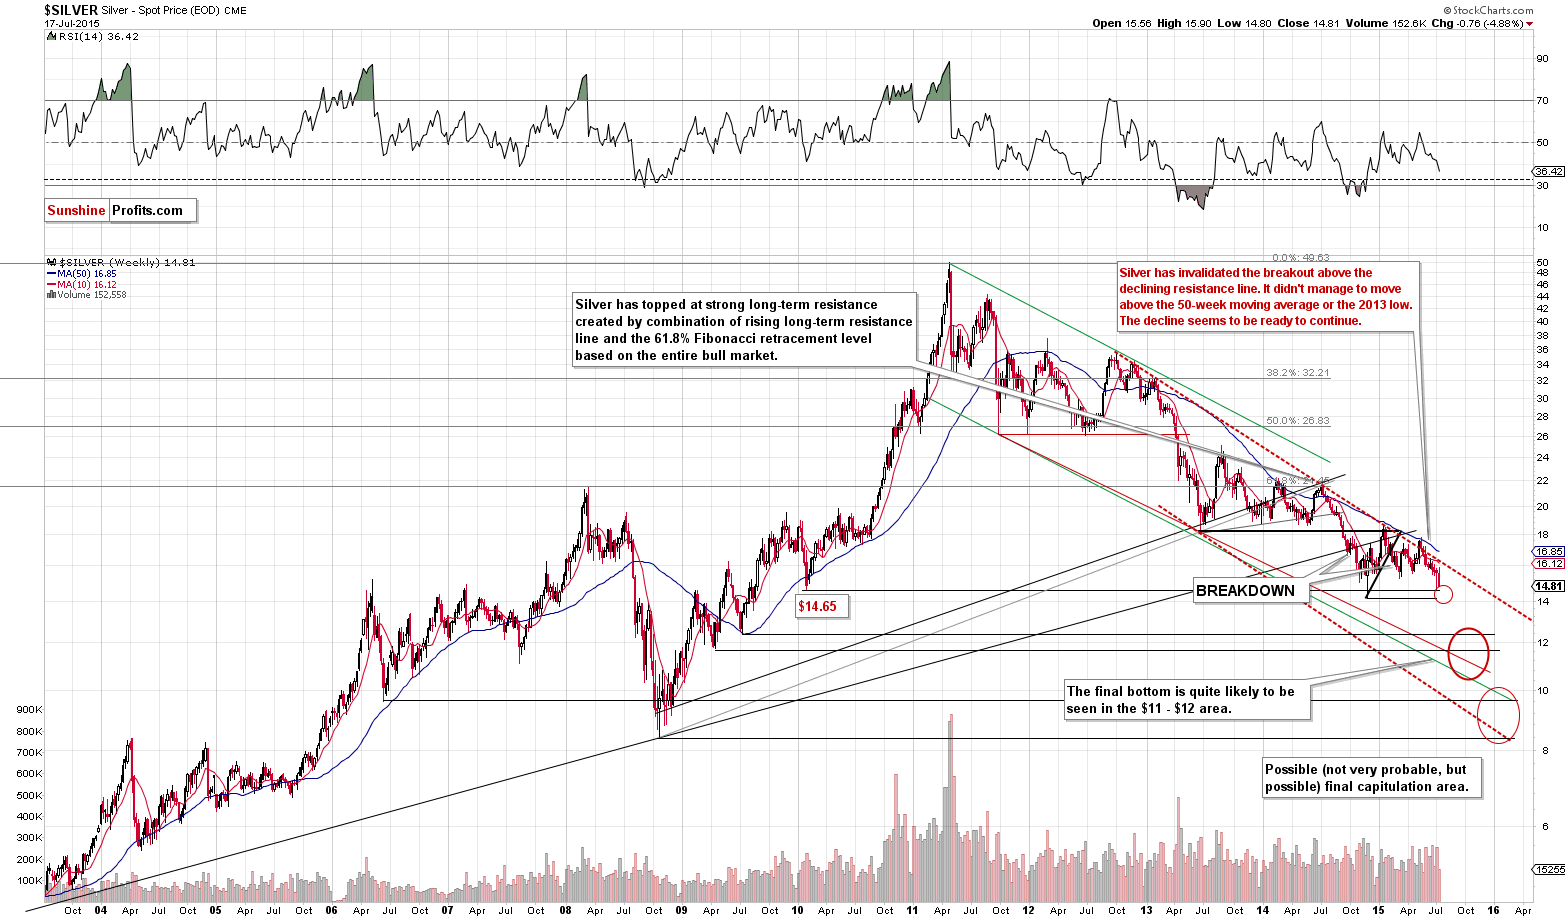
While the above may seem like a bog decline, please note that silver move even lower and that our targets are relatively far away. Our previous comments on the above chart remain up-to-date:
The decline continues as expected. Will silver form a local bottom soon? It could be the case and it’s moderately likely. Will it be the final bottom? We view it as unlikely. The points that we made when we discussed the price targets for silver remain up-to-date, so if you didn’t read this discussion, we encourage you to read it today.
We have one other chart featuring silver for you today.
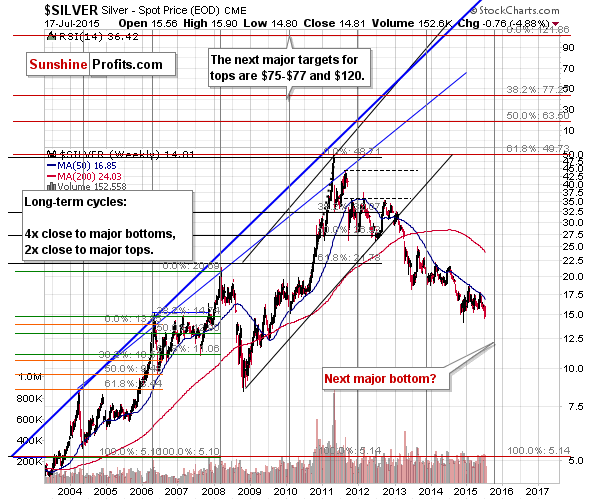
We don’t feature the above chart to often, but it’s one of the things that we monitor on a continuous basis. The very long-term cycles in silver are a very useful tool and at this time it seems that they are suggesting that a major bottom is on the horizon, but another few months away. We think that this will be the bottom also for gold and mining stocks.
We previously commented on the above chart in the following way (and these comments remain up-to-date):
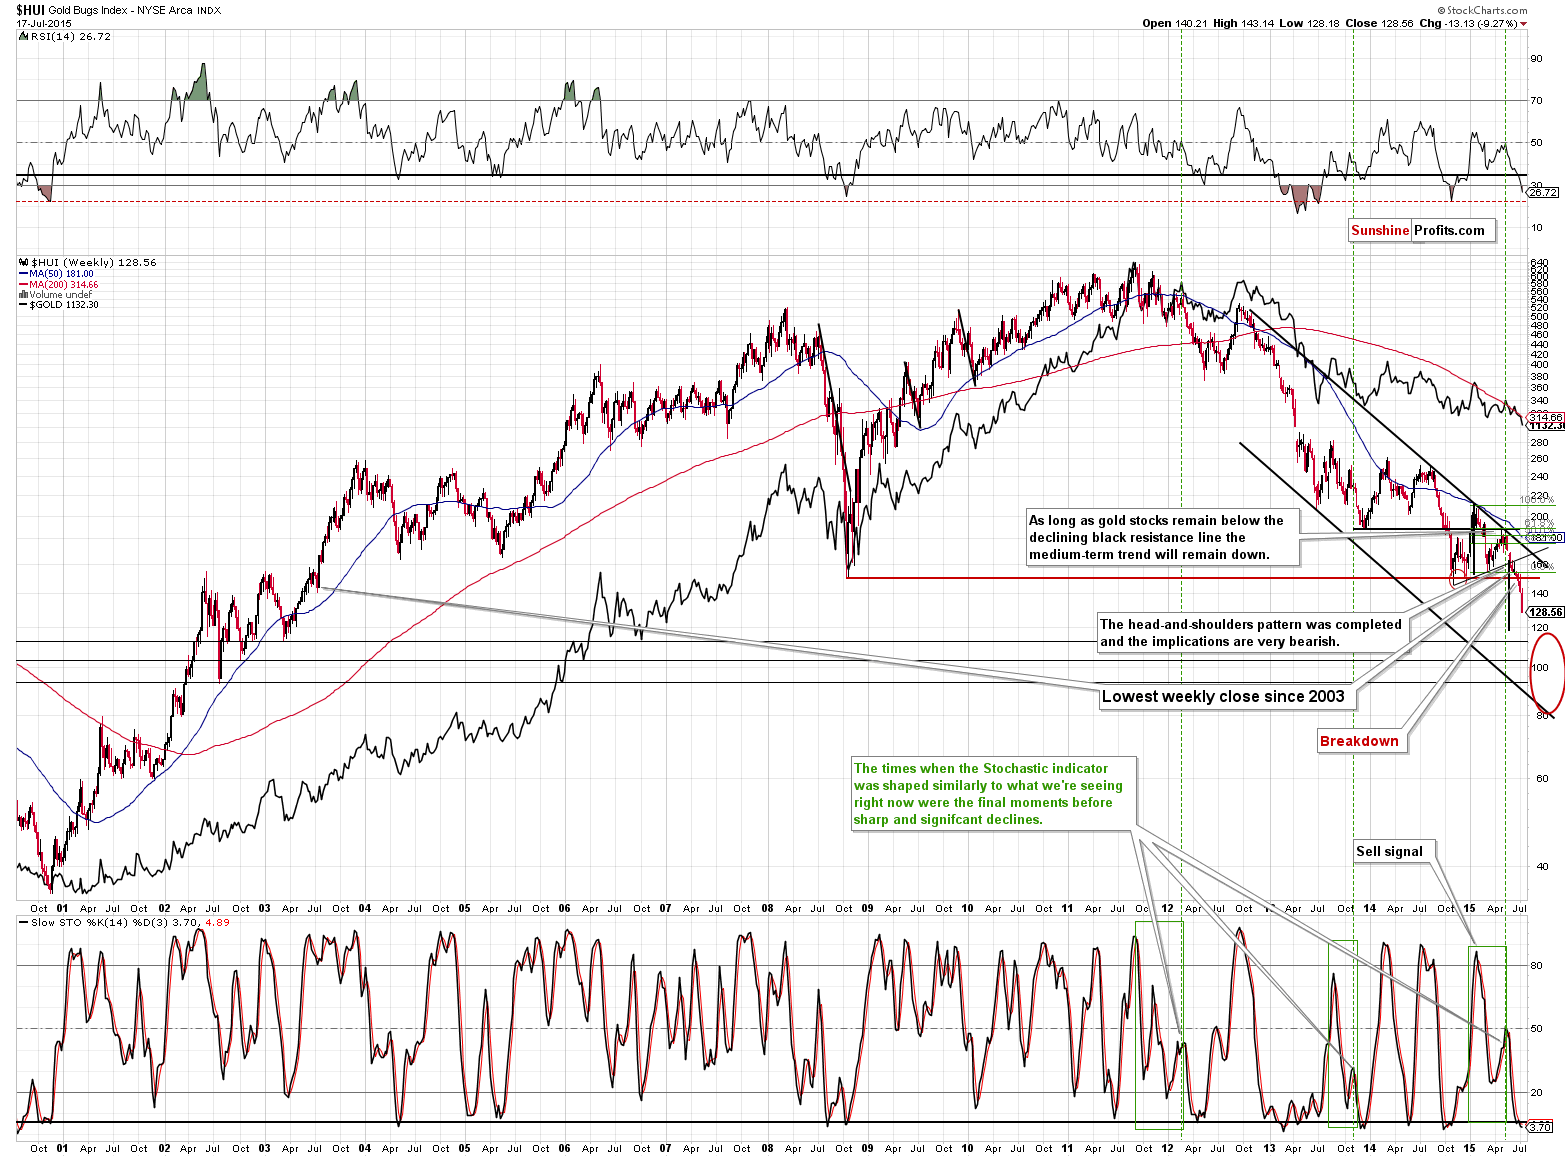
For the past several days we have been writing that the situation for mining stocks is very bearish as they broke below their 2008 lows. We can say the same thing also today. The outlook was very bearish and it still is. As you can see on the above HUI Index chart, we expect the final bottom to take place between 90 and 120, which is a rather broad range, but the 100 level seems to be the most likely target.
If gold and silver move higher temporarily then miners would likely move temporarily higher as well, but the very strong resistance created by the 2008 low will very likely not be broken as a result of such corrective rally. Whether this move in gold stocks and silver stocks is worth betting on will depend on confirmations that we get.
Speaking of confirmations, we dedicated a large part of one of the previous alerts to discussing the confirmations that we expect to see when the final bottom is in – they are more important than price levels, so if you haven’t had the chance to read about it previously, we encourage you to do so today.
The thing that we would like to add today is that if gold closes below $1,100 or so, we could see HUI close to or below 120. This level is the upper part of our target area and it’s the target level based on the head-and-shoulders formation that started forming in the final part of the previous year.
We might limit or close the current short positions when HUI gets to 120 or so, but that’s not certain just yet.
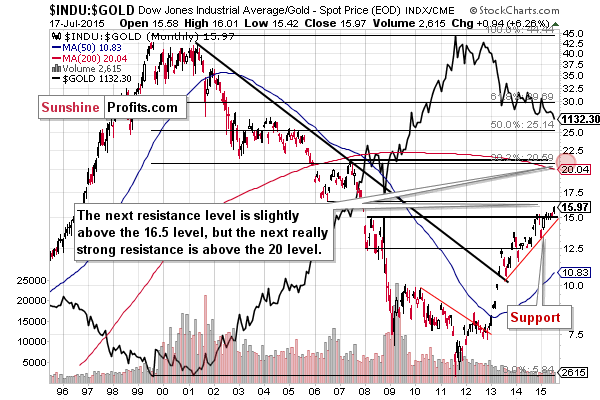
The Dow to gold ratio just closed the week well above the previous resistance level created by the 2008 highs. In a way, we saw major breakdown in gold as this ratio moves in the opposite direction to gold.
Mining stocks underperformed greatly on Friday and we would expect to see the opposite if gold has indeed bottomed on that day. The implications are, naturally, bearish.
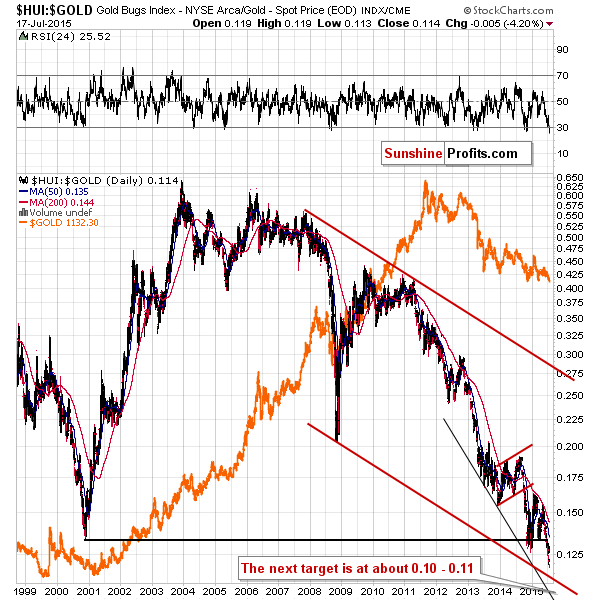
Gold stocks to gold ratio continues to slide and the breakdown below the 2000 low is now more than confirmed. The next important support levels are created by lower borders of declining trend channels. The lower of them is more or less at the 0.10 level – which would imply for instance a 100 HUI with $1,000 gold. Both levels are within our target areas.
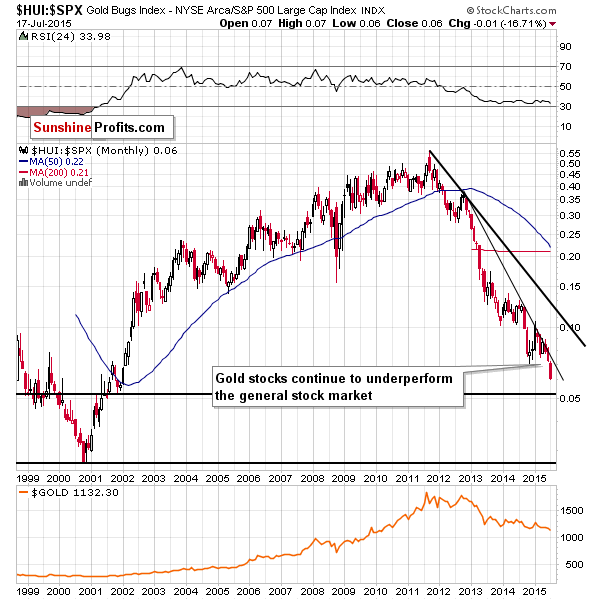
The ratio between mining stocks and the general stock market is moving lower as well. The next support is quite far – we would need to see the repeat of this month’s underperformance for the ratio to move to its closes support level.
Summing up, the situation in the precious metals market remains bearish and the already substantial profits on our short position have increased once again (and in a major way). We could be at a local bottom at this time, but it doesn’t seem very likely just yet – miners are not acting strongly, but instead they are pointing to even lower prices. It might be a good idea to take all or some profits off the table shortly, but that’s not the case just yet (exiting positions doesn’t seem justified from the risk/reward point of view). The above COULD change today or after today’s session, and if it does we will let you know.
We would like to stress, however, that we don’t expect to make changes in the long-term investment part of the portfolio shortly. It’s likely that the final bottom for this decline is relatively far away, but – as always – the situation can change quickly. The following part of the year will require much more attention than the previous months and years, as the odds are that we will see the final bottom in it.
We will keep you – our subscribers – updated.
To summarize:
Trading capital (our opinion): Short position (full) position in gold, silver and mining stocks is justified from the risk/reward perspective with the following stop-loss orders and initial (!) target prices:
- Gold: initial target price: $1,062; stop-loss: $1,208, initial target price for the DGLD ETN: $95.88; stop loss for the DGLD ETN $66.49
- Silver: initial target price: $12.72; stop-loss: $17.11, initial target price for the DSLV ETN: $102.21; stop loss for DSLV ETN $38.32
- Mining stocks (price levels for the GDX ETN): initial target price: $14.12; stop-loss: $18.73, initial target price for the DUST ETN: $30.68; stop loss for the DUST ETN $14.08
In case one wants to bet on lower junior mining stocks' prices (we do not suggest doing so – we think senior mining stocks are more predictable in case of short-term trades – we if one wants to do it anyway, we provide the details), here are the stop-loss details and initial target prices:
- GDXJ: initial target price: $18.12; stop-loss: $25.78
- JDST: initial target price: $16.26; stop-loss: $5.79
Long-term capital (our opinion): No positions
Insurance capital (our opinion): Full position
Please note that a full position doesn’t mean using all of the capital for a given trade. You will find details on our thoughts on gold portfolio structuring in the Key Insights section on our website.
As a reminder – “initial target price” means exactly that – an “initial” one, it’s not a price level at which we suggest closing positions. If this becomes the case (like it did in the previous trade) we will refer to these levels as levels of exit orders (exactly as we’ve done previously). Stop-loss levels, however, are naturally not “initial”, but something that, in our opinion, might be entered as an order.
Since it is impossible to synchronize target prices and stop-loss levels for all the ETFs and ETNs with the main markets that we provide these levels for (gold, silver and mining stocks – the GDX ETF), the stop-loss levels and target prices for other ETNs and ETF (among other: UGLD, DGLD, USLV, DSLV, NUGT, DUST, JNUG, JDST) are provided as supplementary, and not as “final”. This means that if a stop-loss or a target level is reached for any of the “additional instruments” (DGLD for instance), but not for the “main instrument” (gold in this case), we will view positions in both gold and DGLD as still open and the stop-loss for DGLD would have to be moved lower. On the other hand, if gold moves to a stop-loss level but DGLD doesn’t, then we will view both positions (in gold and DGLD) as closed. In other words, since it’s not possible to be 100% certain that each related instrument moves to a given level when the underlying instrument does, we can’t provide levels that would be binding. The levels that we do provide are our best estimate of the levels that will correspond to the levels in the underlying assets, but it will be the underlying assets that one will need to focus on regarding the sings pointing to closing a given position or keeping it open. We might adjust the levels in the “additional instruments” without adjusting the levels in the “main instruments”, which will simply mean that we have improved our estimation of these levels, not that we changed our outlook on the markets. We are already working on a tool that would update these levels on a daily basis for the most popular ETFs, ETNs and individual mining stocks.
Our preferred ways to invest in and to trade gold along with the reasoning can be found in the how to buy gold section. Additionally, our preferred ETFs and ETNs can be found in our Gold & Silver ETF Ranking.
As always, we'll keep you - our subscribers - updated should our views on the market change. We will continue to send out Gold & Silver Trading Alerts on each trading day and we will send additional Alerts whenever appropriate.
The trading position presented above is the netted version of positions based on subjective signals (opinion) from your Editor, and the Tools and Indicators.
As a reminder, Gold & Silver Trading Alerts are posted before or on each trading day (we usually post them before the opening bell, but we don't promise doing that each day). If there's anything urgent, we will send you an additional small alert before posting the main one.
=====
Latest Free Trading Alerts:
China ended years of speculation and announced an almost 60 percent jump in its gold reserves since 2009. What does it imply for the gold market?
China Updates Its Official Gold Holdings
S&P 500 index remains very close to its late May all-time high. Will this uptrend accelerate?
Stock Trading Alert: Positive Expectations Following Last Week's Rally - Will It Continue?
=====
Hand-picked precious-metals-related links:
Commodity Rout Extends Toward 13-Year Low as Gold Shunned on Fed
Gold hits five-year low under $1,100 on Chinese selling
$5-trillion asteroid to whiz past Earth
=====
In other news:
Greece Said to Order Creditor Payments as Banks Reopen
Futures rise as earnings remain in focus
Krugman slams Greece, Germany slams Krugman
=====
Thank you.
Sincerely,
Przemyslaw Radomski, CFA
Founder, Editor-in-chief
Gold & Silver Trading Alerts
Forex Trading Alerts
Oil Investment Updates
Oil Trading Alerts

