

Briefly: In our opinion, short (half) speculative positions in gold, silver and mining stocks are justified from the risk/reward point of view.
Gold and silver declined yesterday (the latter quite sharply), but this time (contrary to the previous days’ underperformance) mining stocks refused to decline. Which part of the precious metals sector shows the real direction in which the entire sector will move in the coming days?
Most likely it’s the move in the metals that should be emphasized. The key fact here is that miners had a good reason not to decline further. Before we discuss it, let’s take a look at the metals, starting with gold (charts courtesy of http://stockcharts.com).
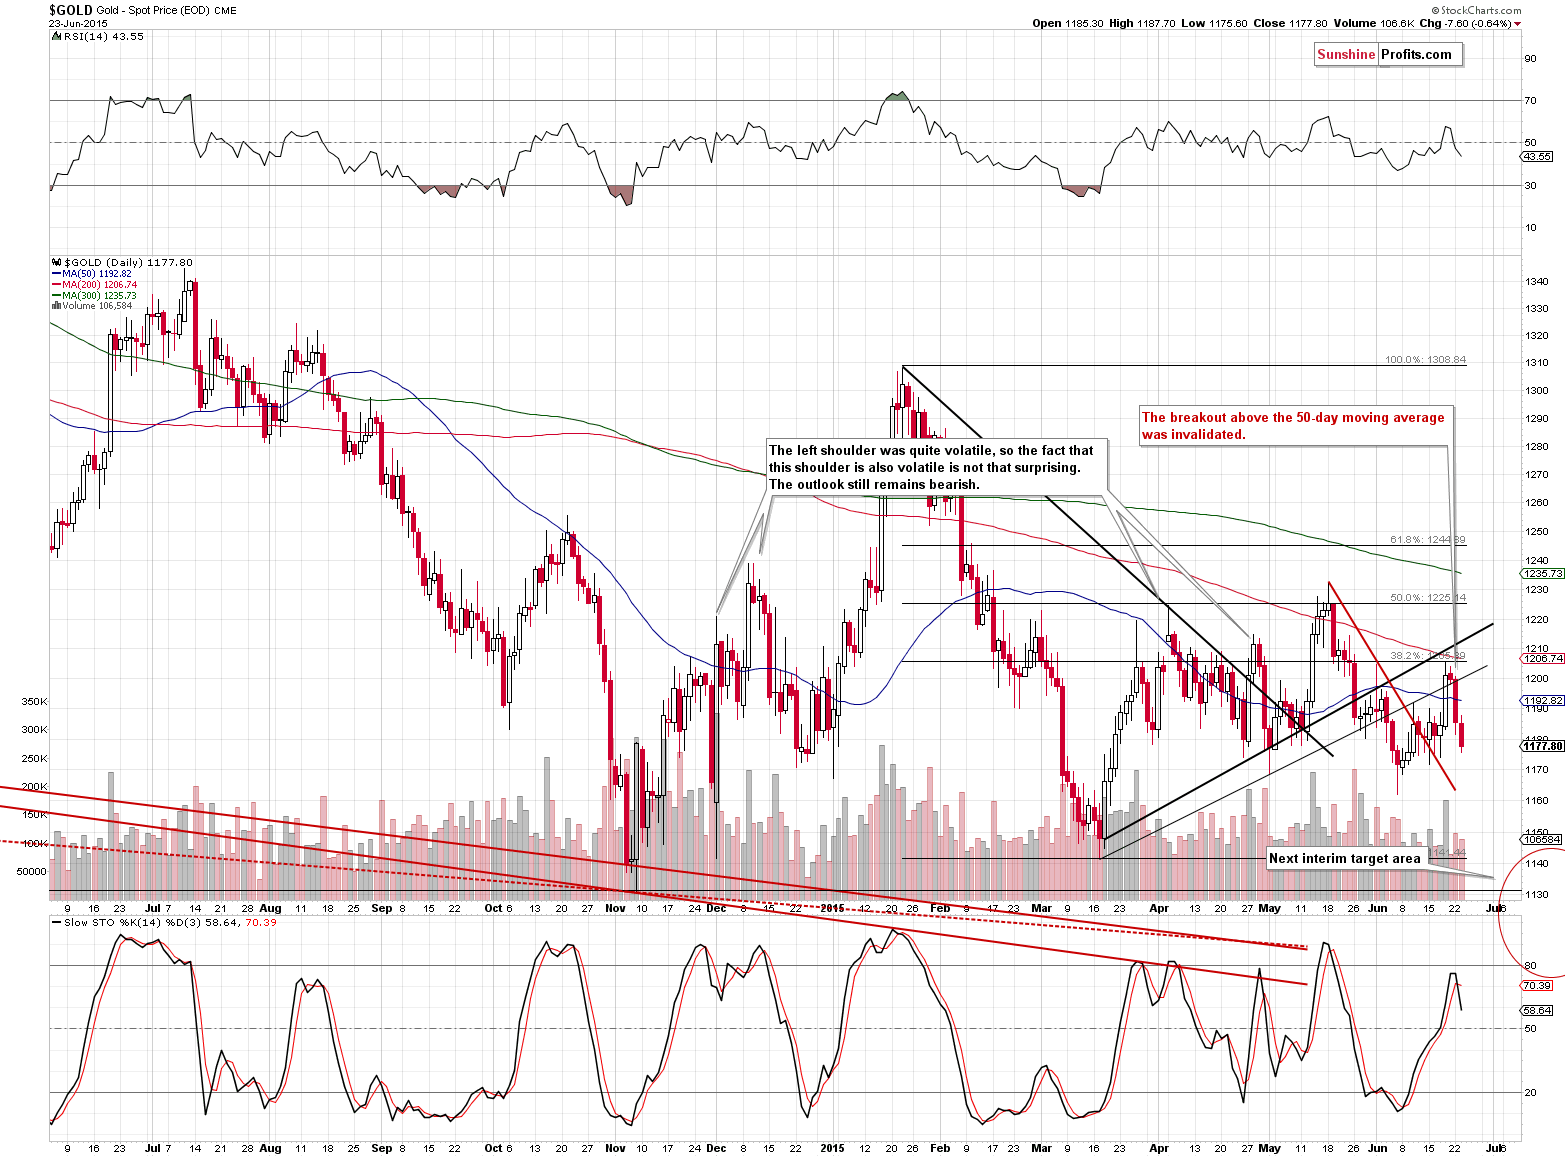
Gold is now visibly below the rising resistance line and the 50-day moving average, and the previous breakout was clearly invalidated. The volume that corresponded to the decline was not huge, but the size of the move is significant enough to confirm it, in our view.
Moreover, the we have just seen a sell signal from the Stochastic indicator, which is a very bearish sign.
Overall, the above chart deteriorated quite significantly based on yesterday’s price action.
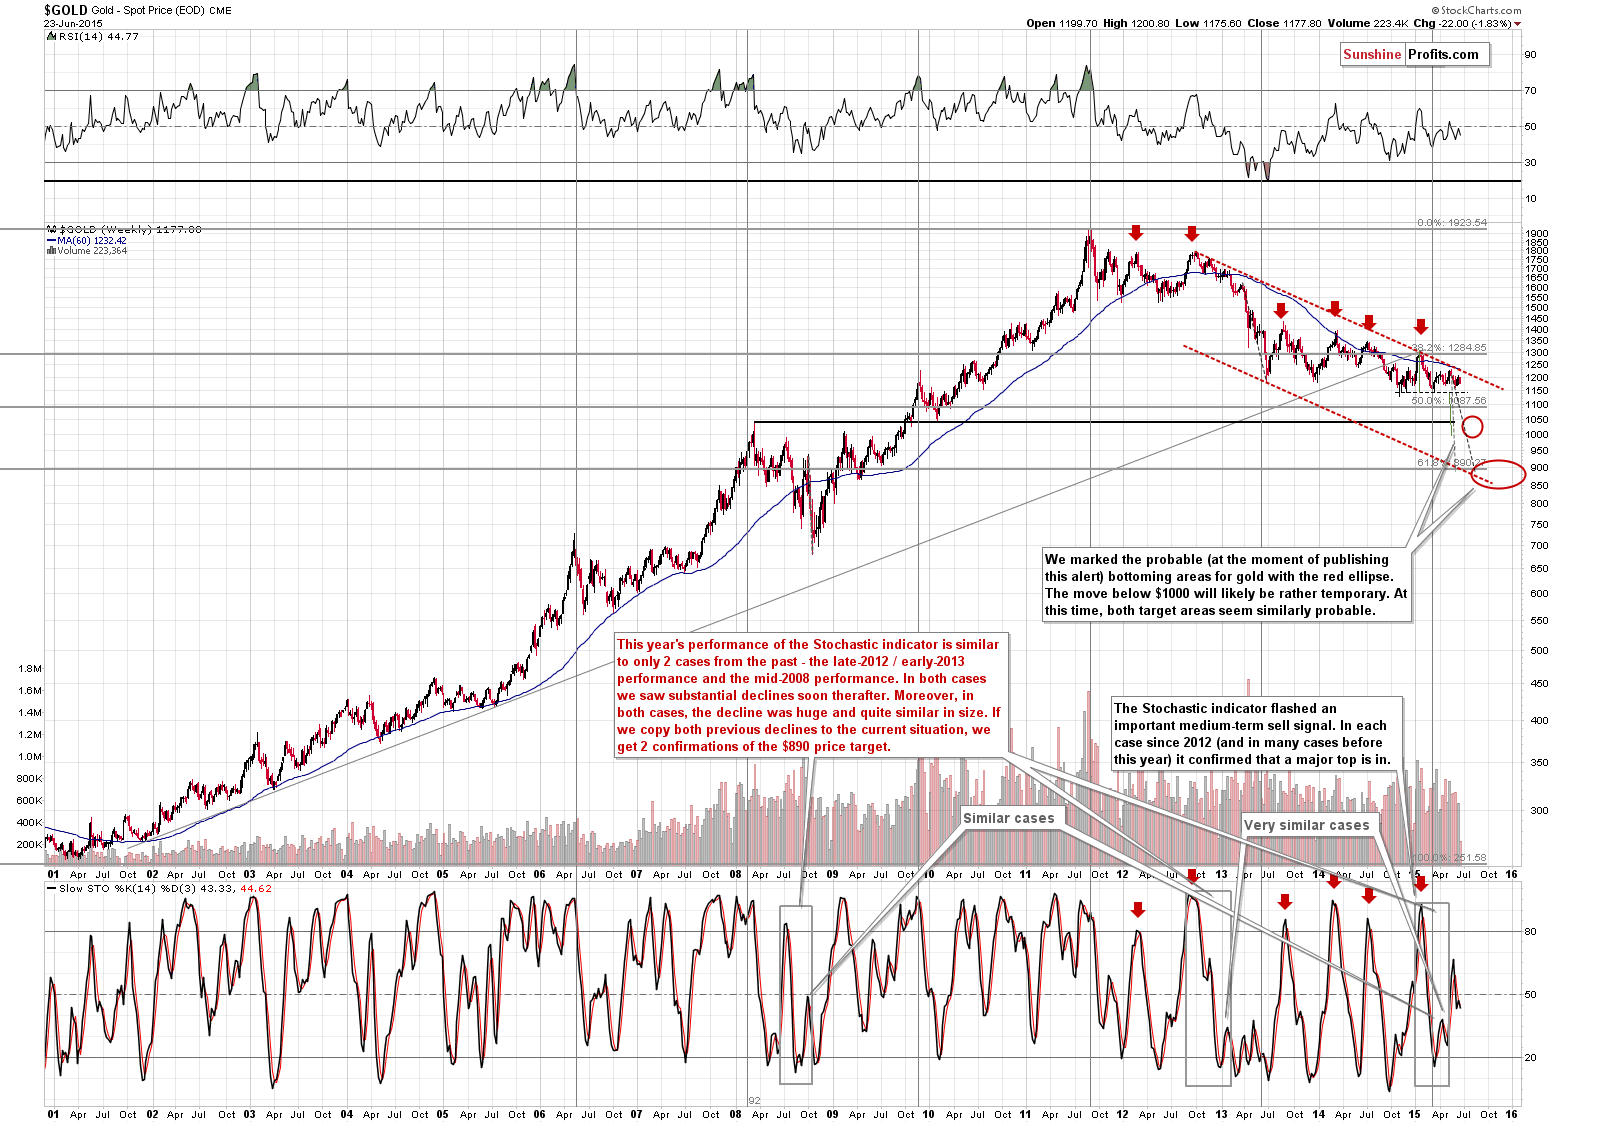
From the long-term point of view, we see no changes. The medium-term trend has been down and that’s still the case. Moreover, please note that the sell signal from the weekly Stochastic indicator remains in place and the size of the projected move is very big, so the potential profits on the short positions and savings by not being in the gold market at the moment and waiting to re-enter it at lower prices are likely to be significant.
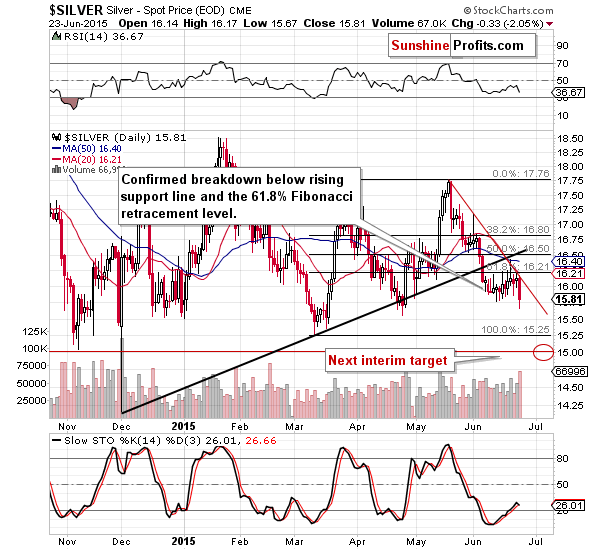
Silver moved lower in a visible way and such moves are usually followed by more weakness (even though silver is at $15.84 at the moment of writing these words). The volume also suggests that this is not an incidental downswing. It seems that the most recent move higher in silver was just a verification of the breakdown below the rising support/resistance line and the 50-day moving average. The above chart has bearish implications.
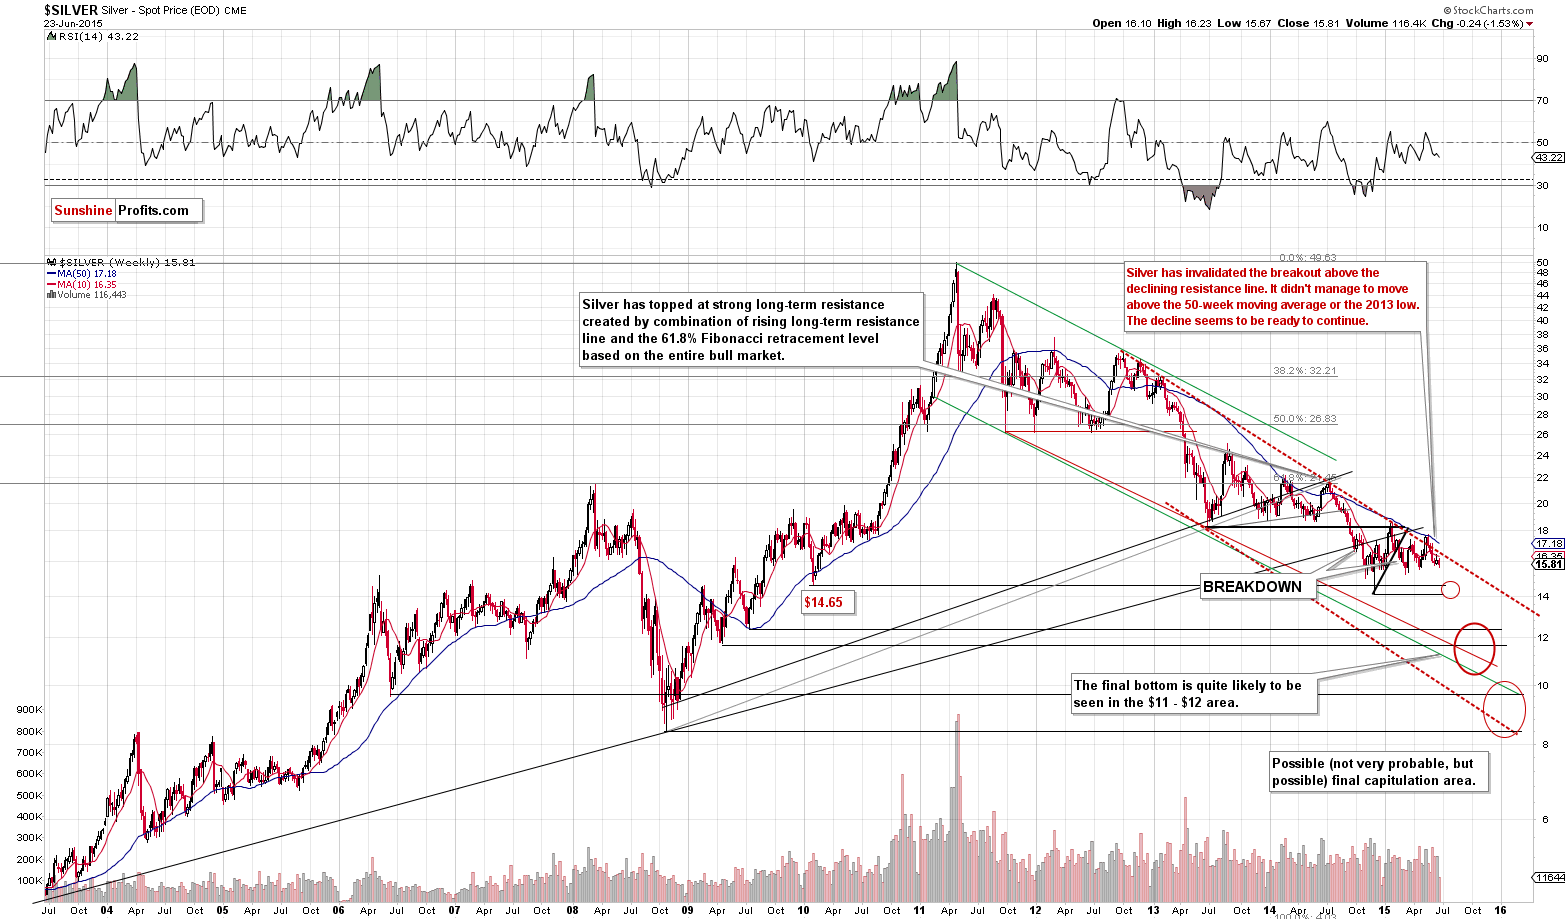
The medium-term trend – as in gold – remains down and the size of the potential decline (even only to our first target area) remains huge.
Overall, the situation in metals deteriorated yesterday – so why didn’t miners slide and underperform as they used to?
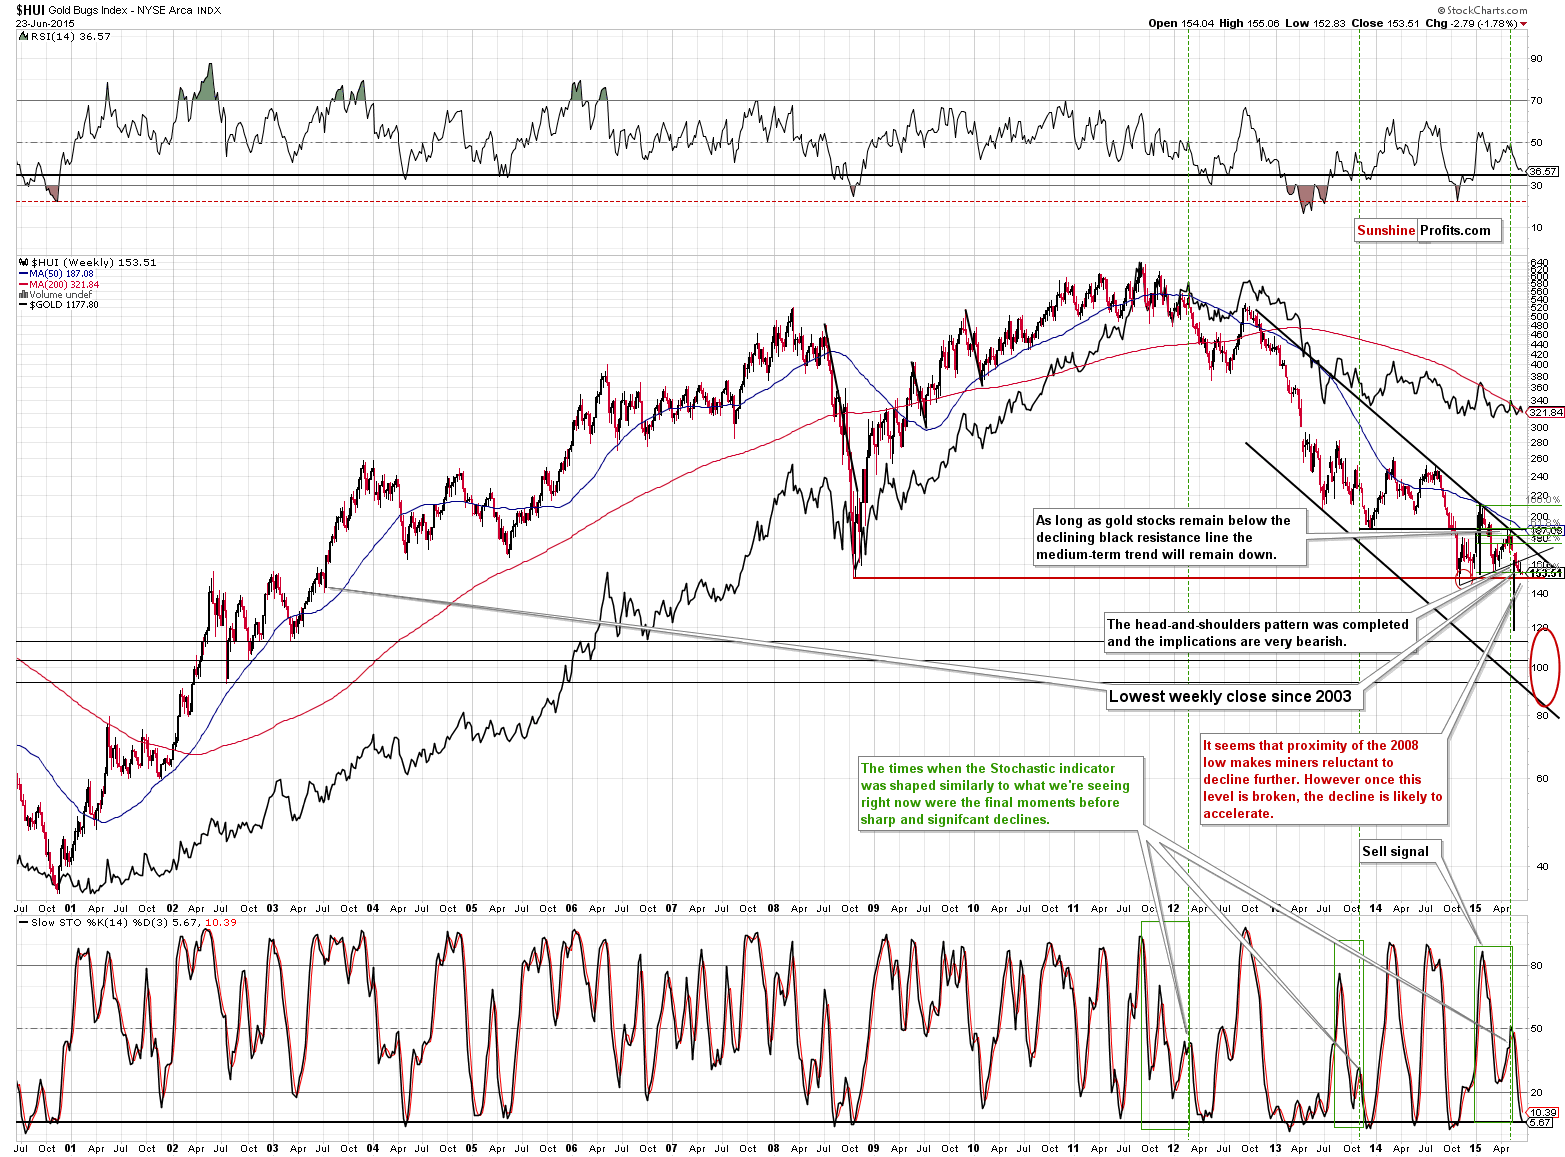
Because they were extremely close to the 2008 low, which is a major support level. Given the strength of the support, it’s not surprising that we haven’t seen a move lower… yet. “Yet”, because the trend remains down and based on the recent (and not so recent) underperformance of the sector, it seems that the 2008 low will be broken sooner or later.
The Stochastic indicator is very close to the 0 level which generally suggests an extremely oversold condition. However, most data points suggesting the above come from the time when the medium-term trend for the miners was up. Since late 2012 or so, this signal has not been very effective. In particular, the decline that we saw in 2013 was accompanied by a few moments when the Stochastic was close to the 0 level (the black horizontal line on the above chart) and it only meant pauses in the decline – not bigger rallies. It seems that this is what we’re seeing now – a pause.
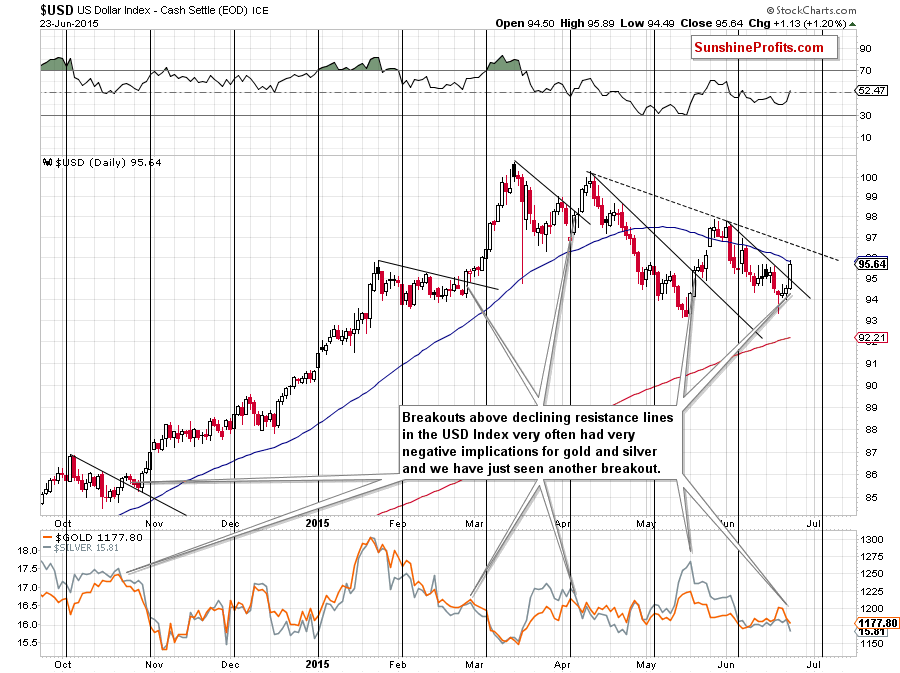
One of the most important bearish confirmations that we saw yesterday came from the USD Index. Namely, it broke above the declining resistance line. Normally, we would wait for a confirmation of such a move before drawing any conclusions, but analyzing the past situations makes us think that it’s not necessary this time. This time is not different, but quite likely just like the previous cases, and in previous cases when the USD broke above such lines, we saw declines in the precious metals sector. That was the case in 4 out of 4 cases visible on the above chart and in a few other cases in the previous year.
In particular, in October 2014, the USD declined after a breakout, but gold and silver didn’t wait for the move to be verified – they started to decline right away. It seems that we’re seeing a similar kind of performance once again today.
Summing up, the situation in the precious metals market deteriorated once again yesterday and the outlook is now significantly more bearish than it was just a few days ago. The miners’ reluctance to move lower is not something that’s really bullish at this time – it’s a normal reaction given the move to (almost) the 2008 low. Consequently, we think that the situation is bearish enough to justify opening small (half of the regular position) short positions from the risk/reward point of view. We will likely double the position once we see an additional bearish confirmation or a number of them.
We will keep you – our subscribers – updated.
To summarize:
Trading capital (our opinion): Short position (half) position in gold, silver and mining stocks is justified from the risk/reward perspective with the following stop-loss orders and initial (!) target prices:
- Gold: initial target price: $1,115; stop-loss: $1,253, initial target price for the DGLD ETN: $87.00; stop loss for the DGLD ETN $63.78
- Silver: initial target price: $15.10; stop-loss: $17.33, initial target price for the DSLV ETN: $67.81; stop loss for DSLV ETN $41.17
- Mining stocks (price levels for the GDX ETN): initial target price: $16.63; stop-loss: $21.83, initial target price for the DUST ETN: $23.59; stop loss for the DUST ETN $10.37
In case one wants to bet on lower junior mining stocks' prices (we do not suggest doing so – we think senior mining stocks are more predictable in case of short-term trades – we if one wants to do it anyway, we provide the details), here are the stop-loss details and initial target prices:
- GDXJ: initial target price: $21.17; stop-loss: $28.68
- JDST: initial target price: $14.35; stop-loss: $5.65
Long-term capital (our opinion): No positions
Insurance capital (our opinion): Full position
Please note that a full position doesn’t mean using all of the capital for a given trade. You will find details on our thoughts on gold portfolio structuring in the Key Insights section on our website.
As a reminder – “initial target price” means exactly that – an “initial” one, it’s not a price level at which we suggest closing positions. If this becomes the case (like it did in the previous trade) we will refer to these levels as levels of exit orders (exactly as we’ve done previously). Stop-loss levels, however, are naturally not “initial”, but something that, in our opinion, might be entered as an order.
Since it is impossible to synchronize target prices and stop-loss levels for all the ETFs and ETNs with the main markets that we provide these levels for (gold, silver and mining stocks – the GDX ETF), the stop-loss levels and target prices for other ETNs and ETF (among other: UGLD, DGLD, USLV, DSLV, NUGT, DUST, JNUG, JDST) are provided as supplementary, and not as “final”. This means that if a stop-loss or a target level is reached for any of the “additional instruments” (DGLD for instance), but not for the “main instrument” (gold in this case), we will view positions in both gold and DGLD as still open and the stop-loss for DGLD would have to be moved lower. On the other hand, if gold moves to a stop-loss level but DGLD doesn’t, then we will view both positions (in gold and DGLD) as closed. In other words, since it’s not possible to be 100% certain that each related instrument moves to a given level when the underlying instrument does, we can’t provide levels that would be binding. The levels that we do provide are our best estimate of the levels that will correspond to the levels in the underlying assets, but it will be the underlying assets that one will need to focus on regarding the sings pointing to closing a given position or keeping it open. We might adjust the levels in the “additional instruments” without adjusting the levels in the “main instruments”, which will simply mean that we have improved our estimation of these levels, not that we changed our outlook on the markets. We are already working on a tool that would update these levels on a daily basis for the most popular ETFs, ETNs and individual mining stocks.
Our preferred ways to invest in and to trade gold along with the reasoning can be found in the how to buy gold section. Additionally, our preferred ETFs and ETNs can be found in our Gold & Silver ETF Ranking.
As always, we'll keep you - our subscribers - updated should our views on the market change. We will continue to send out Gold & Silver Trading Alerts on each trading day and we will send additional Alerts whenever appropriate.
The trading position presented above is the netted version of positions based on subjective signals (opinion) from your Editor, and the Tools and Indicators.
As a reminder, Gold & Silver Trading Alerts are posted before or on each trading day (we usually post them before the opening bell, but we don't promise doing that each day). If there's anything urgent, we will send you an additional small alert before posting the main one.
=====
Latest Free Trading Alerts:
Yesterday’s data, which showed that U.S. existing home sales rose by 5.1% (to the highest level since November 2009) continued to weight also today, supporting the greenback and pushing the USD Index above the level of 95. As a result, USD/CHF moved sharply higher and broke above 3 short-term resistance lines. Will we see further rally in the coming days?
Forex Trading Alert: USD/CHF – Breakout!
We didn’t see much action yesterday. Bitcoin stayed below $250. The volume was higher than on the day before but not very high by any means. What might this mean for Bitcoin?
Bitcoin Trading Alert: Bitcoin Stays below $250
=====
Hand-picked precious-metals-related links:
Amplats axing over 400 jobs in South Africa
Shafts will close if Eskom gets 25% increase – Sibanye Gold
=====
In other news:
Greek crisis: Tsipras says 'no deal' with creditors
Signs Swedish QE Backfiring as Liquidity Evaporates
The Nikkei just closed at its highest level in 18 years
NSA spied on French presidents: WikiLeaks
=====
Thank you.
Sincerely,
Przemyslaw Radomski, CFA
Founder, Editor-in-chief
Gold & Silver Trading Alerts
Forex Trading Alerts
Oil Investment Updates
Oil Trading Alerts

