

Briefly: In our opinion, a speculative short position (full) in gold, silver and mining stocks is justified from the risk/reward point of view.
Gold and silver moved higher once again yesterday (this time only slightly higher) and the USD Index declined, but miners declined along with the latter (only slightly, but still). Is the rally over?
It seems likely, but we are not ruling out a few more days of trading sideways or of higher prices, before the decline truly starts. In short, the situation didn’t change much on Friday and what we wrote in Friday’s alert remains up-to-date. The most interesting development was the mining stocks’ decline despite a move higher in both gold and the general stock market. It seems that we are seeing the opposite of the signals that we saw when this rally was starting – which could indicate that a decline is about to start.
Let’s take a look at the charts (charts courtesy of http://stockcharts.com).
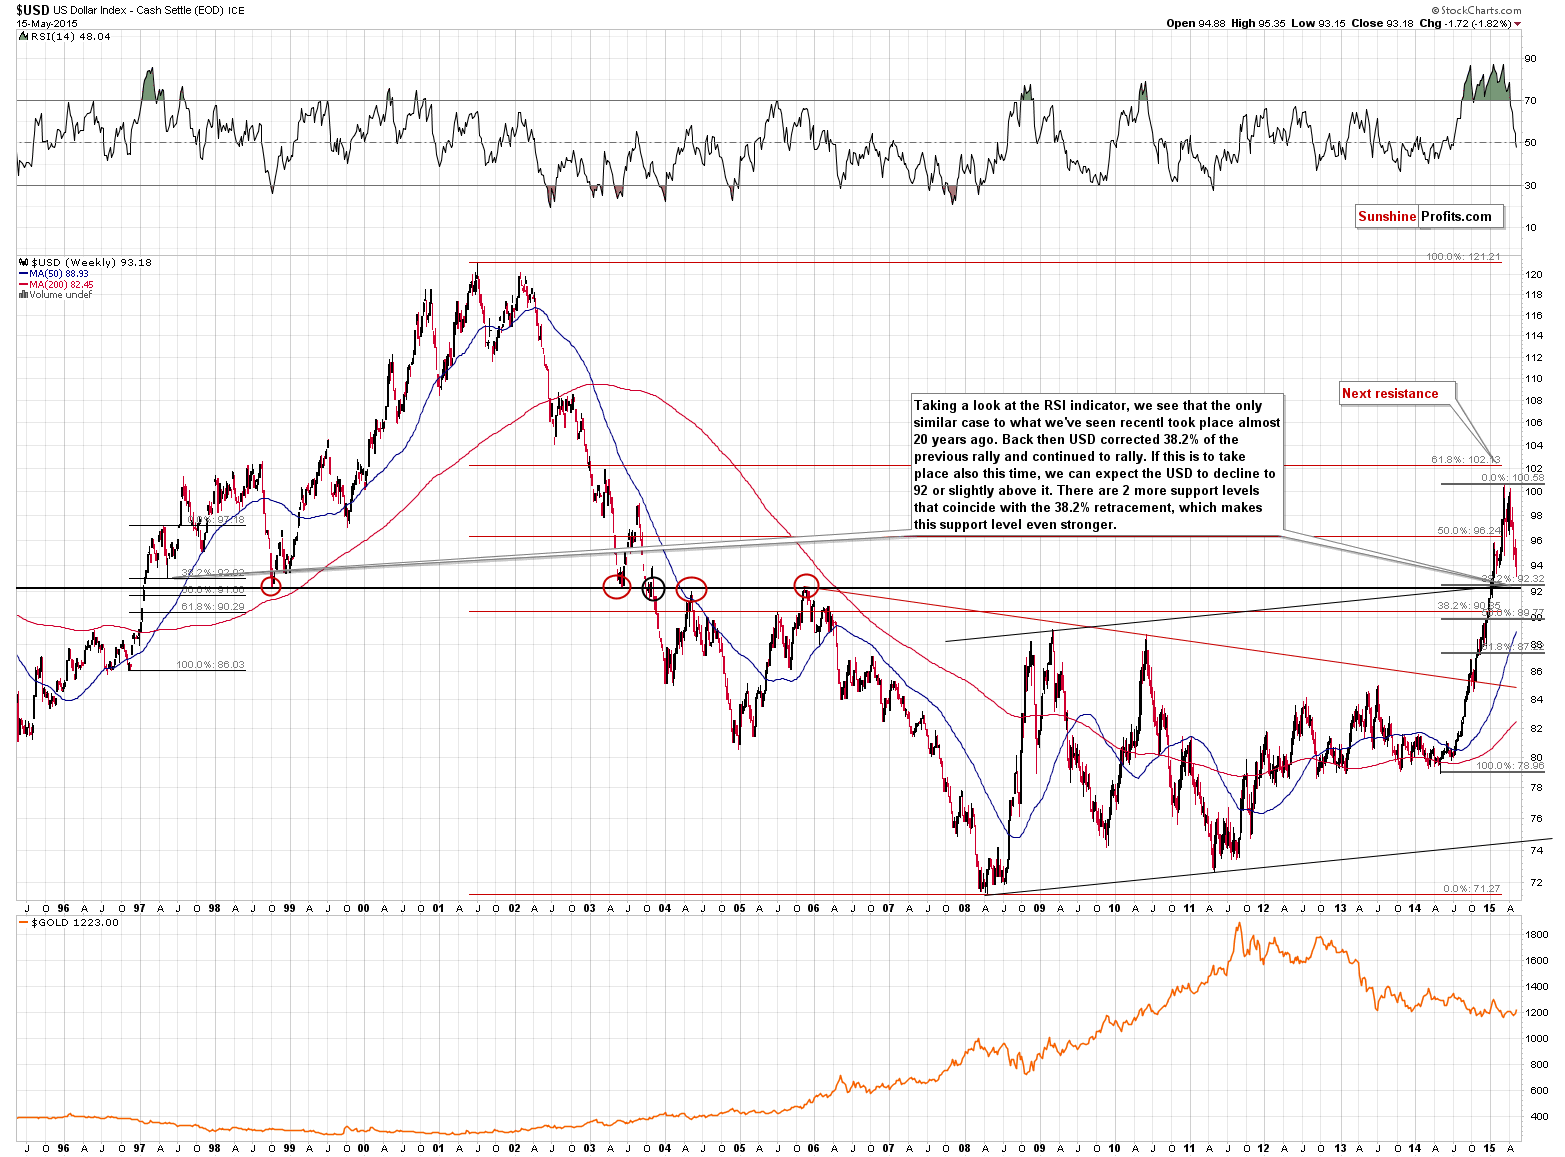
The USD Index moved a bit lower and is now less than one index point away from the very strong support level (at about 92.30).
Our previous comments on the above chart remain up-to-date:
USD was 5 index points higher about a month ago, so it declined quite a lot. One could have expected precious metals to rally based on such a decline in the USD, but that didn’t happen. Instead gold and silver moved back and forth and gold is actually even lower than it was in the first half of April.
The above tells us 2 things:
- Precious metals are likely to decline as they are not responding to a major positive factor.
- Even if the USD Index moves lower – say to 92 or so – before moving back up, we don’t necessarily have to see higher gold and silver prices.
The above remains up-to-date – metals are still likely to decline based on the above relationship. The most interesting thing is that while yesterday gold moved along with the USD Index, it’s not doing that today – it’s Thursday morning and gold is up $2 while the USD Index is down 0.50, trading at 93.18. The situation is developing as it was previously – gold responded to the USD’s decline, now it’s ignoring it and it could decline (perhaps erasing yesterday’s rally) once the USD Index corrects a little (say, 38.2% of yesterday’s decline or so). This is the kind of pattern that made gold move back and forth while the USD declined – and it remains in place. The situation did not really change yesterday – it continued to develop in the way that it had been developing previously.
The thing that changed was the surprisingly bad data – and the key word here is “surprisingly”. Markets were surprised and investors rushed to buy based on the sudden thought that the Fed will not raise interest rates. A single data point is not likely to change a trend (it could if it made gold plummet instead of rallying, thus taking gold to the extremely oversold levels earlier) – it simply delayed the decline. As the data was surprising it was not to be foreseen – but our approach takes such “surprises” and markets’ less-than-perfect predictability into account – that’s why we focus on the longer time-frames first (which are generally not affected by such “surprises”) and that’s why we placed the stop-loss orders for the current trade at relatively high levels – not to be shaken out of the market right before it plunges (and you saw just how quickly and sharply these surprising rallies can turn into declines on April 30).
Now, with the USD at 93.18 it’s just 1 index point above the combination of very strong support levels. Consequently, if the USD Index simply declines again, twice as much as it has declined so far today, we will be very likely seeing a major bottom, and a top in the precious metals prices. Can the USD rally sooner? Yes, the RSI indicator based on the daily USD closing prices is almost at the 30 level, which corresponded to local bottoms in the past. The implications for the precious metals are bearish for the medium term and short term but a bit unclear for the very short term (the next few days).
The link between the USD and precious metals became a bit more bullish for the latter as gold and silver moved higher without a major decline in the USD on Thursday, but this is not enough to change the tendency that’s been in place for about a month. It’s still likely that gold and silver will decline if the USD corrects just a little and that they will plunge when the USD reaches its local bottom and then rallies.
The USD Index can move about an index point lower or so before the final bottom for this decline is in, but it doesn’t mean that metals have to rally. They can, but it’s neither imminent, nor very likely. They could very well decline much earlier, and the USD Index could reverse before moving lower by another index point.
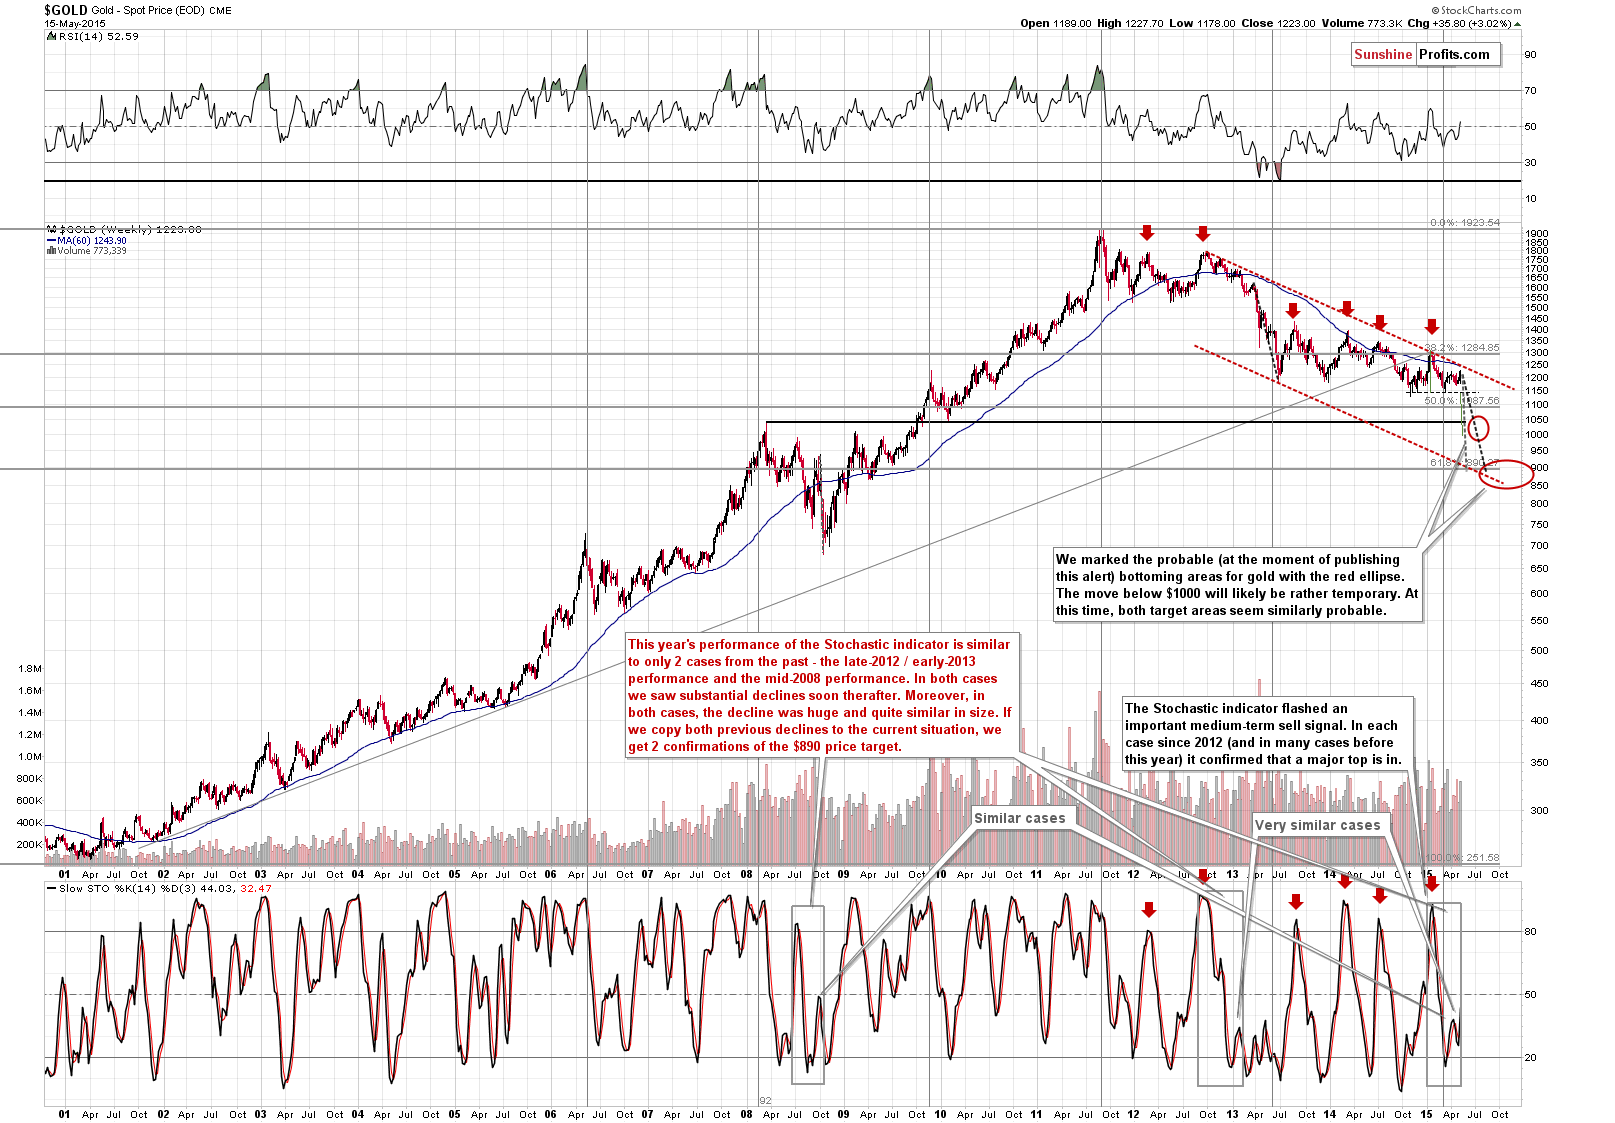
Nothing changed on gold’s long-term chart last week – gold indeed moved somewhat higher but it remains within its medium-term downtrend and last week’s rally is only somewhat visible from this perspective.
Our Friday’s comments on the above chart remain up-to-date:
Please note that we have a very strong resistance for gold just a little below $1,250 (declining resistance line and the 60-week moving average), so even if gold moves higher from here, it’s not likely to move much higher. Please note that we placed the stop-loss orders for gold above these levels – that was because we assumed in advance that a move to these levels would most likely not change the outlook to bullish – and it didn’t. We are not keeping this short position to gain several dollars, but to gain at least several tens of them, just like we did previously this year (where we profited on a more-than-$100 decline).
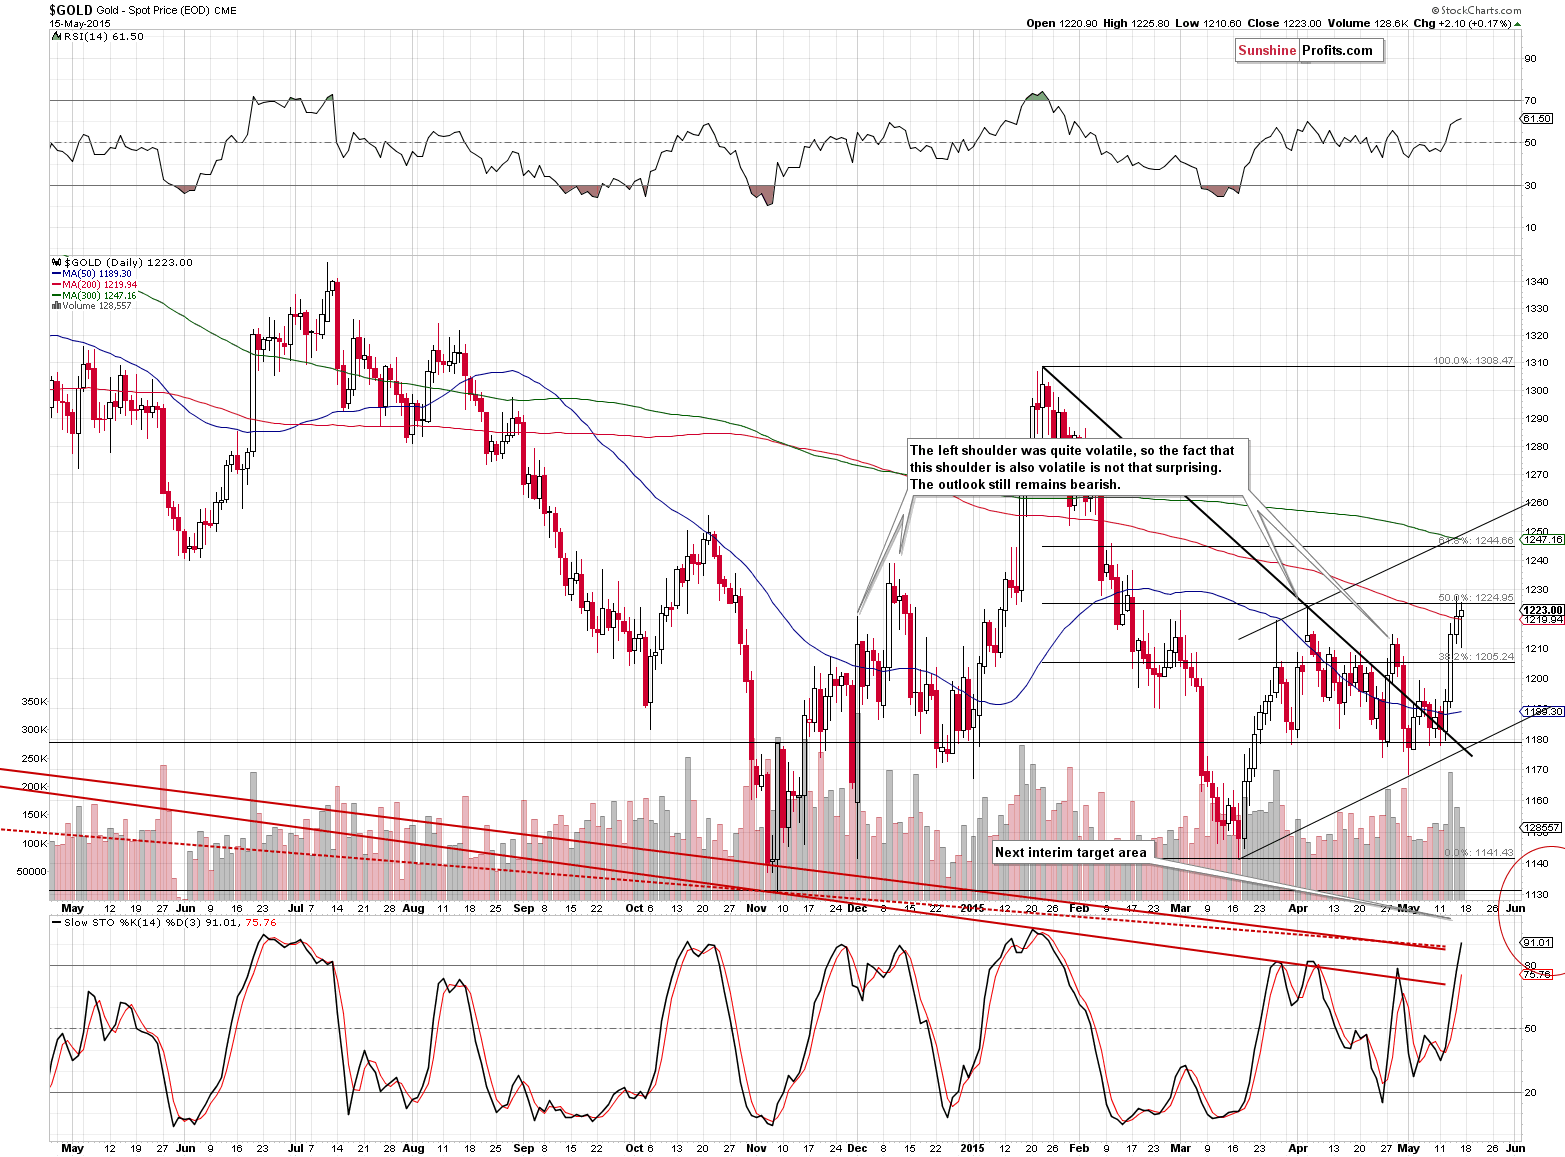
On the short-term basis, we see that gold once again corrected to the 50% Fibonacci retracement level based on the January – March decline. Technically, the recent rally was just a correction within a decline and it will remain such as long as we don’t see a breakout above the 61.8% Fibonacci retracement at about $1,245. The volume during Friday’s move higher was lower than what we’d seen in the previous 2 days, but it was not low enough to be a sell sign on its own.
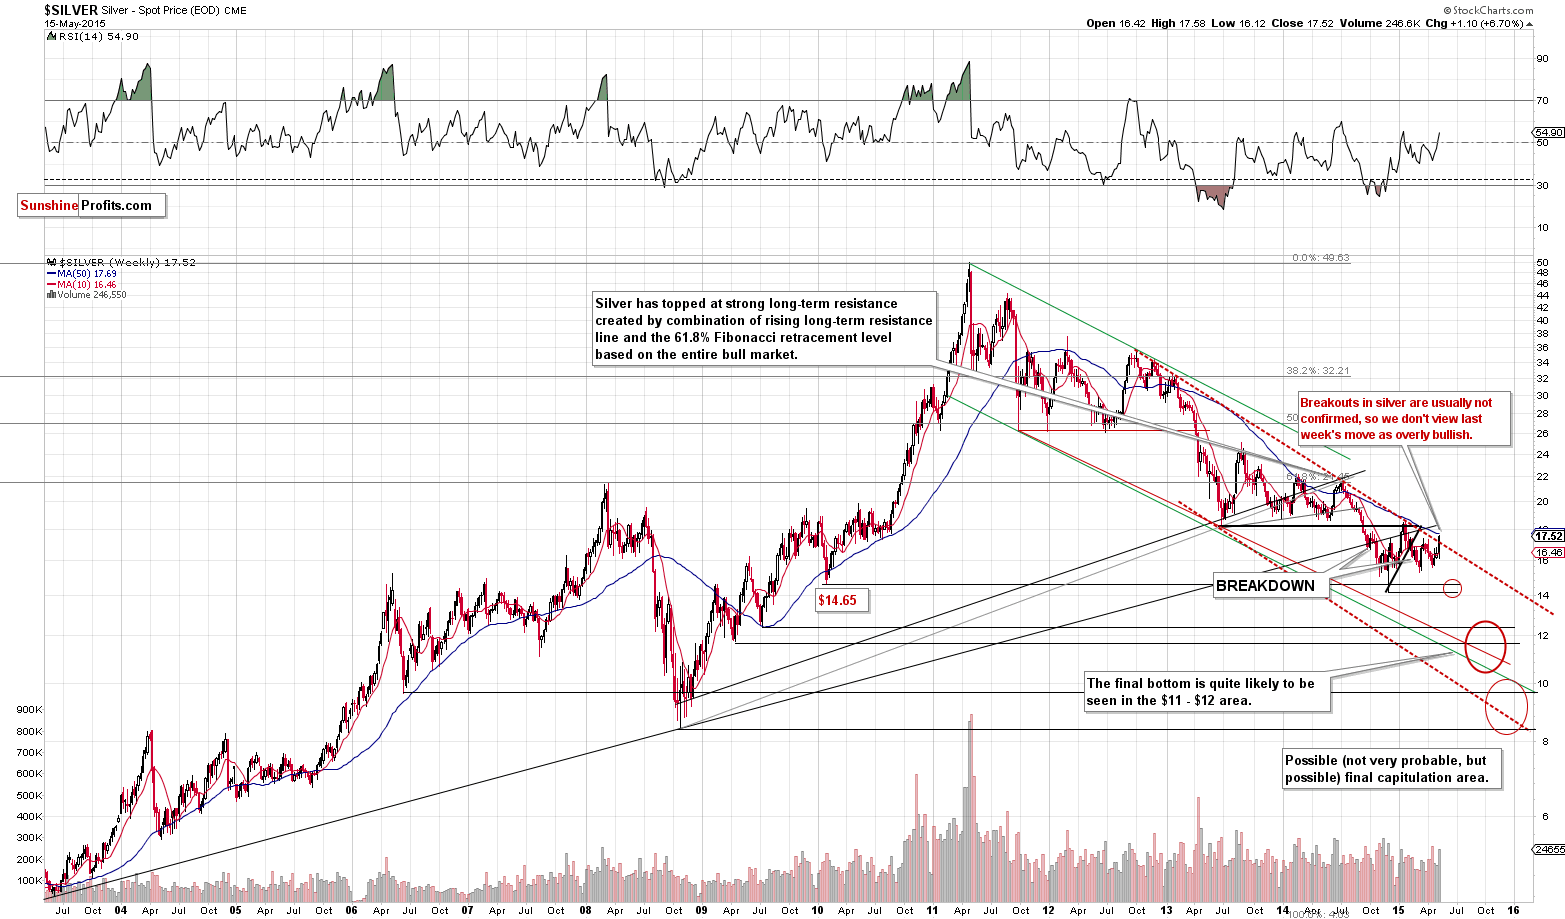
There’s not much new that we can say about silver – our previous comments still reflect our current thoughts on this market:
With regard to silver, there’s also not much that we can say except emphasizing once again that silver doesn’t have much room to rally as the very strong resistance line is very close. On the other hand, there is a lot of room for declines from the current levels.
Silver moved a bit above the resistance line and those who have been following our analysis for some time know that when silver breaks out, it’s usually suspicious, especially if it’s not confirmed by similar moves in gold and mining stocks. Gold is well below its long-term resistance and miners have just failed to move above it once again. Consequently, silver’s rally may seem bullish, but it’s much too early to view it as such, in our view, especially that the silver’s turning point is at hand.
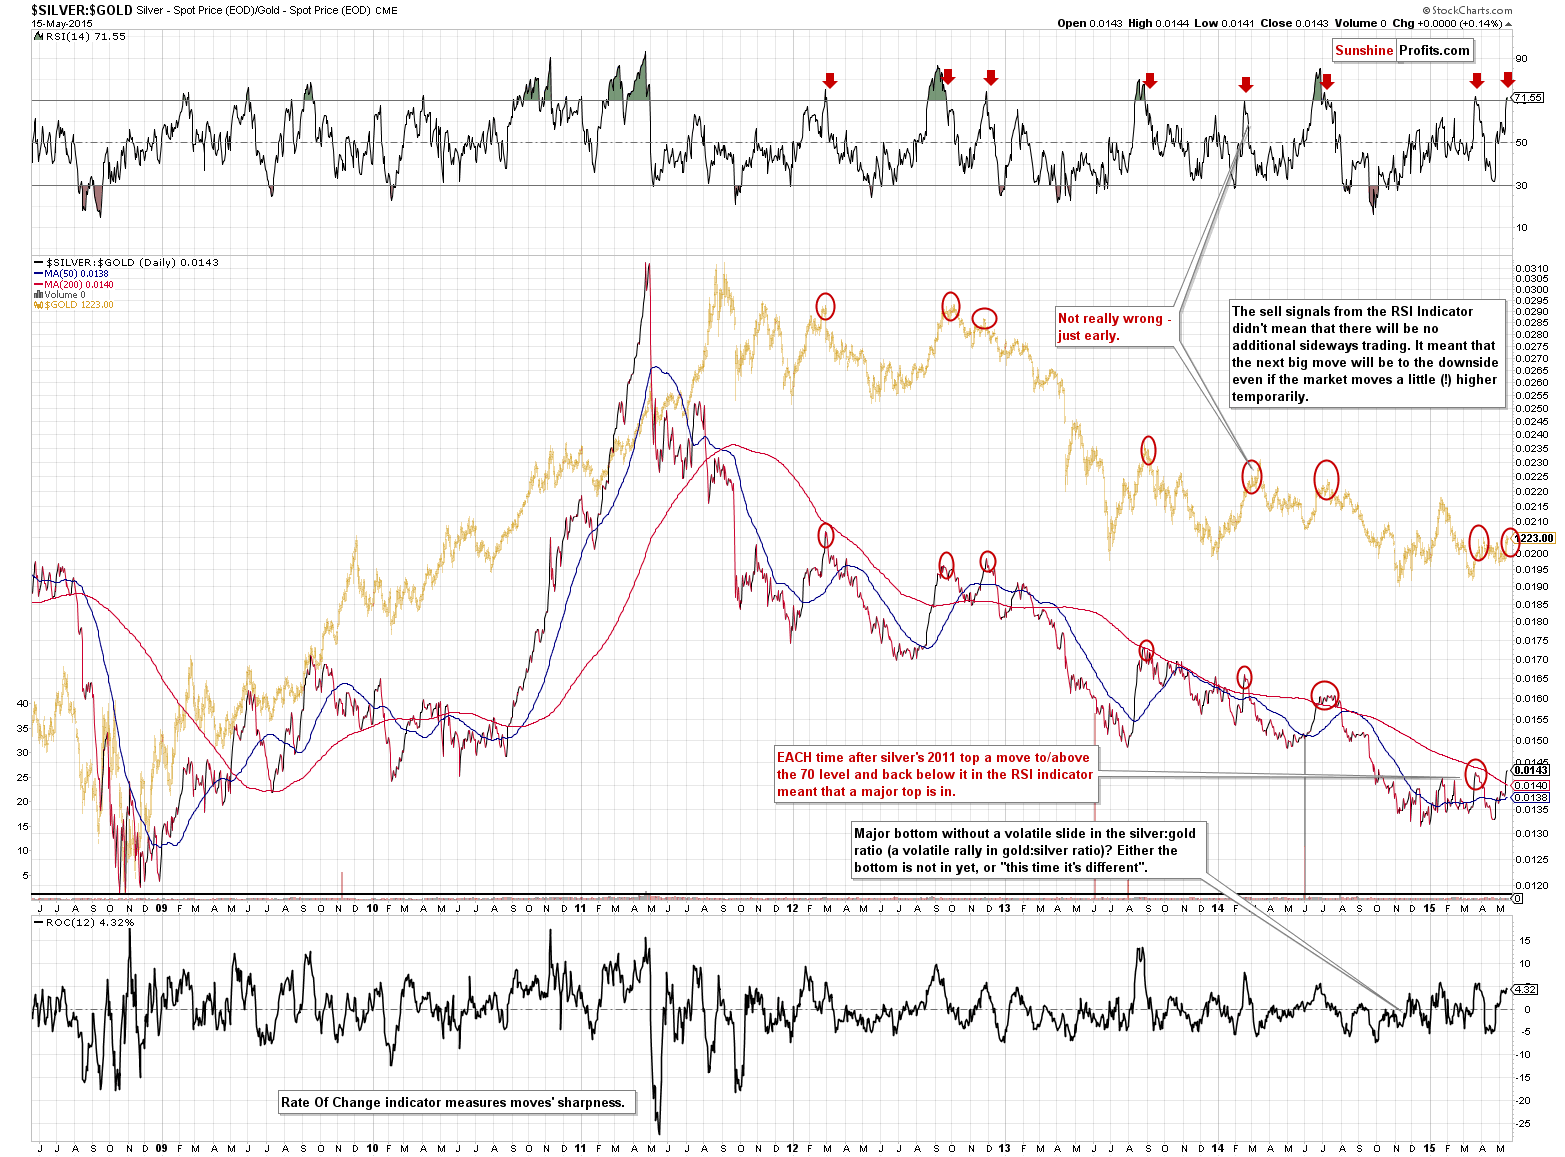
Let’s not forget that the bearish implications of silver’s short-term outperformance remain in place as well:
What about the silver’s outperformance? It’s… flashing a sell signal. If this seems unreasonable, please analyze the above chart – it shows the moments when silver’s outperformance was similar to what we’ve seen this week (especially yesterday). Practically each time when the RSI based on the silver to gold ratio moved to the 70 level, a local top either was in (in most cases) or was about to be formed.
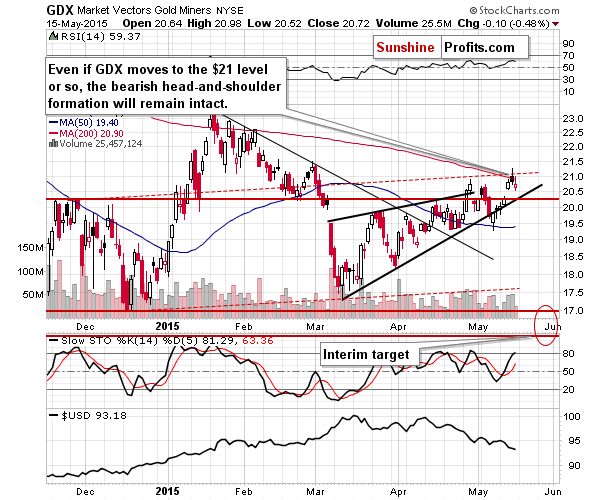
Mining stocks declined on Friday after a daily reversal. The volume that accompanied the decline was not significant, but since gold closed a bit higher and miners did the opposite, we still view this action as significantly bearish (especially that the general stock market didn’t decline). The outlook still remains bearish.
Most importantly, the HUI Index didn’t move above the declining long-term resistance line last week.
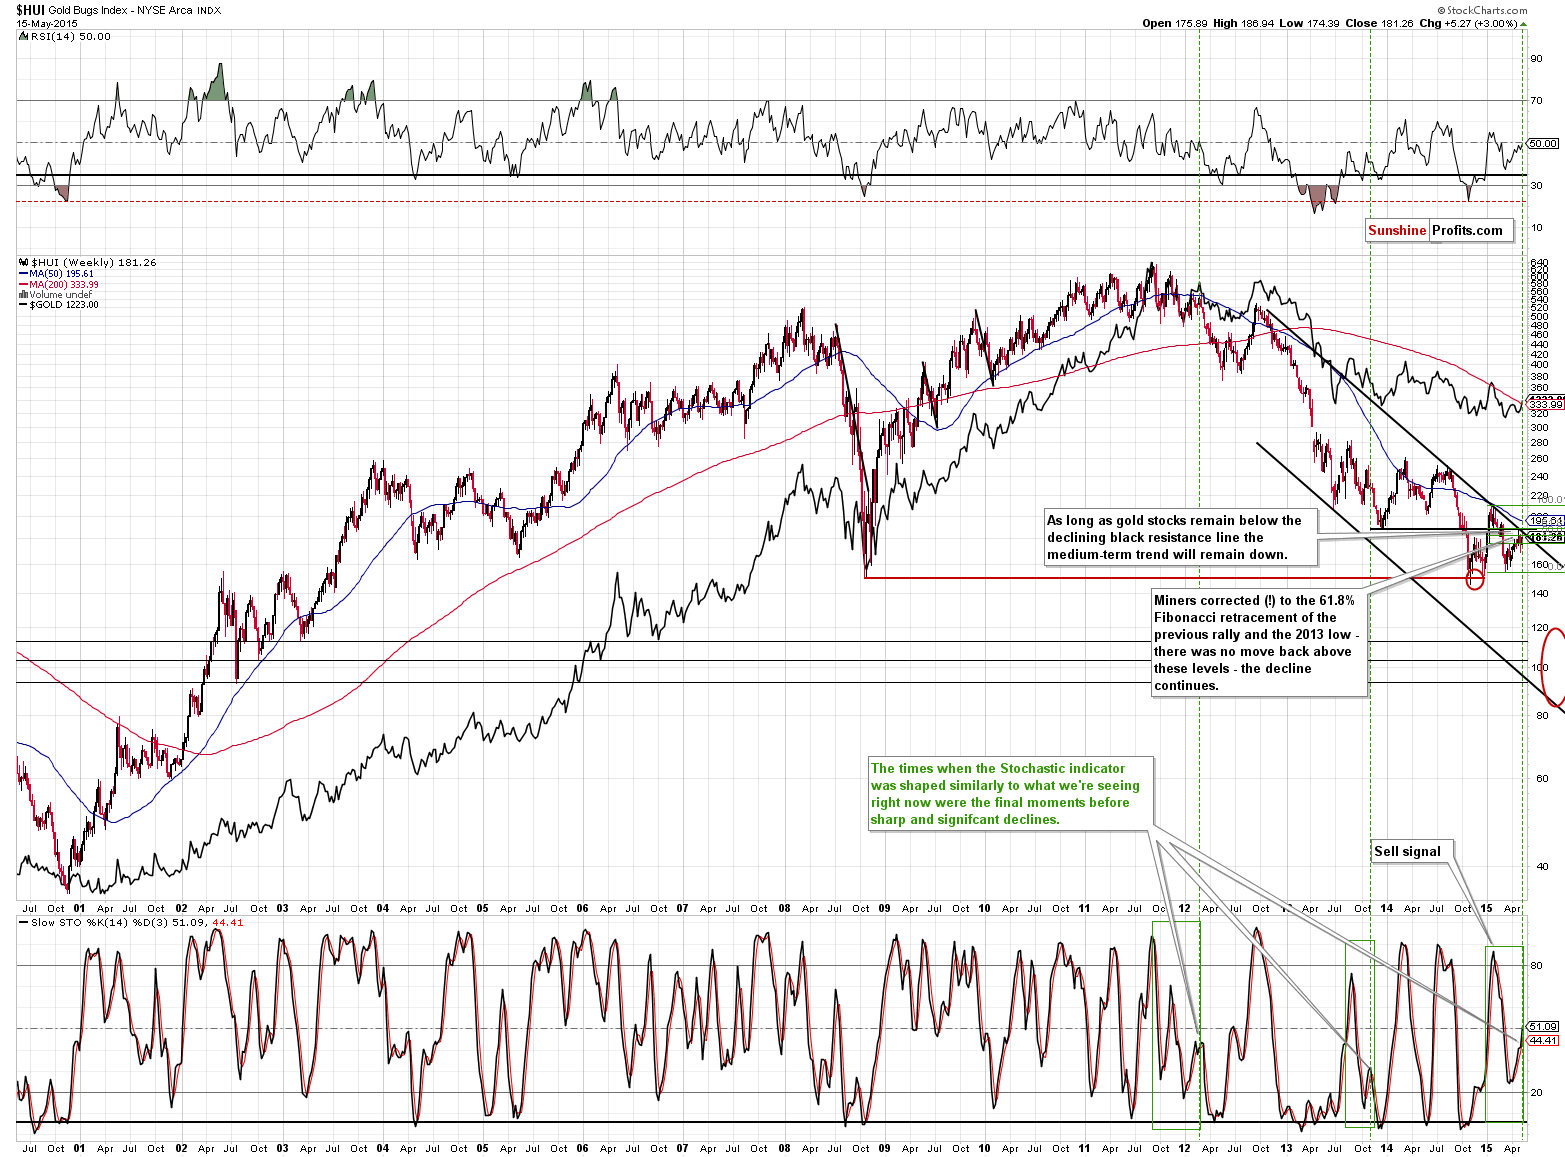
The HUI Index moved right to the declining resistance line (at about 187) on Thursday and reversed almost immediately. It moved even a bit lower on Friday. There was no breakout and the trend remains down.
The potential size of the decline is huge, while the potential size of another move higher is very limited. The implications are bearish and will remain bearish unless we see a confirmed breakout above the declining long-term resistance line.
The above has bearish implications not only for mining stocks, but for gold and silver as well.
Overall, since not much changed on Friday, we can summarize today’s alert in a similar way to what we wrote based on Thursday’s closing prices:
Summing up, quite a lot seems to have happened this week, but actually not much really changed. There were no changes in the long-term pictures although the day-to-day price action seems to have been significant. The small breakout in silver is not something to be concerned with as it was not confirmed by breakouts in gold and mining stocks. Besides, silver is right before its turning point, so it’s likely to reverse shortly. Gold could move higher on a very short-term basis just as the USD Index could decline, but that’s not a sure bet – it’s much more certain (in our view) that the next major downswing will be to the downside, so that’s the move that we think it’s worth focusing on, not the day-to-day price swings.
Please note that just because the price of something is moving higher, it doesn’t mean that outlook for it is improving. If that was the case, the most bullish case for gold would have been in early September 2011 as that’s when gold was after a huge run-up – but it wasn’t a good time to be long – the opposite was much more profitable at that time.
We will keep you – our subscribers – updated.
To summarize:
Trading capital (our opinion): Short (full position) position in gold, silver and mining stocks is justified from the risk/reward perspective with the following stop-loss orders and initial (!) target prices:
- Gold: initial target price: $1,115; stop-loss: $1,253, initial target price for the DGLD ETN: $87.00; stop loss for the DGLD ETN $63.78
- Silver: initial target price: $15.10; stop-loss: $18.13, initial target price for the DSLV ETN: $67.81; stop loss for DSLV ETN $38.44
- Mining stocks (price levels for the GDX ETN): initial target price: $16.63; stop-loss: $21.83, initial target price for the DUST ETN: $23.59; stop loss for the DUST ETN $10.37
In case one wants to bet on lower junior mining stocks' prices, here are the stop-loss details and initial target prices:
- GDXJ: initial target price: $21.17; stop-loss: $28.68
- JDST: initial target price: $14.35; stop-loss: $5.65
Long-term capital (our opinion): No positions
Insurance capital (our opinion): Full position
Please note that a full position doesn’t mean using all of the capital for a given trade. You will find details on our thoughts on gold portfolio structuring in the Key Insights section on our website.
As a reminder – “initial target price” means exactly that – an “initial” one, it’s not a price level at which we suggest closing positions. If this becomes the case (like it did in the previous trade) we will refer to these levels as levels of exit orders (exactly as we’ve done previously). Stop-loss levels, however, are naturally not “initial”, but something that, in our opinion, might be entered as an order.
Since it is impossible to synchronize target prices and stop-loss levels for all the ETFs and ETNs with the main markets that we provide these levels for (gold, silver and mining stocks – the GDX ETF), the stop-loss levels and target prices for other ETNs and ETF (among other: UGLD, DGLD, USLV, DSLV, NUGT, DUST, JNUG, JDST) are provided as supplementary, and not as “final”. This means that if a stop-loss or a target level is reached for any of the “additional instruments” (DGLD for instance), but not for the “main instrument” (gold in this case), we will view positions in both gold and DGLD as still open and the stop-loss for DGLD would have to be moved lower. On the other hand, if gold moves to a stop-loss level but DGLD doesn’t, then we will view both positions (in gold and DGLD) as closed. In other words, since it’s not possible to be 100% certain that each related instrument moves to a given level when the underlying instrument does, we can’t provide levels that would be binding. The levels that we do provide are our best estimate of the levels that will correspond to the levels in the underlying assets, but it will be the underlying assets that one will need to focus on regarding the sings pointing to closing a given position or keeping it open. We might adjust the levels in the “additional instruments” without adjusting the levels in the “main instruments”, which will simply mean that we have improved our estimation of these levels, not that we changed our outlook on the markets. We are already working on a tool that would update these levels on a daily basis for the most popular ETFs, ETNs and individual mining stocks.
Our preferred ways to invest in and to trade gold along with the reasoning can be found in the how to buy gold section. Additionally, our preferred ETFs and ETNs can be found in our Gold & Silver ETF Ranking.
As always, we'll keep you - our subscribers - updated should our views on the market change. We will continue to send out Gold & Silver Trading Alerts on each trading day and we will send additional Alerts whenever appropriate.
The trading position presented above is the netted version of positions based on subjective signals (opinion) from your Editor, and the Tools and Indicators.
As a reminder, Gold & Silver Trading Alerts are posted before or on each trading day (we usually post them before the opening bell, but we don't promise doing that each day). If there's anything urgent, we will send you an additional small alert before posting the main one.
=====
Latest Free Trading Alerts:
S&P 500 index remains close to its late April all-time high. Is holding short position still justified?
We didn’t see much action yesterday. Bitcoin remained below $250, the action was not violent and the volume wasn’t really high. Does this mean that Bitcoin has become boring? Not necessarily. In this alert, we explain why it might not be boring after all.
Bitcoin Trading Alert: Is Bitcoin to Slump Now?
=====
Hand-picked precious-metals-related links:
SGE Withdrawals vs WGC Demand Q1 2015.
Paulson Doesn’t Blink on Gold ETF Stake Even as Prices Sputter
Gold Bulls Rewarded With Best Rally Since January as Dollar Dips
=====
In other news:
Fed's Evans says FOMC could look at rate hike in June
Outlook brighter, but not enough yet for higher rates
Nobel Winner’s Math Is Showing S&P 500 Unhinged From Reality
Hoping for an OPEC supply cut? Forget it
=====
Thank you.
Sincerely,
Przemyslaw Radomski, CFA
Founder, Editor-in-chief
Gold & Silver Trading Alerts
Forex Trading Alerts
Oil Investment Updates
Oil Trading Alerts

