

Briefly: In our opinion, a speculative short position (full) in gold, silver and mining stocks is justified from the risk/reward point of view.
Gold, silver and mining stock rallied once again yesterday and the volume that accompanied these moves was once again quite significant. What are the implications of this volatile action in the precious metals sector?
Once again, very little changed from the medium-term point of view. This might seem surprising given the size of yesterday’s moves, but that is indeed the case given that we are aiming to profit on the next big downswing and not a mediocre / small one. What happened this week seems to have simply postponed the big decline – not invalidated it. Let’s take a look at the charts, starting with gold (charts courtesy of http://stockcharts.com).
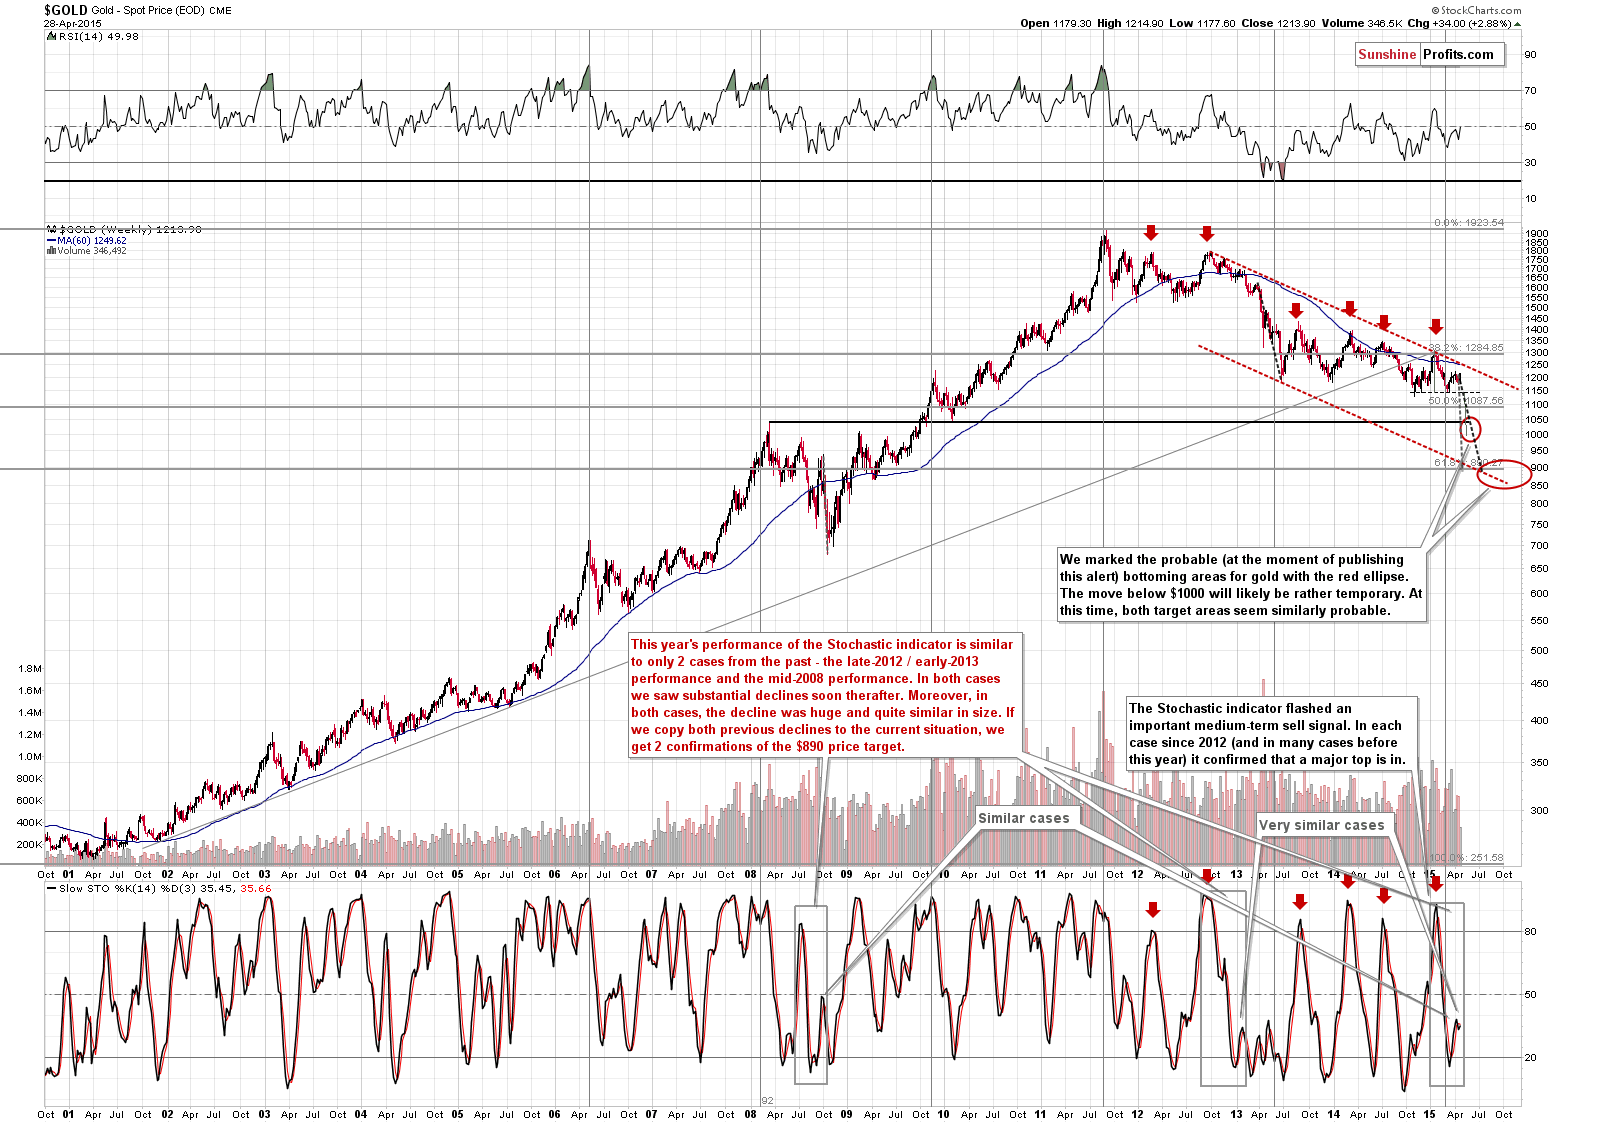
How much did yesterday’s rally change on the above chart compared with when we last discussed it (on Friday)?
Once again our reply is: nothing. The sell signal from the Stochastic indicator remains in place and the shape of the indicator is still very similar to what we saw before major plunges in the past. The medium-term outlook is very bearish based on the above chart.
What if we compare gold’s performance to the performance of bonds?
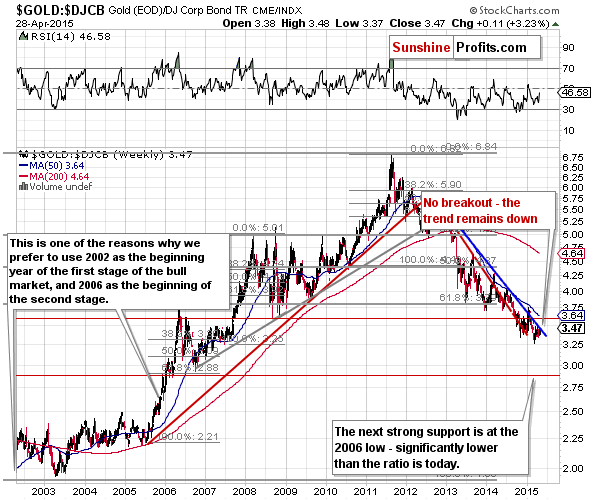
We’ll see that the trend remains down and that this week’s move didn’t take the gold to bonds ratio above the declining resistance line. The outlook is still bearish.
With the medium-term outlook being bearish, perhaps there are strong bullish implications in the short-term chart?
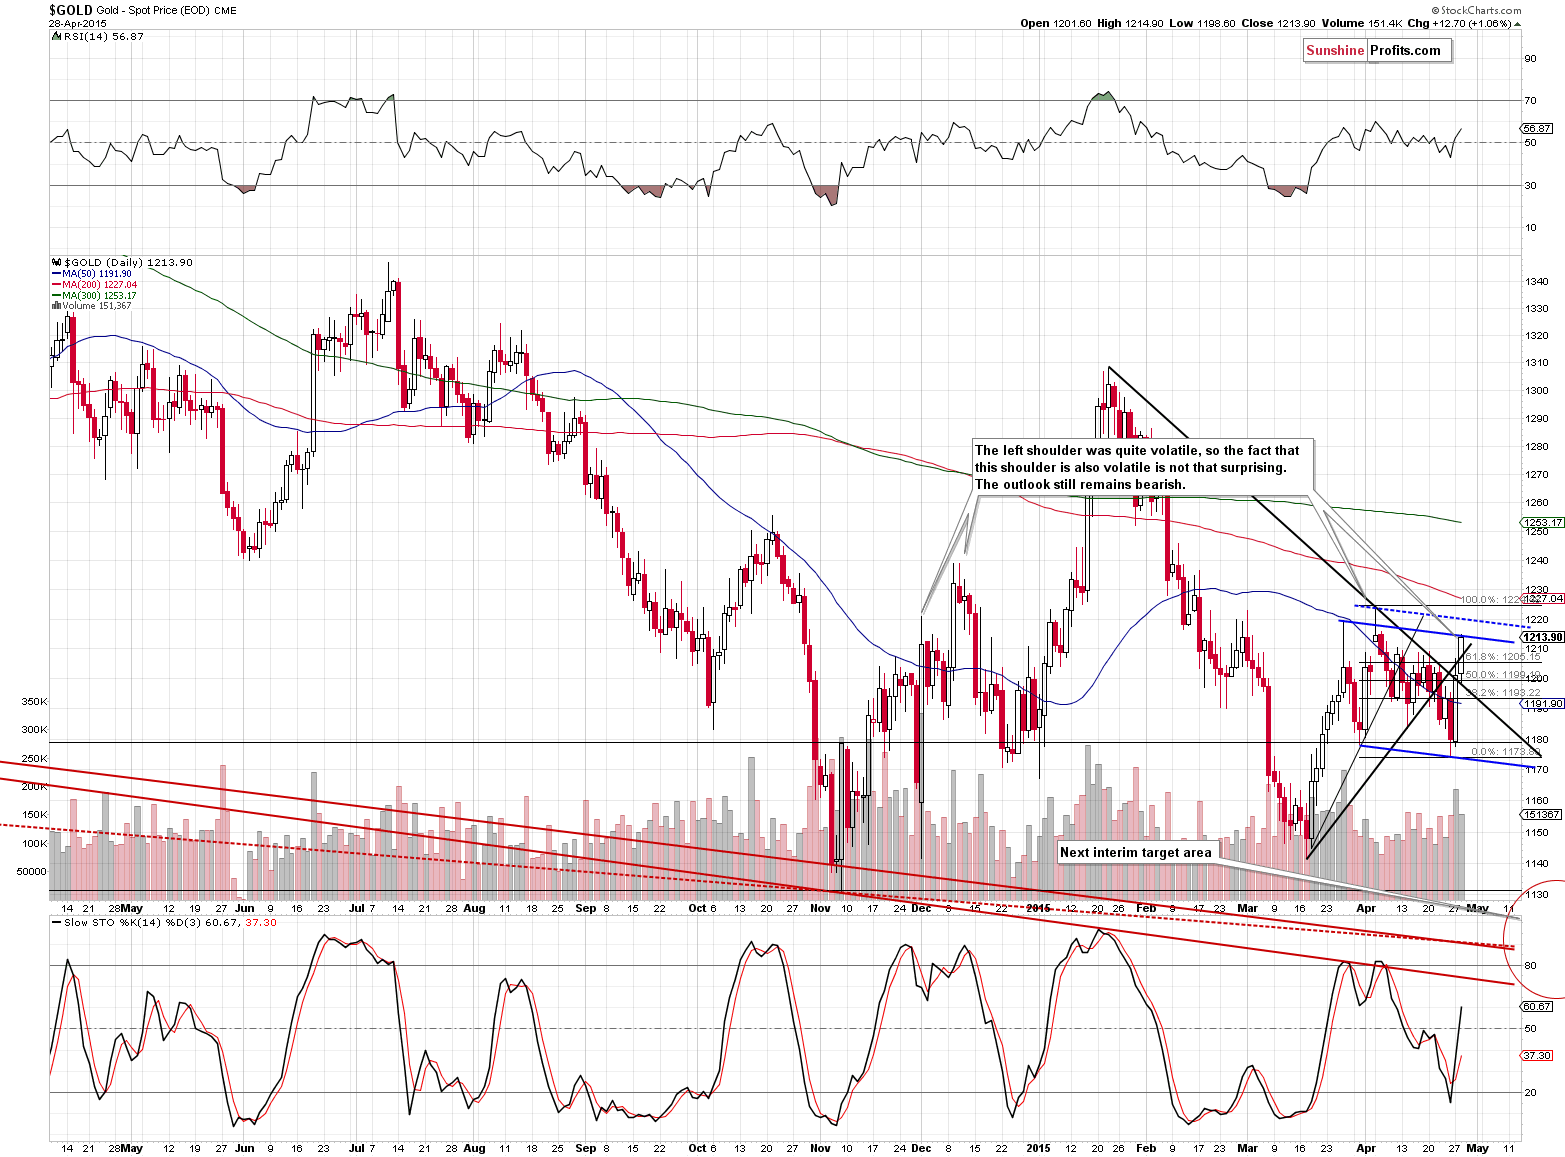
This week’s rally does indeed seem strong, but only on a very short-term basis. The volume that accompanied Tuesday’s move higher was already lower than what we saw on Monday, so perhaps the move is close to being over or even already over.
More importantly, though, gold moved to a resistance line that we get by drawing a small head-and-shoulders pattern based on the March and April highs. It could stop this rally. However, if it doesn’t, then the next resistance is at about $1,220 at the line that is parallel to the line based on late-March and April lows. Consequently, even if gold didn’t top yesterday, it’s not likely to move much higher before it does.
We saw a breakout above the declining resistance line, but at this time it’s unconfirmed and thus it’s only a little bullish.
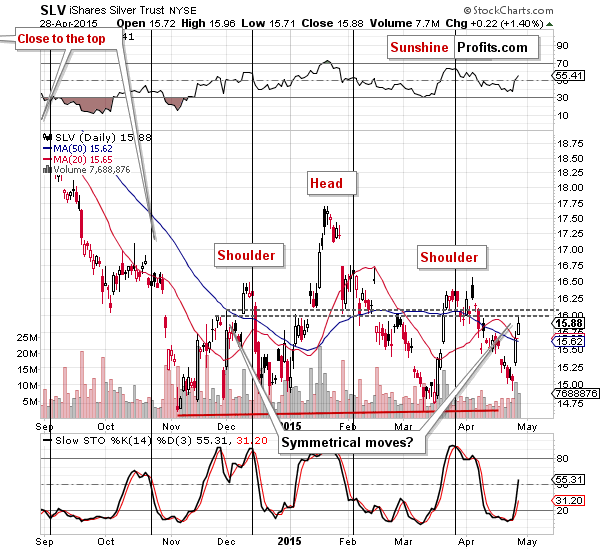
In the case of silver we see something even more interesting. The head-and-shoulders pattern that we discussed previously hasn’t been invalidated this week. In fact, it’s developing in a quite symmetrical way. Please note the sharp decline and comeback that we saw in late November / early December 2014. This move is quite symmetrical to the recent decline and the current rally.
Consequently, the bearish head-and-shoulders formation remains intact and this week’s rally is much less concerning than it seems. Moreover, please note that there were 2 local tops back in 2014 and we marked them with horizontal dashed lines. Silver could move a bit higher, to the higher top before it declines (and the bearish outlook would not be invalidated by such action).
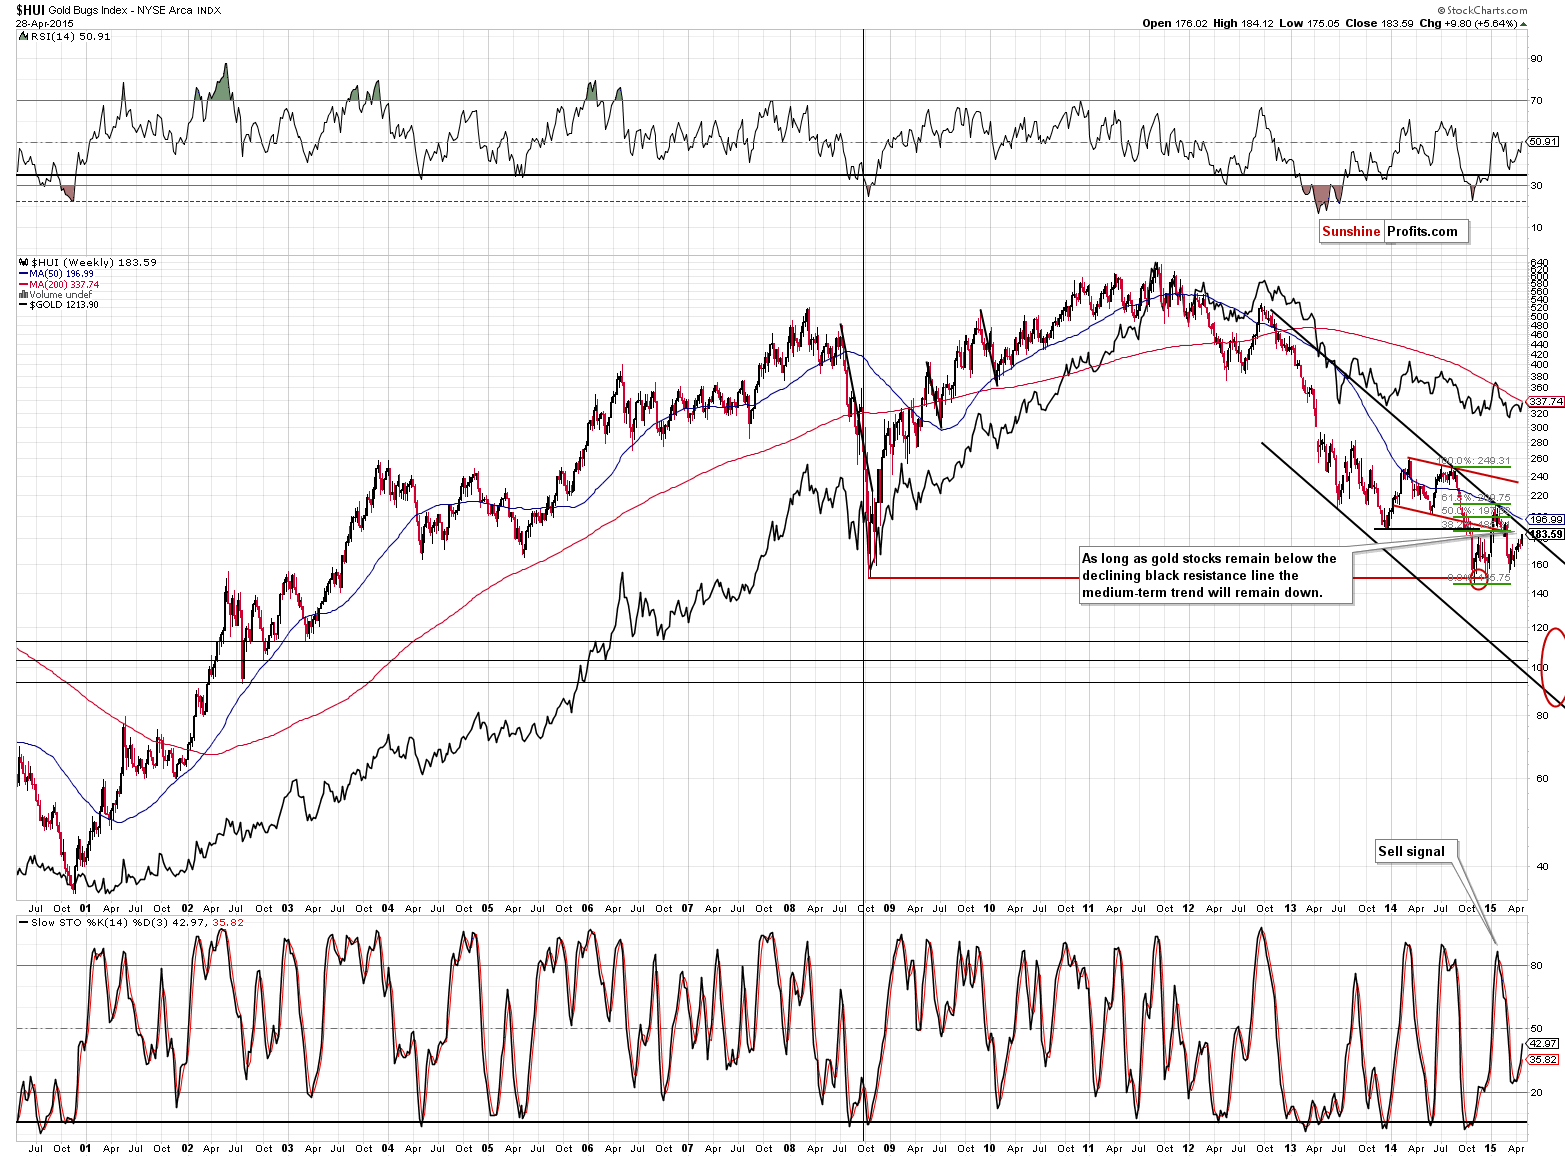
Gold stocks have a major resistance line just ahead so they are not likely to move significantly either, if at all. The declining long-term resistance line is currently at about 190, so if the rally continues, it’s not likely to move above this level. The medium-term trend remains down.
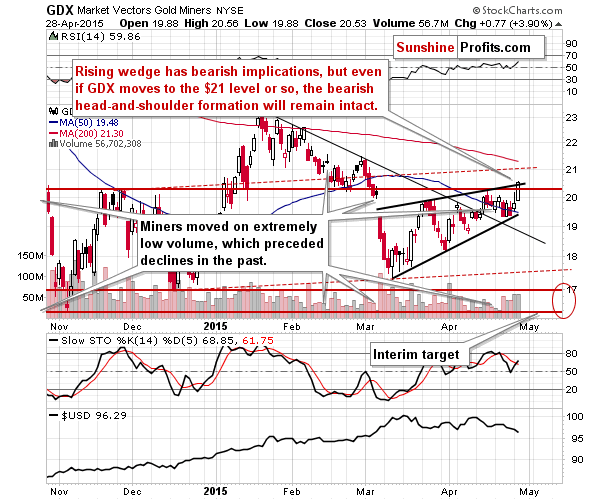
On a short-term basis we see a small breakout above the November 2014 high, but that’s something that can happen. We previously wrote that the head-and-shoulders pattern could form in 2 ways: either with both shoulders at the same level in absolute terms or at analogous levels in relative terms. The latter means that the right shoulder would be higher than the left one just like it is the case with the December 2014 and March 2015 bottoms. Consequently, even if we see a move to $21, the head-and-shoulders formation and its bearish implications will remain in place.
Is there anything that could be taking place this week that could perhaps be partially responsible for the rally in precious metals?
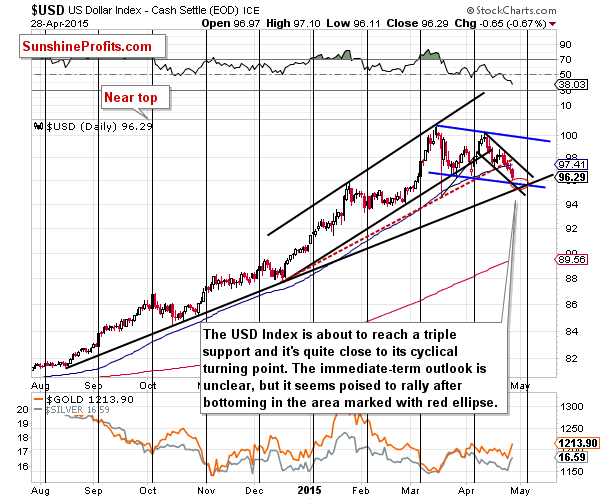
Yes – the breakdown in the USD Index. In the previous several days the USD and gold were not moving in tune, so we didn’t feature the USD chart in our alerts, but it could have been the case that the breakdown below the rising dashed support line and the 50-day moving average triggered a positive reaction among gold and silver investors.
If this was the case, then we have another reason to believe that the days of this rally in PMs are numbered. The USD Index is about to reach the downside target area that is created by 3 support lines: lower borders of 2 declining trend channels and the medium-term support line. Additionally, the cyclical turning point is just around the corner, which makes a turnaround even more likely.
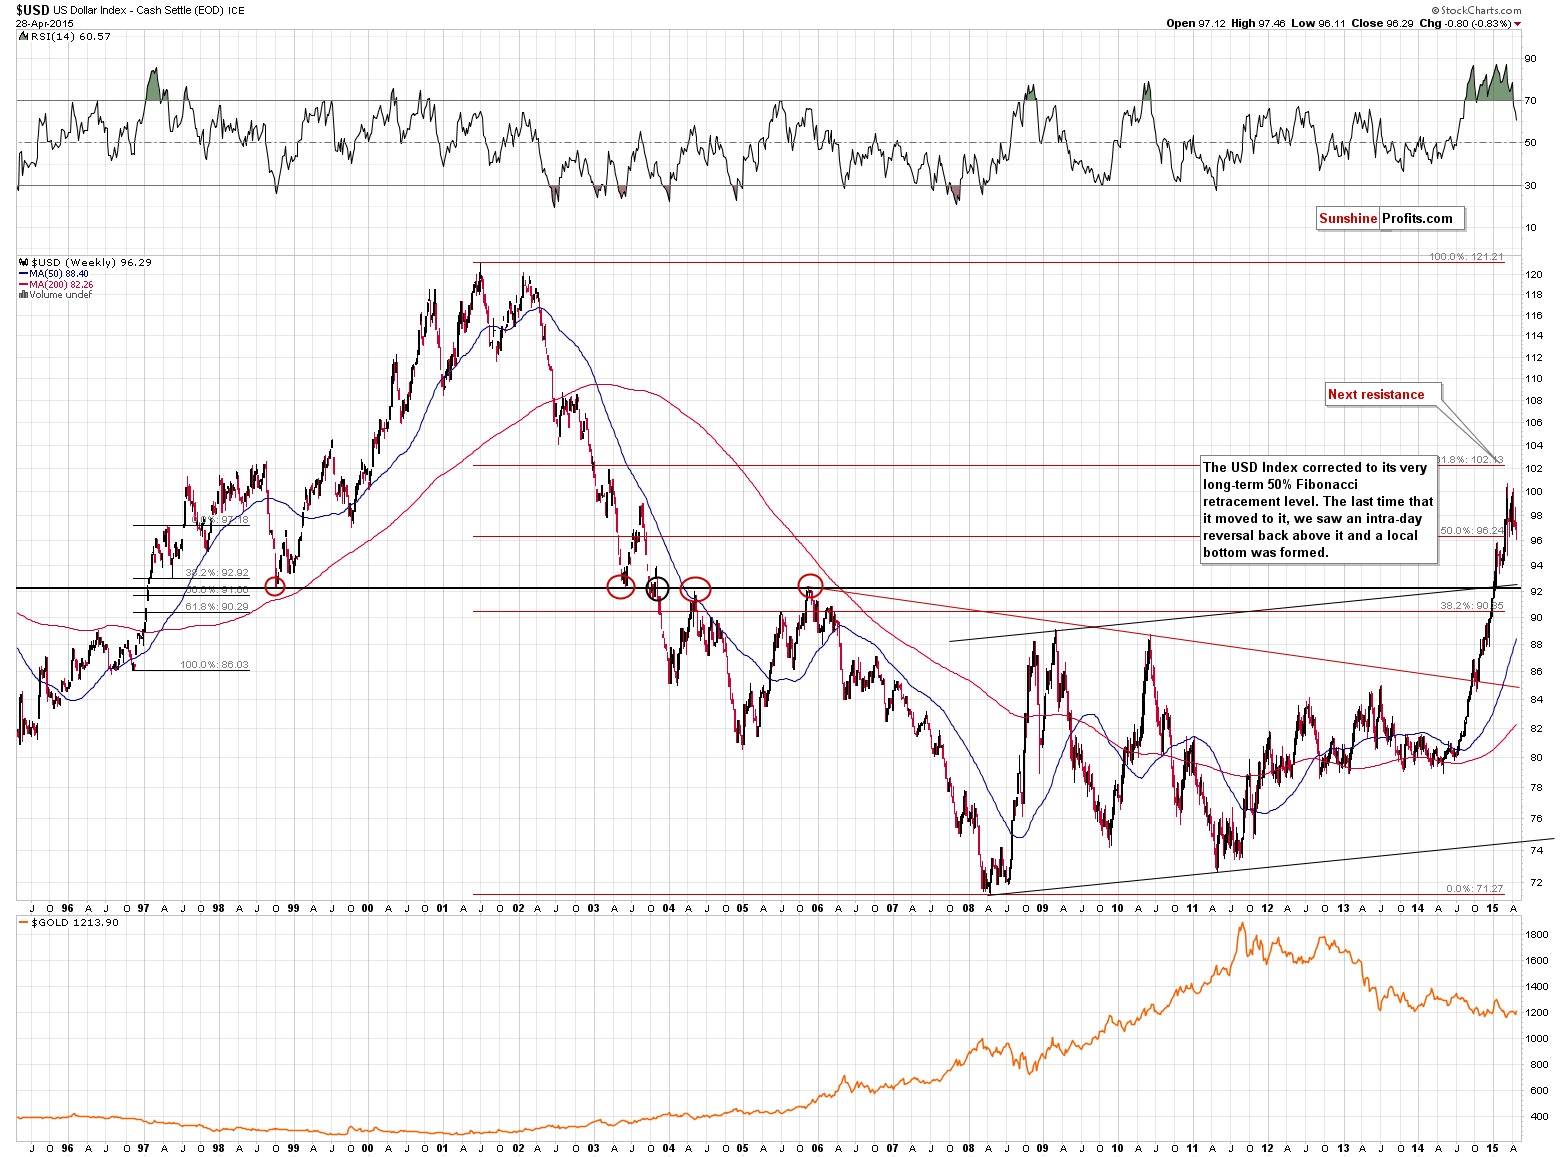
Actually, we may not even see an additional move lower – the bottom could be in as the USD reached its 50% Fibonacci retracement based on the entire 2001 – 2008 decline. It was temporarily broken on an intra-day basis earlier this year and that marked the local bottom.
Summing up, the medium-term decline is not threatened by this week’s upswing – it seems it was simply delayed. Furthermore, please note that the precious metals sector could decline right away or move a bit higher (we have resistance levels a bit above the current prices of gold, silver and mining stocks) before the decline resumes. Because of the former scenario, we think that it’s justified from the risk/reward point of view to keep the short positions intact. We realize that temporary decreases in profits are not a pleasant thing to watch, but let’s not forget that this trade is not over and that the medium-term outlook hasn’t changed, so the odds are that the profits will become much bigger
We will keep you – our subscribers – updated.
To summarize:
Trading capital (our opinion): Short (full position) position in gold, silver and mining stocks is justified from the risk/reward perspective with the following stop-loss orders and initial (!) target prices:
- Gold: initial target price: $1,115; stop-loss: $1,253, initial target price for the DGLD ETN: $87.00; stop loss for the DGLD ETN $63.78
- Silver: initial target price: $15.10; stop-loss: $17.63, initial target price for the DSLV ETN: $67.81; stop loss for DSLV ETN $44.97
- Mining stocks (price levels for the GDX ETN): initial target price: $16.63; stop-loss: $21.83, initial target price for the DUST ETN: $23.59; stop loss for the DUST ETN $10.37
In case one wants to bet on lower junior mining stocks' prices, here are the stop-loss details and initial target prices:
- GDXJ: initial target price: $21.17; stop-loss: $27.31
- JDST: initial target price: $14.35; stop-loss: $6.18
Long-term capital (our opinion): No positions
Insurance capital (our opinion): Full position
Please note that a full position doesn’t mean using all of the capital for a given trade. You will find details on our thoughts on gold portfolio structuring in the Key Insights section on our website.
As a reminder – “initial target price” means exactly that – an “initial” one, it’s not a price level at which we suggest closing positions. If this becomes the case (like it did in the previous trade) we will refer to these levels as levels of exit orders (exactly as we’ve done previously). Stop-loss levels, however, are naturally not “initial”, but something that, in our opinion, might be entered as an order.
Since it is impossible to synchronize target prices and stop-loss levels for all the ETFs and ETNs with the main markets that we provide these levels for (gold, silver and mining stocks – the GDX ETF), the stop-loss levels and target prices for other ETNs and ETF (among other: UGLD, DGLD, USLV, DSLV, NUGT, DUST, JNUG, JDST) are provided as supplementary, and not as “final”. This means that if a stop-loss or a target level is reached for any of the “additional instruments” (DGLD for instance), but not for the “main instrument” (gold in this case), we will view positions in both gold and DGLD as still open and the stop-loss for DGLD would have to be moved lower. On the other hand, if gold moves to a stop-loss level but DGLD doesn’t, then we will view both positions (in gold and DGLD) as closed. In other words, since it’s not possible to be 100% certain that each related instrument moves to a given level when the underlying instrument does, we can’t provide levels that would be binding. The levels that we do provide are our best estimate of the levels that will correspond to the levels in the underlying assets, but it will be the underlying assets that one will need to focus on regarding the sings pointing to closing a given position or keeping it open. We might adjust the levels in the “additional instruments” without adjusting the levels in the “main instruments”, which will simply mean that we have improved our estimation of these levels, not that we changed our outlook on the markets. We are already working on a tool that would update these levels on a daily basis for the most popular ETFs, ETNs and individual mining stocks.
Our preferred ways to invest in and to trade gold along with the reasoning can be found in the how to buy gold section. Additionally, our preferred ETFs and ETNs can be found in our Gold & Silver ETF Ranking.
As always, we'll keep you - our subscribers - updated should our views on the market change. We will continue to send out Gold & Silver Trading Alerts on each trading day and we will send additional Alerts whenever appropriate.
The trading position presented above is the netted version of positions based on subjective signals (opinion) from your Editor, and the Tools and Indicators.
As a reminder, Gold & Silver Trading Alerts are posted before or on each trading day (we usually post them before the opening bell, but we don't promise doing that each day). If there's anything urgent, we will send you an additional small alert before posting the main one.
=====
Latest Free Trading Alerts:
Last week’s disappointing U.S. data on employment, home sales and industrial production weighed on investors’ sentiment, pushing back expectations on a first rate hike in June and making the greenback weaker. Thanks to these circumstances, AUD/USD extended gains and broke above important resistance levels. How high could the exchange rate go in the coming days?
Forex Trading Alert: AUD/USD Rallies!
We saw depreciation over the weekend. This was consistent with the short-term bearish outlook and the volume was up on the last day of this depreciation pattern. Yesterday, the action was completely different. We think that there might be counterintuitive signs for Bitcoin traders here.
Bitcoin Trading Alert: Counterintuitive Signs for Bitcoin
=====
Hand-picked precious-metals-related links:
New trade initiatives to spur gold demand
LSE could be getting another 1 million ounce/year gold miner
What’s behind El Salvador’s massive gold reserves sale?
=====
In other news:
Europe’s Deflation Specter Moving On
Fed meeting seen as chance to nudge markets on rate hike timing
ECB Dominates Greece Saga as Dijsselbloem Rejects Tsipras Charge
=====
Thank you.
Sincerely,
Przemyslaw Radomski, CFA
Founder, Editor-in-chief
Gold & Silver Trading Alerts
Forex Trading Alerts
Oil Investment Updates
Oil Trading Alerts

