

Briefly: In our opinion, a speculative short position (full) in gold, silver and mining stocks is justified from the risk/reward point of view.
Gold and – especially – silver rallied yesterday and the volume that accompanied these moves was relatively significant. What are the implications of this volatile action in the precious metals sector?
The “surprise” here is that there are no changes in our view. However, we would like to put the emphasis on the fact that we are not simply “keeping a position” in order not to appear as those who changed their mind or anything like that. Consequently, we will comment on the charts and then summarize today’s alert just like we didn’t have any speculative position whatsoever and see if we would arrive at the same conclusion (that a short one is justified from the risk/reward point of view).
In fact, that’s what we’re doing each day, but we’re not writing about it – we always look at the market as objectively and independently as possible and if on any day we would arrive at a different conclusion and with a different outlook – we would simply update it. This approach makes one “free” from several emotional biases that are associated with trading and investing (like the “conservatism bias” – ignoring new information in order not to change one’s mind). Of course, there’s nothing wrong with keeping one’s opinions intact if there are reasons for which the “new information” doesn’t change the opinion – however, there is a problem if the “new information” is not analyzed at all and is discarded. In other words, we don’t aim to tell the market what it should do – instead we’re always aiming to discover what it’s likely to do based on the most recent details.
Having said that, let’s look at the charts, starting with gold (charts courtesy of http://stockcharts.com).
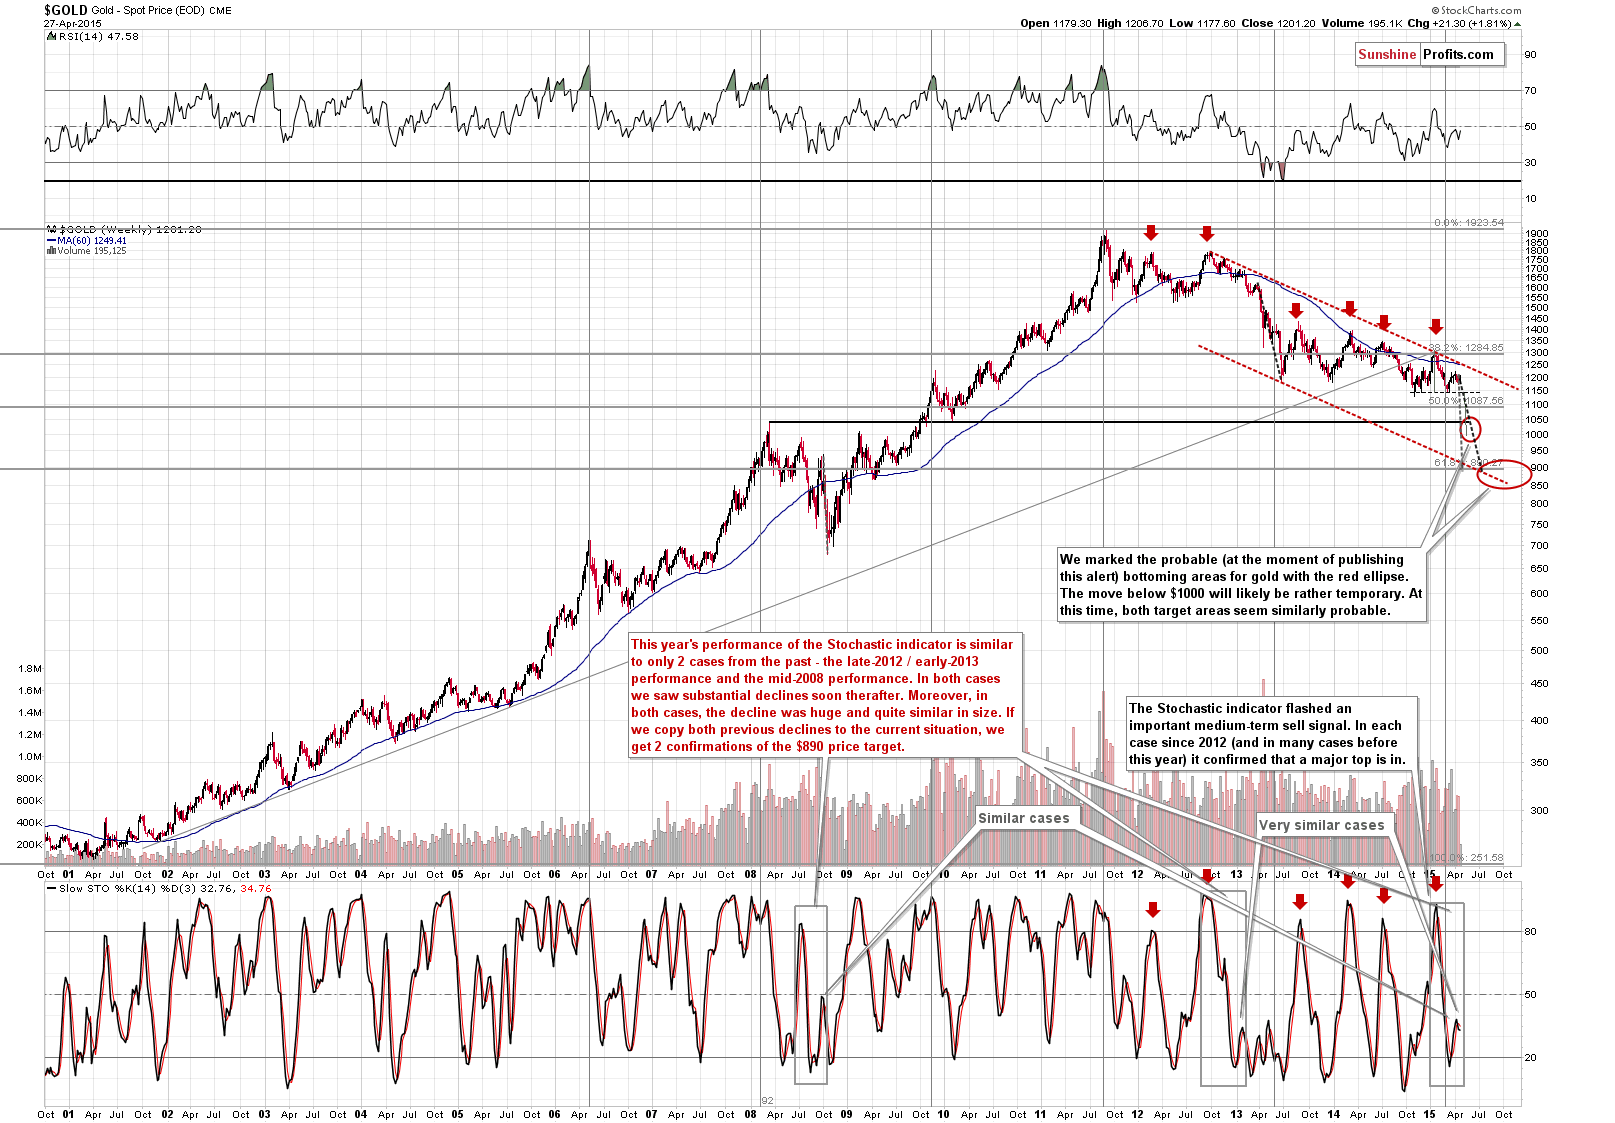
How much did yesterday’s rally change on the above chart since we last discussed it (on Friday)?
Nothing. The sell signal from the Stochastic indicator remains in place and the shape of the indicator is still very similar to what we saw before major plunges in the past. The medium-term outlook is very bearish based on the above chart.
What if we compare gold’s performance to the performance of bonds?
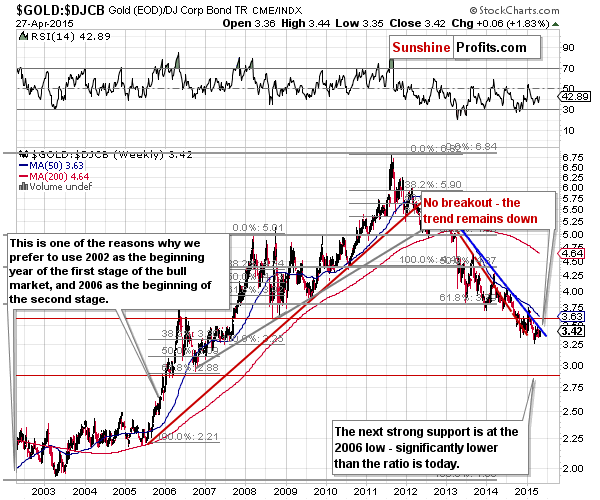
We’ll see that the trend remains down and that yesterday’s move didn’t take the gold to bonds ratio above the declining resistance line. The outlook is bearish.
With the medium-term outlook being bearish, perhaps there are strong bullish implications in the short-term chart?
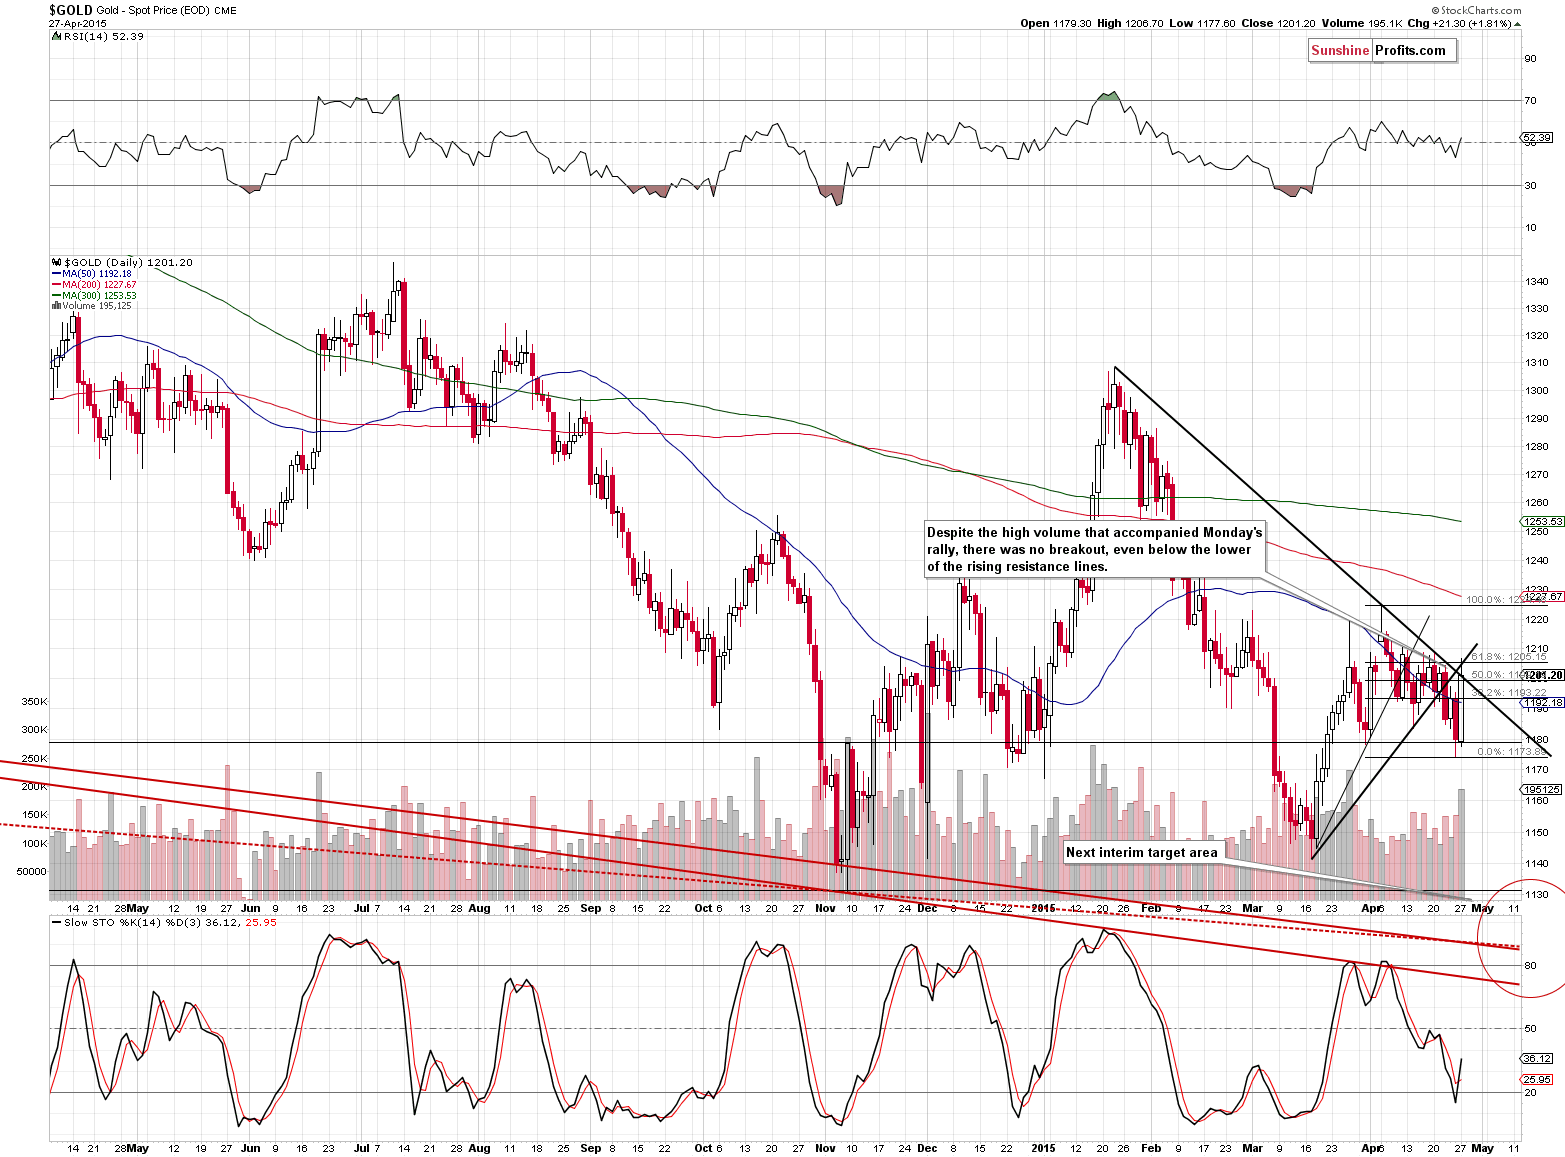
It may seem strange at the first sight, because gold rallied on strong volume yesterday, but actually little changed. There was no breakout – not even above the lower of the rising support lines.
The Stochastic indicator flashed a buy signal, but as you may recall from our previous alerts, this indicator doesn’t really work for the short term (note the lack of rally in mid-Feb 2015 after the buy signal and the same kind of performance between July and September 2014 when this indicator flashed buy signals) – it’s a great tool for the medium term, but as far as short term is concerned, the sell signals are much more reliable than the buy ones. Consequently, yesterday’s buy signal is of little meaning.
The only bullish thing about the above chart is the size of the rally and the accompanying volume. The implications of this chart are insignificantly bullish.
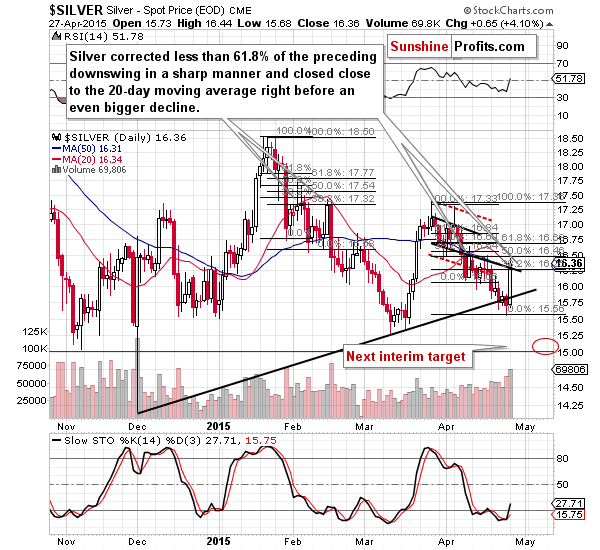
Moving on to silver, we saw an even more profound rally, which probably seemed encouraging to many investors and traders. However, having observed silver’s behavior for many years, we interpret it differently. It was quite often the case, especially in the recent past that silver’s rallies and/or breakouts were the final chance to either exit long positions or to enter the short ones. Consequently, we doubt the bullish implications of the move.
Please note that so far we’ve seen 3 cases this year when silver rallied more or less to its 20-day moving average (but not above the 61.8% Fibonacci retracement level) and they all resulted in lower prices. The rally in mid-February was just as sharp and “promising” as what we saw yesterday – and yet, silver declined shortly thereafter.
Overall, we think that the implications of the above chart are bearish… especially when we contrast it with the weak performance of mining stocks.
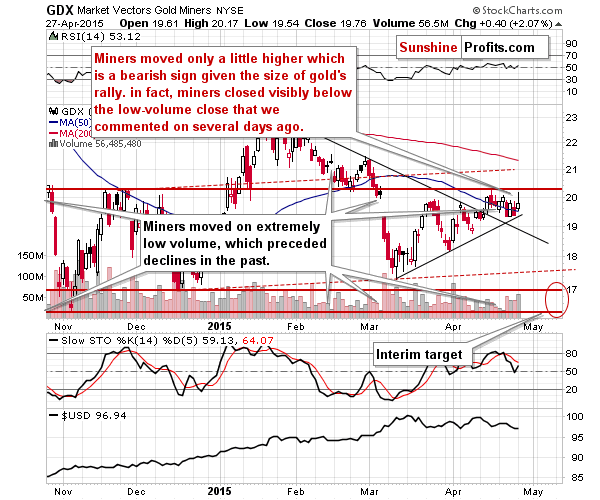
That’s right, you read it correctly – mining stocks were very weak yesterday. Gold moved much higher and miners didn’t even manage to close above the April 21 close, when they had rallied on tiny volume (we had doubled the size of the short position based on this session).
The volume on which miners moved higher was strong yesterday, but it’s not a bullish sign in the light of the fact that miners reversed their direction intraday and formed a daily shooting star candlestick. This candlestick suggests a reversal and its implications are bearish.
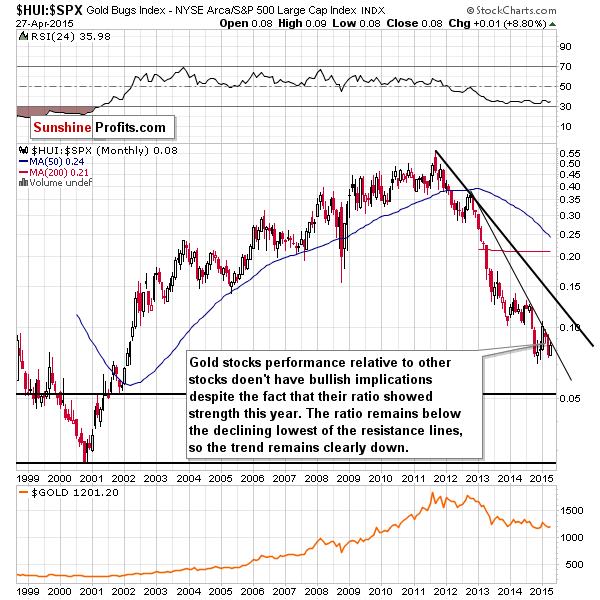
A comparison between gold stocks and other stocks also yields bearish implications as the medium-term trend remains unbroken and suggests another slide.
Summing up, we have multiple charts that point to lower precious metals prices in the near future and only one that’s insignificantly bullish. The overall implications are bearish as gold’s move higher on strong volume that didn’t result in a breakout is not enough to change the bearish implications of the other charts. Based on silver’s and mining stocks’ performance we think that short positions in the precious metals sector are currently justified from the risk/reward point of view. Since we already have short positions in place, it seems that no changes in these positions are required at this time. Even though it seems that a lot happened yesterday, not much changed.
We will keep you – our subscribers – updated.
To summarize:
Trading capital (our opinion): Short (full position) position in gold, silver and mining stocks is justified from the risk/reward perspective with the following stop-loss orders and initial (!) target prices:
- Gold: initial target price: $1,115; stop-loss: $1,253, initial target price for the DGLD ETN: $87.00; stop loss for the DGLD ETN $63.78
- Silver: initial target price: $15.10; stop-loss: $17.63, initial target price for the DSLV ETN: $67.81; stop loss for DSLV ETN $44.97
- Mining stocks (price levels for the GDX ETN): initial target price: $16.63; stop-loss: $21.83, initial target price for the DUST ETN: $23.59; stop loss for the DUST ETN $12.23
In case one wants to bet on lower junior mining stocks' prices, here are the stop-loss details and initial target prices:
- GDXJ: initial target price: $21.17; stop-loss: $27.31
- JDST: initial target price: $14.35; stop-loss: $6.18
Long-term capital (our opinion): No positions
Insurance capital (our opinion): Full position
Please note that a full position doesn’t mean using all of the capital for a given trade. You will find details on our thoughts on gold portfolio structuring in the Key Insights section on our website.
As a reminder – “initial target price” means exactly that – an “initial” one, it’s not a price level at which we suggest closing positions. If this becomes the case (like it did in the previous trade) we will refer to these levels as levels of exit orders (exactly as we’ve done previously). Stop-loss levels, however, are naturally not “initial”, but something that, in our opinion, might be entered as an order.
Since it is impossible to synchronize target prices and stop-loss levels for all the ETFs and ETNs with the main markets that we provide these levels for (gold, silver and mining stocks – the GDX ETF), the stop-loss levels and target prices for other ETNs and ETF (among other: UGLD, DGLD, USLV, DSLV, NUGT, DUST, JNUG, JDST) are provided as supplementary, and not as “final”. This means that if a stop-loss or a target level is reached for any of the “additional instruments” (DGLD for instance), but not for the “main instrument” (gold in this case), we will view positions in both gold and DGLD as still open and the stop-loss for DGLD would have to be moved lower. On the other hand, if gold moves to a stop-loss level but DGLD doesn’t, then we will view both positions (in gold and DGLD) as closed. In other words, since it’s not possible to be 100% certain that each related instrument moves to a given level when the underlying instrument does, we can’t provide levels that would be binding. The levels that we do provide are our best estimate of the levels that will correspond to the levels in the underlying assets, but it will be the underlying assets that one will need to focus on regarding the sings pointing to closing a given position or keeping it open. We might adjust the levels in the “additional instruments” without adjusting the levels in the “main instruments”, which will simply mean that we have improved our estimation of these levels, not that we changed our outlook on the markets. We are already working on a tool that would update these levels on a daily basis for the most popular ETFs, ETNs and individual mining stocks.
Our preferred ways to invest in and to trade gold along with the reasoning can be found in the how to buy gold section. Additionally, our preferred ETFs and ETNs can be found in our Gold & Silver ETF Ranking.
As always, we'll keep you - our subscribers - updated should our views on the market change. We will continue to send out Gold & Silver Trading Alerts on each trading day and we will send additional Alerts whenever appropriate.
The trading position presented above is the netted version of positions based on subjective signals (opinion) from your Editor, and the Tools and Indicators.
As a reminder, Gold & Silver Trading Alerts are posted before or on each trading day (we usually post them before the opening bell, but we don't promise doing that each day). If there's anything urgent, we will send you an additional small alert before posting the main one.
=====
Latest Free Trading Alerts:
S&P 500 index remains close to its new all-time high. Will this uptrend accelerate?
Stock Trading Alert: Positive Expectations Ahead Of Apple's First Quarter Earnings Release
Although crude oil moved lower after the market’s open, the combination of a weaker greenback and the Baker Hughes report supported the price, triggering a rebound. In these circumstances, light crude closed the day on its key support/resistance line. Where the commodity head next?
Oil Trading Alert: Trading In Narrow Range – For Now
=====
Hand-picked precious-metals-related links:
Russia resumes gold stockpiling as rouble crisis eases
London Gold Trade Probably Won’t Move to Exchange, LBMA Says
=====
In other news:
Tsipras Says Greek People May Have to Rule on Final Deal
Varoufakis sidelined but Greece still in danger
Japan’s downgrade: Why no one seems to care
=====
Thank you.
Sincerely,
Przemyslaw Radomski, CFA
Founder, Editor-in-chief
Gold & Silver Trading Alerts
Forex Trading Alerts
Oil Investment Updates
Oil Trading Alerts

