

Briefly: In our opinion, a speculative short position (half) in gold, silver and mining stocks is justified from the risk/reward point of view.
The situation in the precious metals market is quite specific at this time. We have gold moving higher on low volume and moving lower on increased volume (which is bearish), but during the last few weeks miners have outperformed gold which seems to indicate strength. One of the signals that help to decide what the outlook really is comes from silver stocks.
Before we move to silver miners, let's take a look at gold and silver (charts courtesy of http://stockcharts.com).
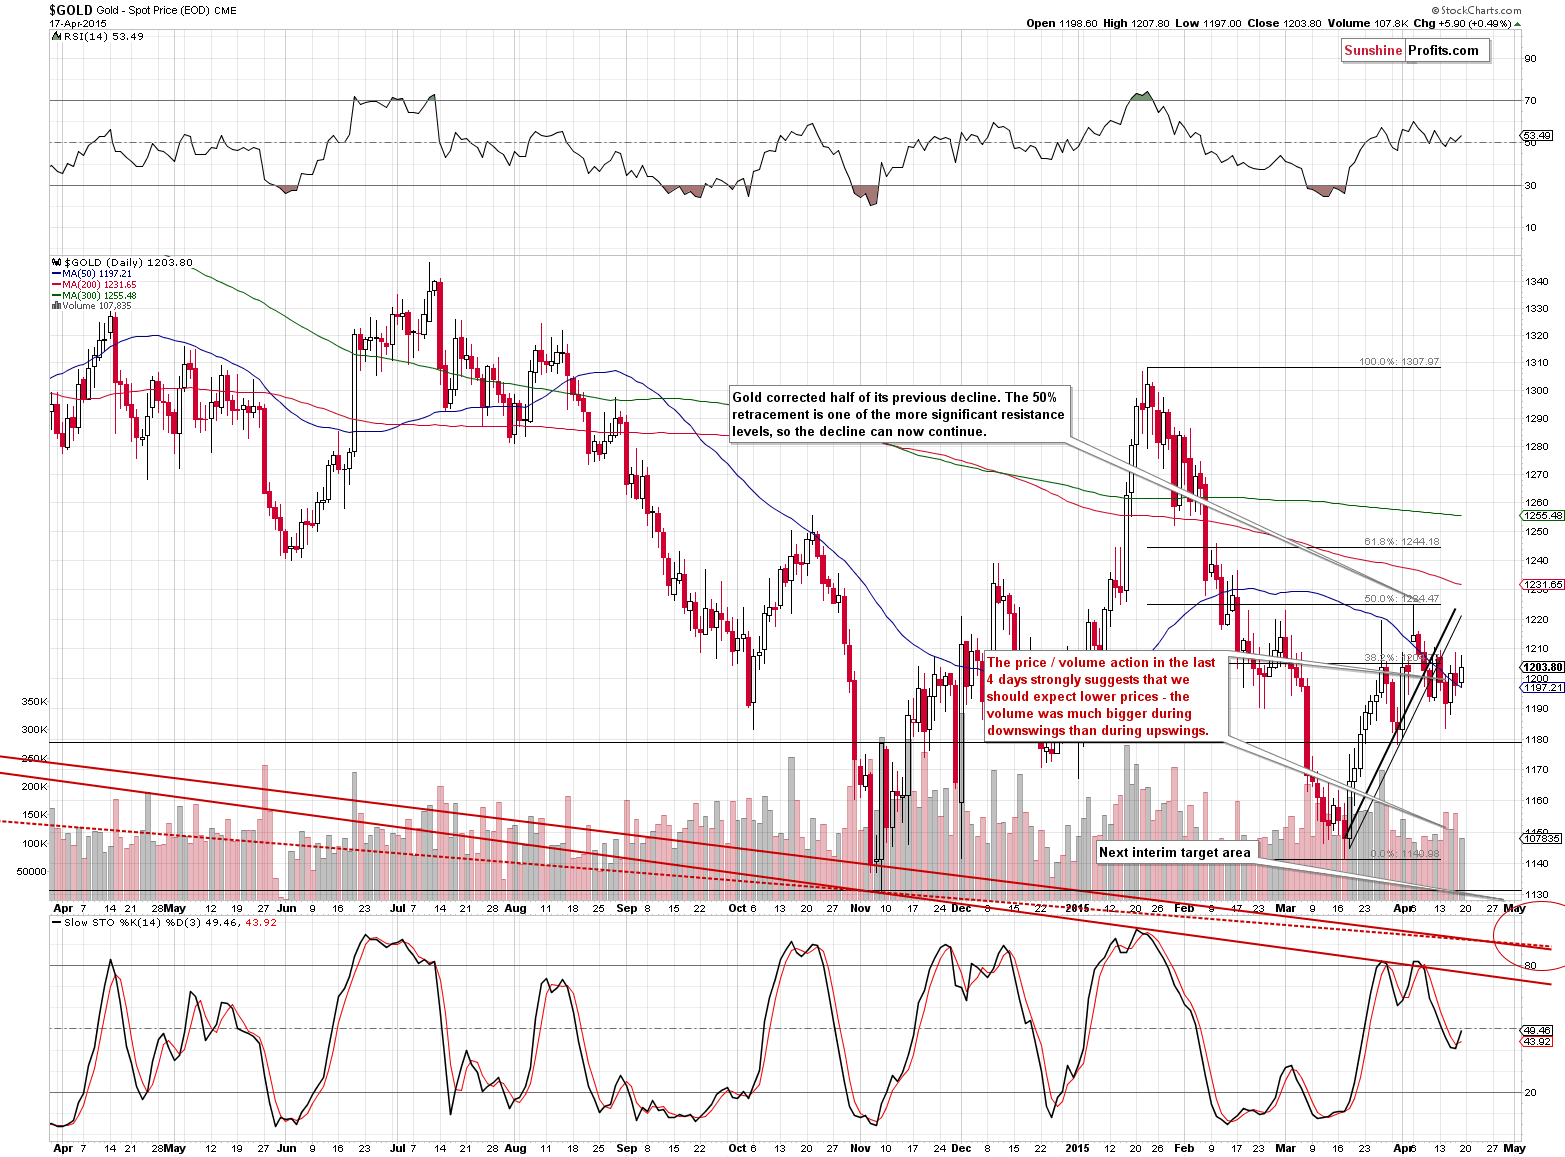
As mentioned above, the price of gold moved back and forth and the corresponding action in volume was bearish. Volume very often confirms the direction in which the market is going and it allows to differentiate between true rallies (that are likely to be followed by even bigger rallies) and corrections (that are likely to be followed by declines). In this case, we saw the latter type of action.
Gold is after a confirmed breakdown below the rising support line and after reaching the 50% retracement based on the February – March decline, so it’s been likely to decline and the price-volume action makes this even more likely.
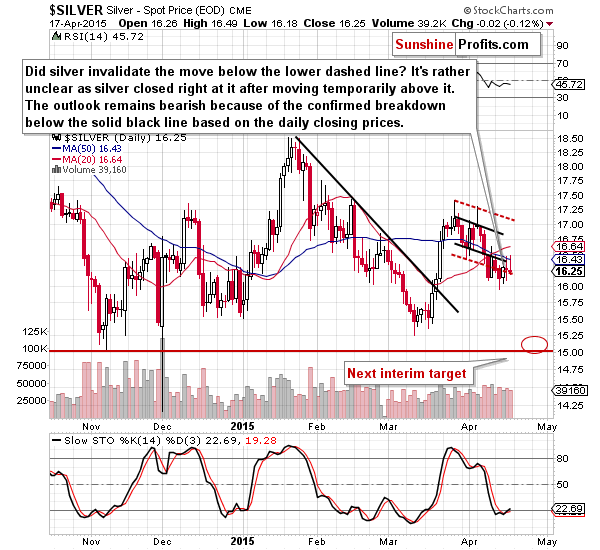
Silver's bearish outlook also remains unchanged as the price didn’t do much on Friday. Silver tried to move above the previously broken black support/resistance line, but was only able to move to it on an intra-day basis and decline shortly thereafter.
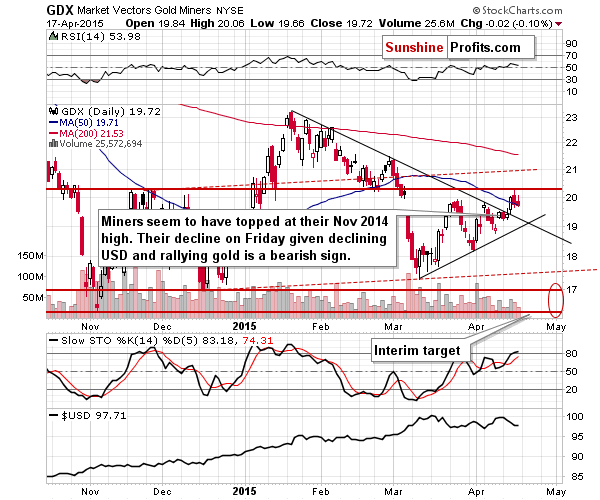
Yesterday’s price action in mining stocks (the GDX ETF includes both gold stocks and silver stocks) might seem surprising to those who believed that miners would soar right after the breakout as miners refused to rally even despite the gold’s rally on Friday. That’s a bearish sign.
Have we just seen another top? Based on the Nov. 2014 highs being reached – yes. However, we wouldn’t rule out a move to the $21 level as such a move would make the head-and-shoulders pattern more symmetrical. Please note that we don’t have to see this type of move for the pattern to have bearish implications – the pattern doesn’t have to be perfectly symmetrical and a top (right shoulder of the pattern) at exactly the previous top (left shoulder of the pattern) would very much make it meaningful anyway.
Our previous comments about the head-and-shoulders pattern’s implications for mining stocks remain up-to-date:
The red resistance lines that you can see on the chart are based on the possible head-and-shoulders pattern. If we see a move to the Nov. high or even to the $21 level but without a visible breakout above them and then see a decline, the implications will be very bearish. If we don’t see such upswings and miners decline before these levels are reached (which seems likely), then the implications will be very bearish anyway, because the head-and-shoulders pattern will continue to be formed. If it is completed, the decline following the breakdown below $17 could take the GDX ETF below $13.
What about the silver stocks?
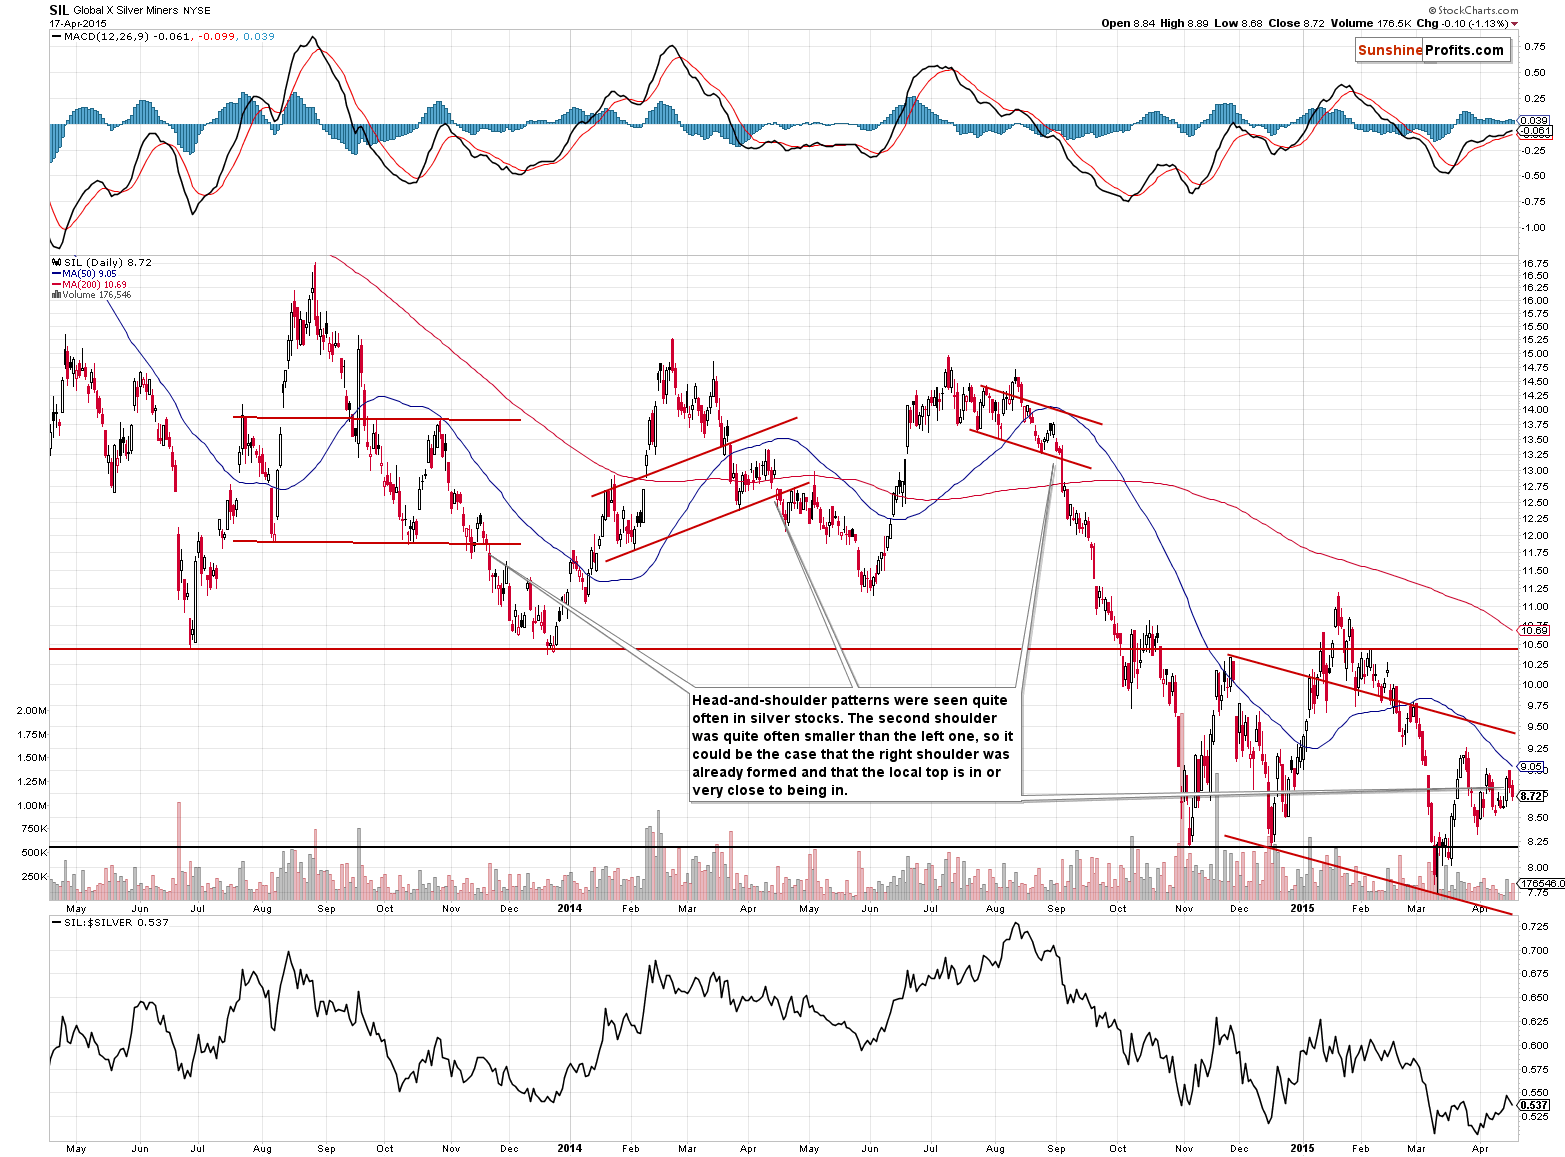
Silver stocks formed bearish head-and-shoulders patterns a few times previously. In each case, these patterns resulted in much lower values of silver stocks and the rest of the precious metals sector. What’s particularly interesting about these patterns is that the right shoulder was quite often (2 out of 3 cases) smaller than the left one. Consequently, a move higher here is not required for the right shoulder of the current head-and-shoulders to form. In fact, it’s top could be already behind us.
All in all, the thing that silver stocks tell us is that we can really see a move lower right away, without another small upswing (hence, exiting the small short positions at this time seems premature).
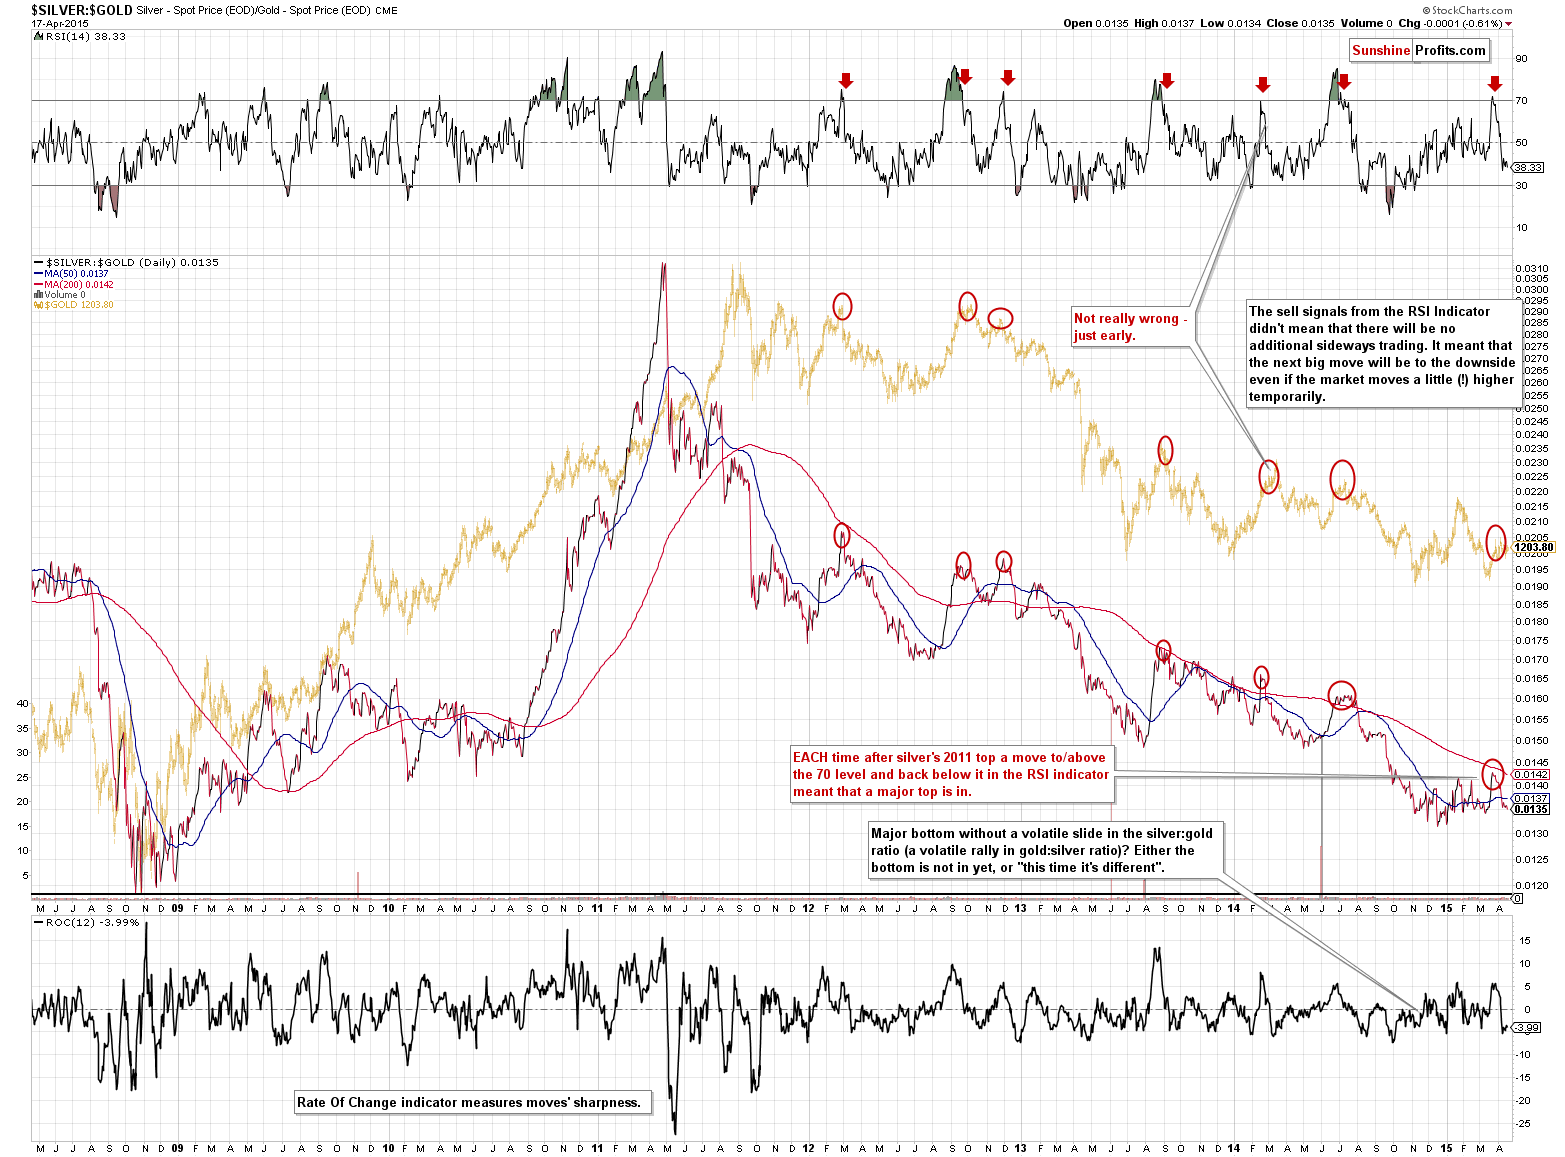
Furthermore, let’s not forget that the silver to gold ratio has recently moved sharply higher, causing the RSI Indicator based on it to become overbought. In EACH case that we saw this development a major decline followed (at times we had to wait for it a few weeks, but it ultimately happened without a bigger rally before it). We have not seen a major decline so far, so the bearish implications remain in place.
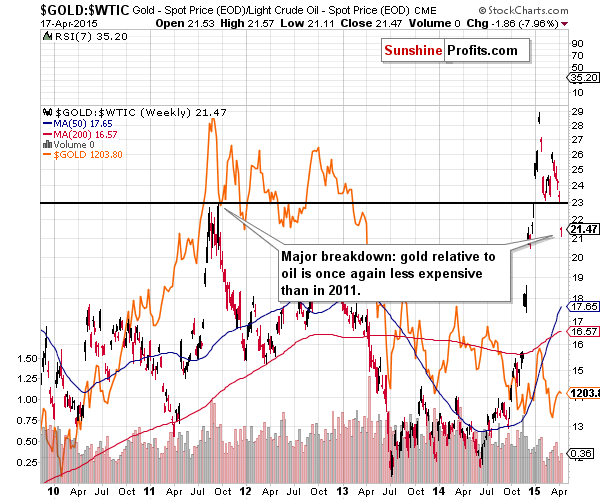
The gold to oil ratio closed the week well below its 2011 high, and – because of the size of the move and the weekly close – we consider the breakdown to be confirmed. The implications are bearish and our previous comments remain up-to-date:
We think that there’s nobody in the precious metals market that needs to be convinced that the 2011 top was a major event. However, it was not only major in gold itself, but also in the case of its ratios, including the gold to oil ratio.
This ratio peaked in 2011 as well and it was not until this year that it was broken. The initial move lower in the ratio earlier this year and a rebound from the 2011 high proved that this is indeed a major support/resistance level. This important level was just broken yesterday in a very profound way.
The gold to oil ratio moves in tune with gold, so such a major breakdown in this ratio has bearish implications for gold as well.
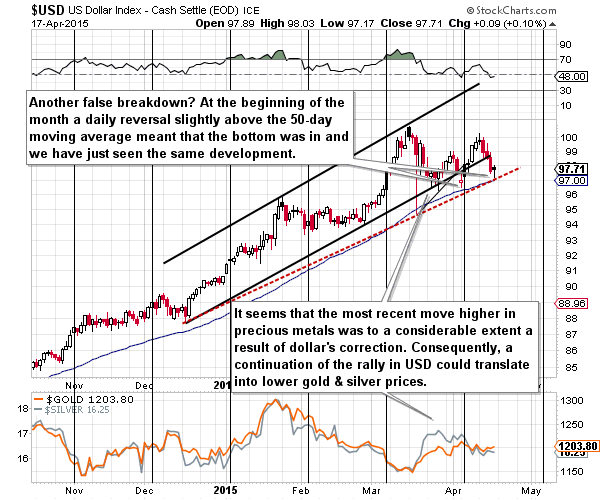
The USD Index declined on Friday, but only initially – it came back up in the following part of the session. Will the USD decline based on the breakdown below the rising trend channel? It’s possible, but it’s not very likely. Please note that this line was invalidated a few times in the past and in each previous case the USD rallied back above it.
Moreover, the 50-day moving average provides support (just like it was the case in mid-March and early April) and so does the red dashed support line based on the December and March lows. Consequently, the outlook did not deteriorate significantly – we can still see much higher USD values in the coming days and weeks.
Summing up, even though it seems that the situation in the precious metals market is improving based on last week’s strength in mining stocks, we think that this is not the case – in fact, the opposite might be taking place. The strength in miners was no longer present on Friday and practically no other market or ratio (i.a. gold, silver, silver to gold ratio, gold to oil ratio, silver stocks, USD Index) is confirming it. While we could see some more strength in miners, it’s not likely to be significant and – more importantly – we don’t have to see more strength for the bearish head-and-shoulders pattern to be completed. The right shoulder has already been formed (it’s after the right shoulder’s highest point) in the case of gold and silver and it seems that it’s about to be formed in the case of mining stocks. The implications are very bearish and it seems that exiting small short positions in the precious metals sector at this time would be premature. If we see an invalidation thereof, we’ll close the positions, but it seems more likely that we will see a bearish confirmation, which will likely result in increasing the size of the short position.
We will keep you – our subscribers – updated.
To summarize:
Trading capital (our opinion): Short (half position) position in gold, silver and mining stocks is justified from the risk/reward perspective with the following stop-loss orders and initial (!) target prices:
- Gold: initial target price: $1,115; stop-loss: $1,253, initial target price for the DGLD ETN: $87.00; stop loss for the DGLD ETN $63.78
- Silver: initial target price: $15.10; stop-loss: $17.63, initial target price for the DSLV ETN: $67.81; stop loss for DSLV ETN $44.97
- Mining stocks (price levels for the GDX ETN): initial target price: $16.63; stop-loss: $21.83, initial target price for the DUST ETN: $23.59; stop loss for the DUST ETN $12.23
In case one wants to bet on lower junior mining stocks' prices, here are the stop-loss details and initial target prices:
- GDXJ: initial target price: $21.17; stop-loss: $27.31
- JDST: initial target price: $14.35; stop-loss: $6.18
Long-term capital (our opinion): No positions
Insurance capital (our opinion): Full position
Please note that a full position doesn’t mean using all of the capital for a given trade. You will find details on our thoughts on gold portfolio structuring in the Key Insights section on our website.
As a reminder – “initial target price” means exactly that – an “initial” one, it’s not a price level at which we suggest closing positions. If this becomes the case (like it did in the previous trade) we will refer to these levels as levels of exit orders (exactly as we’ve done previously). Stop-loss levels, however, are naturally not “initial”, but something that, in our opinion, might be entered as an order.
Since it is impossible to synchronize target prices and stop-loss levels for all the ETFs and ETNs with the main markets that we provide these levels for (gold, silver and mining stocks – the GDX ETF), the stop-loss levels and target prices for other ETNs and ETF (among other: UGLD, DGLD, USLV, DSLV, NUGT, DUST, JNUG, JDST) are provided as supplementary, and not as “final”. This means that if a stop-loss or a target level is reached for any of the “additional instruments” (DGLD for instance), but not for the “main instrument” (gold in this case), we will view positions in both gold and DGLD as still open and the stop-loss for DGLD would have to be moved lower. On the other hand, if gold moves to a stop-loss level but DGLD doesn’t, then we will view both positions (in gold and DGLD) as closed. In other words, since it’s not possible to be 100% certain that each related instrument moves to a given level when the underlying instrument does, we can’t provide levels that would be binding. The levels that we do provide are our best estimate of the levels that will correspond to the levels in the underlying assets, but it will be the underlying assets that one will need to focus on regarding the sings pointing to closing a given position or keeping it open. We might adjust the levels in the “additional instruments” without adjusting the levels in the “main instruments”, which will simply mean that we have improved our estimation of these levels, not that we changed our outlook on the markets. We are already working on a tool that would update these levels on a daily basis for the most popular ETFs, ETNs and individual mining stocks.
Our preferred ways to invest in and to trade gold along with the reasoning can be found in the how to buy gold section. Additionally, our preferred ETFs and ETNs can be found in our Gold & Silver ETF Ranking.
As always, we'll keep you - our subscribers - updated should our views on the market change. We will continue to send out Gold & Silver Trading Alerts on each trading day and we will send additional Alerts whenever appropriate.
The trading position presented above is the netted version of positions based on subjective signals (opinion) from your Editor, and the Tools and Indicators.
As a reminder, Gold & Silver Trading Alerts are posted before or on each trading day (we usually post them before the opening bell, but we don't promise doing that each day). If there's anything urgent, we will send you an additional small alert before posting the main one.
=====
Latest Free Trading Alerts:
Bitcoin Trading Alert: Bitcoin in Deadlock
Bitcoin went up both yesterday and on the day before. This could have looked like the end of the decline but we were rather cautious about that yesterday. Has anything changed since then?
=====
Hand-picked precious-metals-related links:
Gold below $1,200 on steadier dollar; eyes on Greece, China
=====
In other news:
US, Ukraine Start Military Training, Defying Russian Fury
Greece Flashes Warning Signals About Its Debt
=====
Thank you.
Sincerely,
Przemyslaw Radomski, CFA
Founder, Editor-in-chief
Gold & Silver Trading Alerts
Forex Trading Alerts
Oil Investment Updates
Oil Trading Alerts

