

Briefly: In our opinion speculative short position (half) in gold, silver and mining stocks in justified from the risk/reward point of view.
In the March 20 Gold & Silver Trading Alert we described our outlook for the following week. It turns out that the precious metals market reacted just like we had expected. There was no major move higher, but a smaller short-term rally. We also wrote that the situation was a bit unclear and consequently we wrote about taking massive profits off the table. It seems that exactly the above happened – the precious metals market rallied, but not significantly. The most important thing, however (and the most critical to traders), is that the situation clarified a lot in the past week (and not in the way many investors might expect it to). We have some very interesting details to share with you. Let’s start (charts courtesy of http://stockcharts.com).
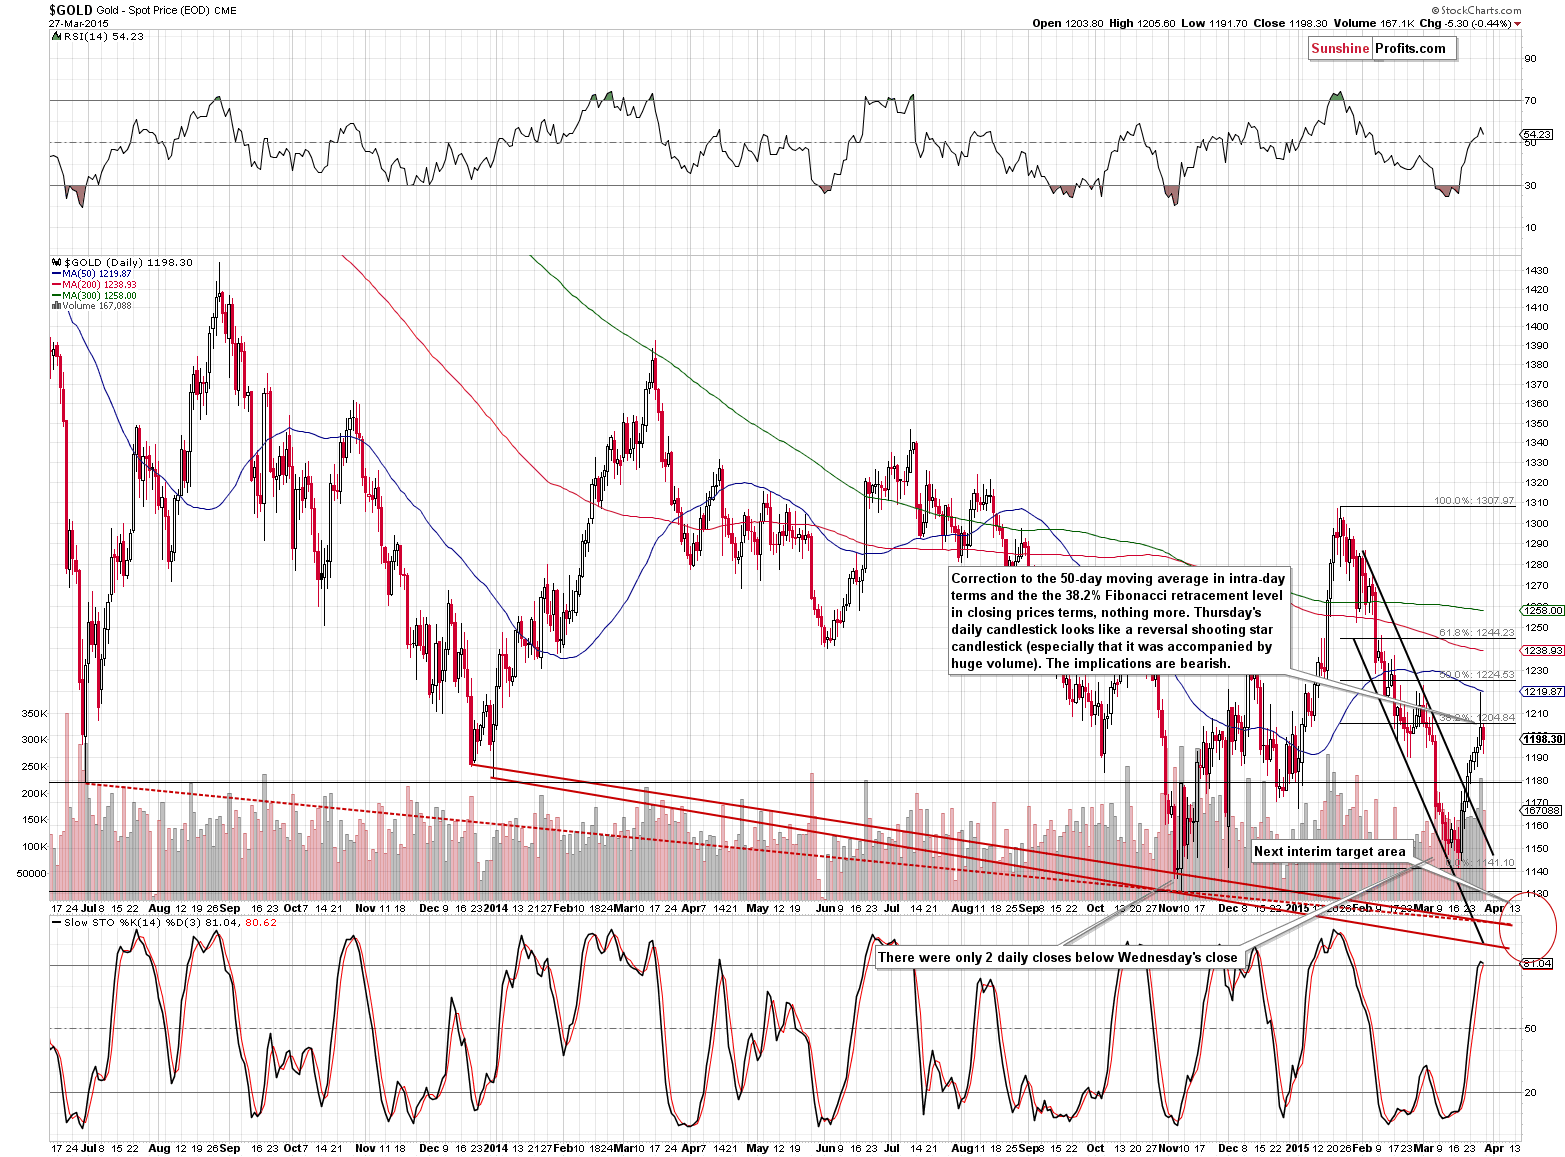
What did gold do? It corrected. Yes, even though the rally (until the early hours of Thursday’s session) was quite sharp, it seems that what we saw last week was the final part of a counter-trend correction and nothing more.
The Stochastic indicator hasn’t flashed a sell signal just yet (it’s very close to doing so and the sell signals have been much more reliable than the buy ones), but it seems that it will happen just any day now. The most important thing on the above chart, however, is the intra-day action that we saw on Thursday. Gold reversed on huge volume and formed a reversal shooting start candlestick. The short-term implications are bearish (and the medium-term outlook remains bearish).
Gold provides us with a bearish outlook, but the most important signals come from the silver market and it’s relation to gold.
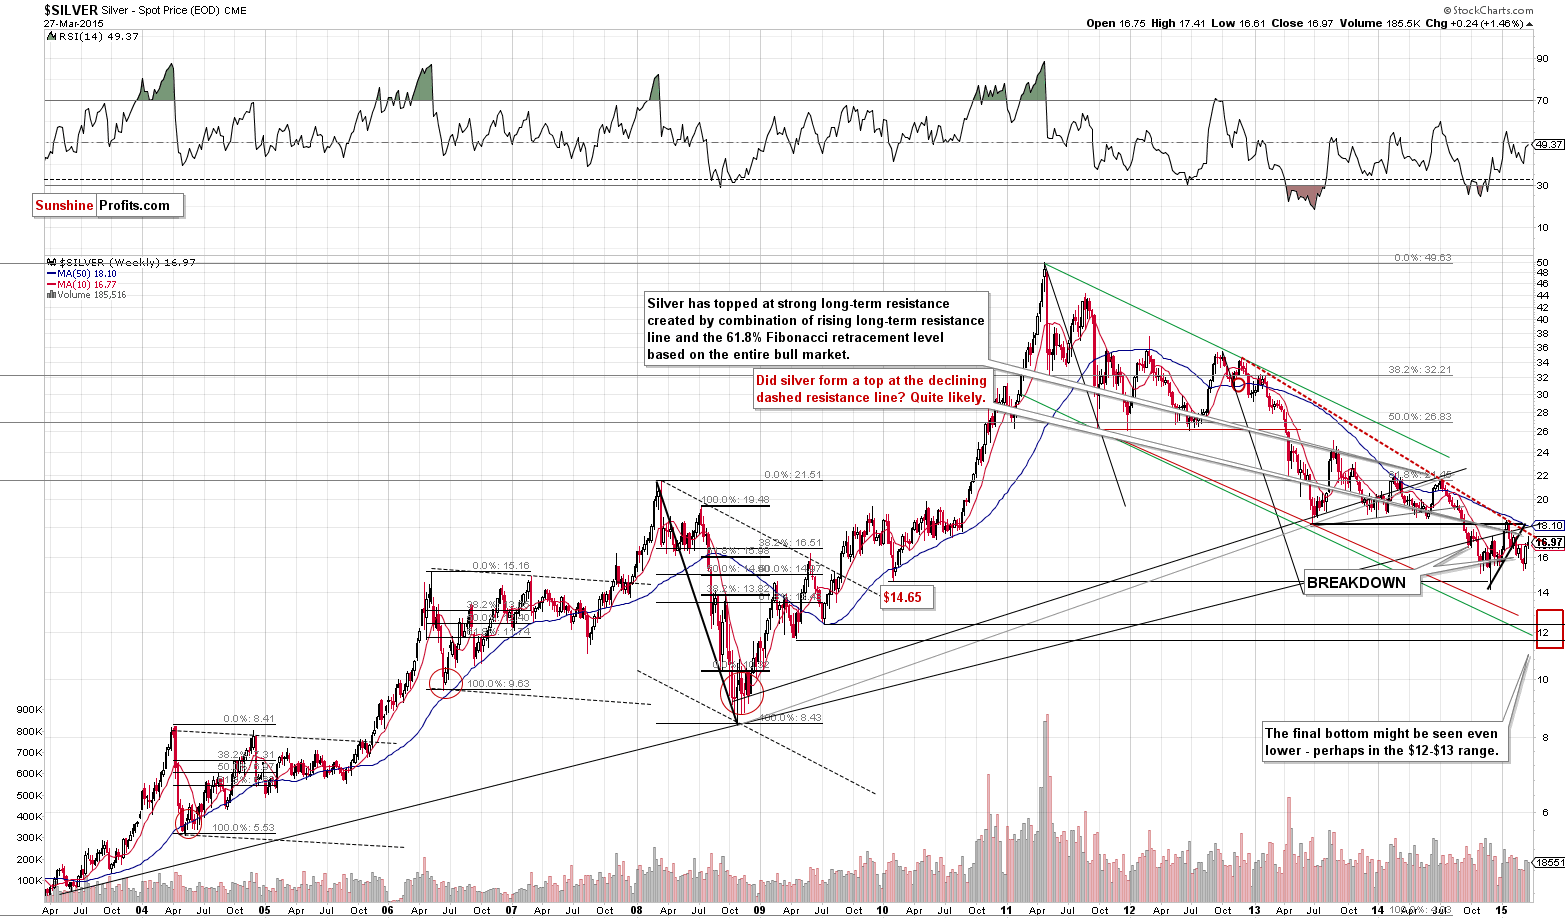
Silver didn’t do much on its own if we take a look at it from the long-term perspective. The breakdown below the rising long-term support/resistance line wasn’t invalidated and silver didn’t move above the declining red dashed resistance line. The medium-term outlook simply remains bearish.
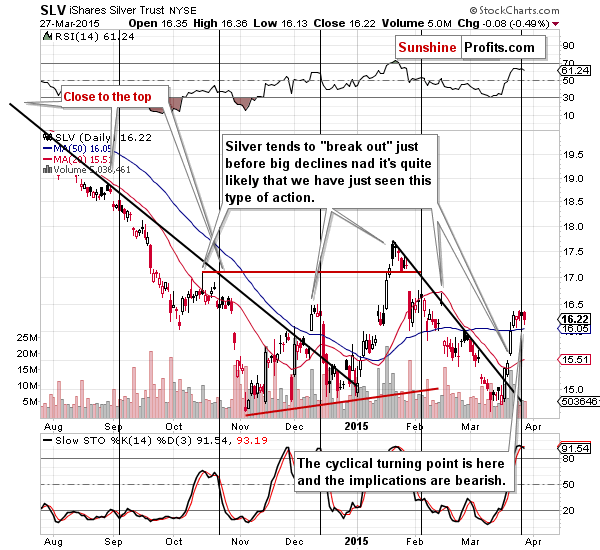
On a short-term basis, we see that silver moved higher before the turning point, which has bearish implications.
Some might say that silver broke out above the declining short-term resistance line. Our comment is that it’s irrelevant in light of the numerous “fake-outs” in the past. Silver’s breakouts have simply lost the traditional bullish implications that breakouts tend to have. Is there anything other that we can say about the above chart? Yes, and it’s bearish as well. The November – today action could be viewed as a head-and-shoulders pattern. If silver breaks below the March low (which seems likely), the next head-and-shoulders-based target will be at about $12.50. This target is based the above technique, which says that the move below the “neck” level is likely to be equal to the size of the “head”.
That’s not the most bearish signal though. Here is the most bearish indication:
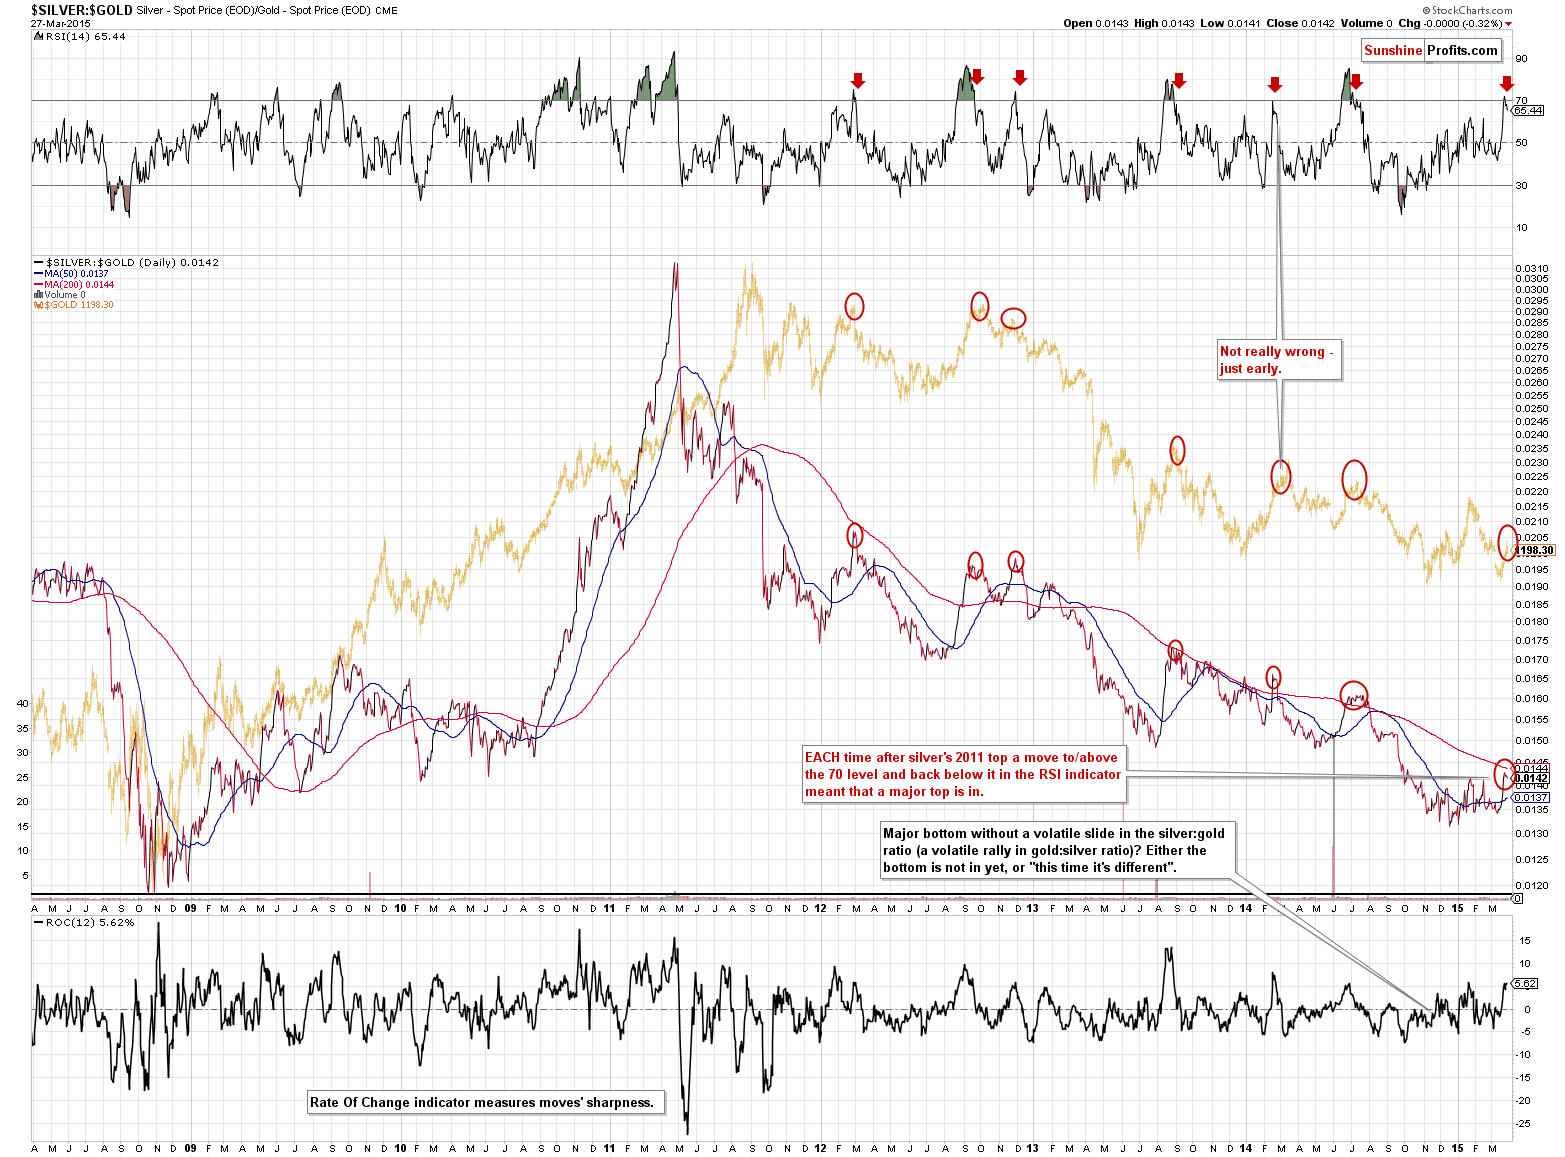
Note the red arrows that mark the sell signals and what happened with the silver to gold ratio and gold in the past years.
Some would say that silver is leading gold higher. Others would say that “whites lead yellow” suggesting that silver’s (or platinum’s) outperformance is a very bullish sign. Here’s our take:
Wrong.
Very wrong.
OK, there are no sure bets in any market, but the odds are that the most recent outperformance of silver is just a sign preceding a major top. Just take a look what happened in the past YEARS. EACH TIME (yes, each time) the RSI indicator based on the silver to gold ratio moved above 70 and then moved back below it (the times when silver outperformed gold for some time, but then it moved back down again), a major top was formed. That’s a signal that’s been 100% effective for 4 years. If this was the case for a year and there were 3 such cases, we would not be that excited, but it’s a signal that has been in place for 4 years and we saw 6 signals that were followed by 6 declines, which makes this signal something that should definitely not be ignored. The implications, of course, are bearish.
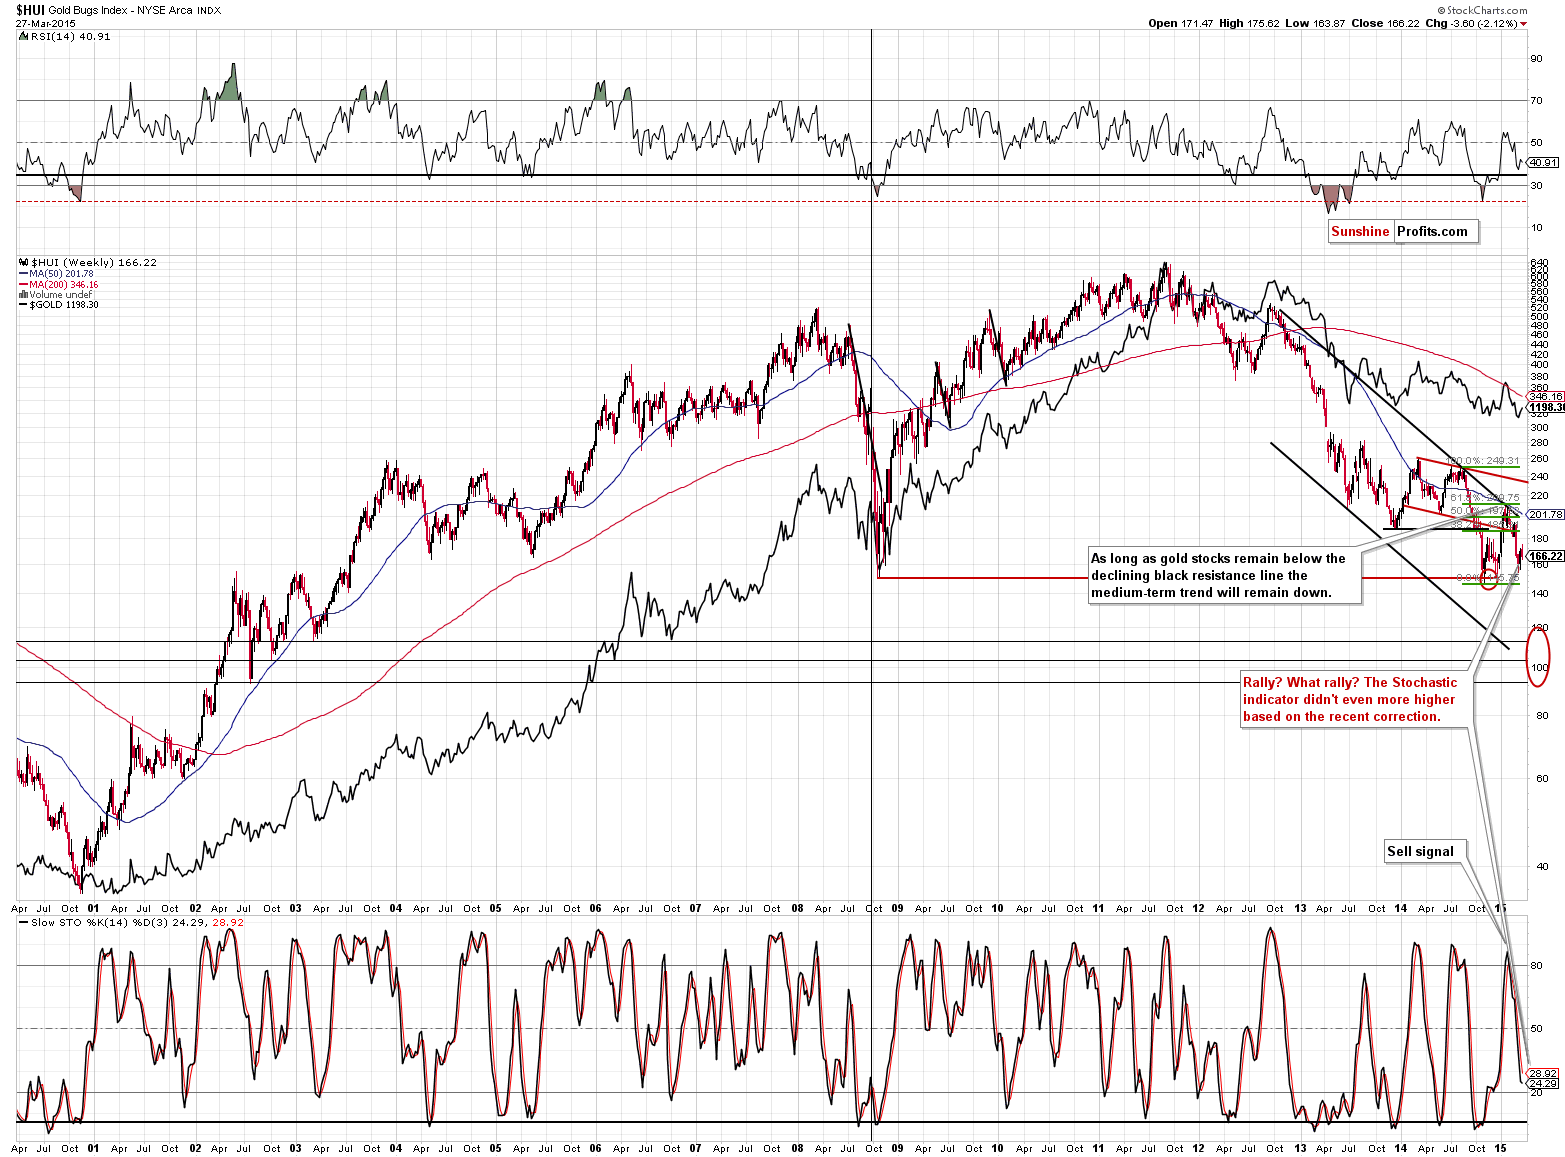
Gold stocks moved higher during the week before the last just like the rest of the precious metals sector, but their rally was rather small compared with the size of the previous slide and they even managed to decline last week, despite gold’s move higher. The implications are bearish. Gold stocks used to outperform gold, but are no longer doing so. In fact, it seems that they resumed their declining trend last week, underperforming gold once again.
Summing up, while the situation was rather unclear over a week ago, it seems rather clear and bearish now. We expected the bullish signal not to result in a major rally, but a local one, and we’ve seen just that. The decline seems to be resuming based on the signals from the gold market, mining stocks and – most of all – from the silver market and the silver to gold ratio. Since the odds for a significant move up have diminished significantly at this time, it seems that re-opening short positions (half positions for now) in gold, silver and mining stocks is justified from the risk/reward point of view.
As always, we will keep you – our subscribers – informed.
To summarize:
Trading capital (our opinion): Short (half position) position in gold, silver and mining stocks is justified from the risk/reward perspective with the following stop-loss orders and initial (!) target prices:
- Gold: initial target price: $1,115; stop-loss: $1,231, initial target price for the DGLD ETN: $87.00; stop loss for the DGLD ETN $66.10
- Silver: initial target price: $15.10; stop-loss: $17.63, initial target price for the DSLV ETN: $67.81; stop loss for DSLV ETN $45.01
- Mining stocks (price levels for the GDX ETN): initial target price: $16.63; stop-loss: $20.17, initial target price for the DUST ETN: $23.59; stop loss for the DUST ETN $13.75
In case one wants to bet on lower junior mining stocks' prices, here are the stop-loss details and initial target prices:
- GDXJ: initial target price: $21.17; stop-loss: $26.28
- JDST: initial target price: $14.35; stop-loss: $7.21
Long-term capital (our opinion): No positions
Insurance capital (our opinion): Full position
Please note that a full position doesn’t mean using all of the capital for a given trade. You will find details on our thoughts on gold portfolio structuring in the Key Insights section on our website.
As a reminder – “initial target price” means exactly that – an “initial” one, it’s not a price level at which we suggest closing positions. If this becomes the case (like it did in the previous trade) we will refer to these levels as levels of exit orders (exactly as we’ve done previously). Stop-loss levels, however, are naturally not “initial”, but something that, in our opinion, might be entered as an order.
Since it is impossible to synchronize target prices and stop-loss levels for all the ETFs and ETNs with the main markets that we provide these levels for (gold, silver and mining stocks – the GDX ETF), the stop-loss levels and target prices for other ETNs and ETF (among other: UGLD, DGLD, USLV, DSLV, NUGT, DUST, JNUG, JDST) are provided as supplementary, and not as “final”. This means that if a stop-loss or a target level is reached for any of the “additional instruments” (DGLD for instance), but not for the “main instrument” (gold in this case), we will view positions in both gold and DGLD as still open and the stop-loss for DGLD would have to be moved lower. On the other hand, if gold moves to a stop-loss level but DGLD doesn’t, then we will view both positions (in gold and DGLD) as closed. In other words, since it’s not possible to be 100% certain that each related instrument moves to a given level when the underlying instrument does, we can’t provide levels that would be binding. The levels that we do provide are our best estimate of the levels that will correspond to the levels in the underlying assets, but it will be the underlying assets that one will need to focus on regarding the sings pointing to closing a given position or keeping it open. We might adjust the levels in the “additional instruments” without adjusting the levels in the “main instruments”, which will simply mean that we have improved our estimation of these levels, not that we changed our outlook on the markets. We are already working on a tool that would update these levels on a daily basis for the most popular ETFs, ETNs and individual mining stocks.
Our preferred ways to invest in and to trade gold along with the reasoning can be found in the how to buy gold section. Additionally, our preferred ETFs and ETNs can be found in our Gold & Silver ETF Ranking.
As always, we'll keep you - our subscribers - updated should our views on the market change. We will continue to send out Gold & Silver Trading Alerts on each trading day and we will send additional Alerts whenever appropriate.
The trading position presented above is the netted version of positions based on subjective signals (opinion) from your Editor, and the automated tools (SP Indicators and the upcoming self-similarity-based tool).
As a reminder, Gold & Silver Trading Alerts are posted before or on each trading day (we usually post them before the opening bell, but we don't promise doing that each day). If there's anything urgent, we will send you an additional small alert before posting the main one.
=====
Latest Free Trading Alerts:
Under the recent information deluge, we haven’t had the time to analyze a very interesting and disturbing trend. The U.S. business inventory to sales ratio has been rising for months. What does it mean for the American economy and the gold market?
Gold News Monitor: Rising Inventory to Sales Ratio
S&P 500 index fluctuated following recent decline. Is downtrend over yet?
Stock Trading Alert: Positive Expectations As Investors Bet On Reversal
=====
Hand-picked precious-metals-related links:
Peak Gold? Goldman Calculates There Is Only 20 Years Of Gold Supply Left
Hedge Funds Bet Gold Gain to End as Short Wagers Hit Record
=====
In other news:
The ECB's put – explained by Draghi
Crunch time: Greece risks rising once again
Ukraine Faces 30% Risk of Messy Default as Creditor Talks Begin
This controversial theory has got Janet Yellen worried
Iran Reserves Again Coveted by Big Oil After Decades of Conflict
=====
Thank you.
Sincerely,
Przemyslaw Radomski, CFA
Founder, Editor-in-chief
Gold & Silver Trading Alerts
Forex Trading Alerts
Oil Investment Updates
Oil Trading Alerts

