

Briefly: In our opinion speculative short positions (full) in gold, silver and mining stocks are justified from the risk/reward perspective. We are keeping the stop-loss levels at their current levels, which means that we are effectively keeping some gains locked and at the same time we’re allowing the profits to increase.
Gold moved initially lower yesterday only to come sharply back up before the end of the session. Miners did the same and some gold traders are probably thinking that the decline is over. Are they right?
Of course, it’s impossible to tell at this time, as we have not seen the complete price action yet. The correct way this question should be asked is if what happened made a significant (!) move higher more probable. It didn’t. We wrote that we could see some short-term strength after gold reached our interim target (and we even wrote that gold’s move to $1,200 was likely to correspond to a move to about $20 in the GDX ETF), and we did. We could even see some more strength, but would it change much? Not really. Let’s take a closer look (charts courtesy of http://stockcharts.com).
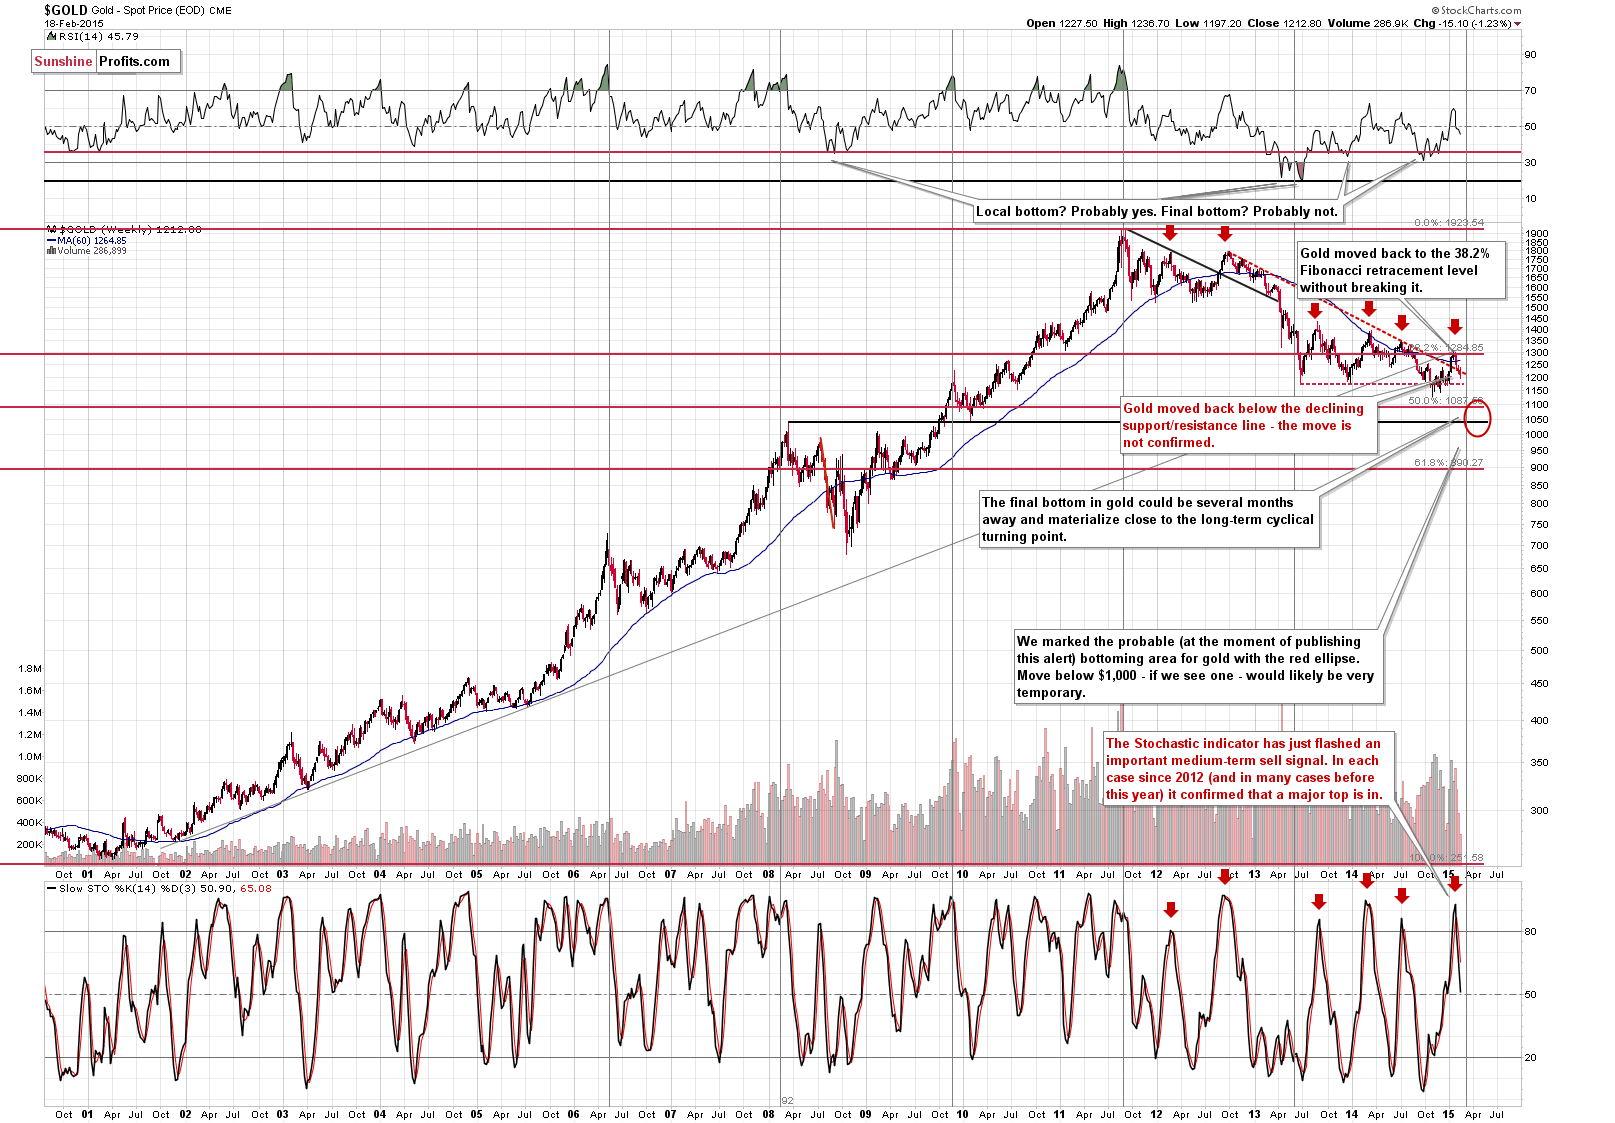
We previously commented on the above chart in the following way:
Gold moved below the declining support line. The breakdown is not confirmed, but it is definitely a bearish development. Did the situation become much more bearish based on the above chart? No. More bearish, yes, but not much more bearish.
Gold moved higher on Wednesday, but it did not move back above the declining resistance line. Consequently, the move back below it is almost confirmed (we think it’s best to wait for 3 closes above/below a certain level for a given breakout or breakdown to be confirmed). Therefore, if we focus on the closing prices, the outlook actually deteriorated based on what happened yesterday.
What about the short-term chart?
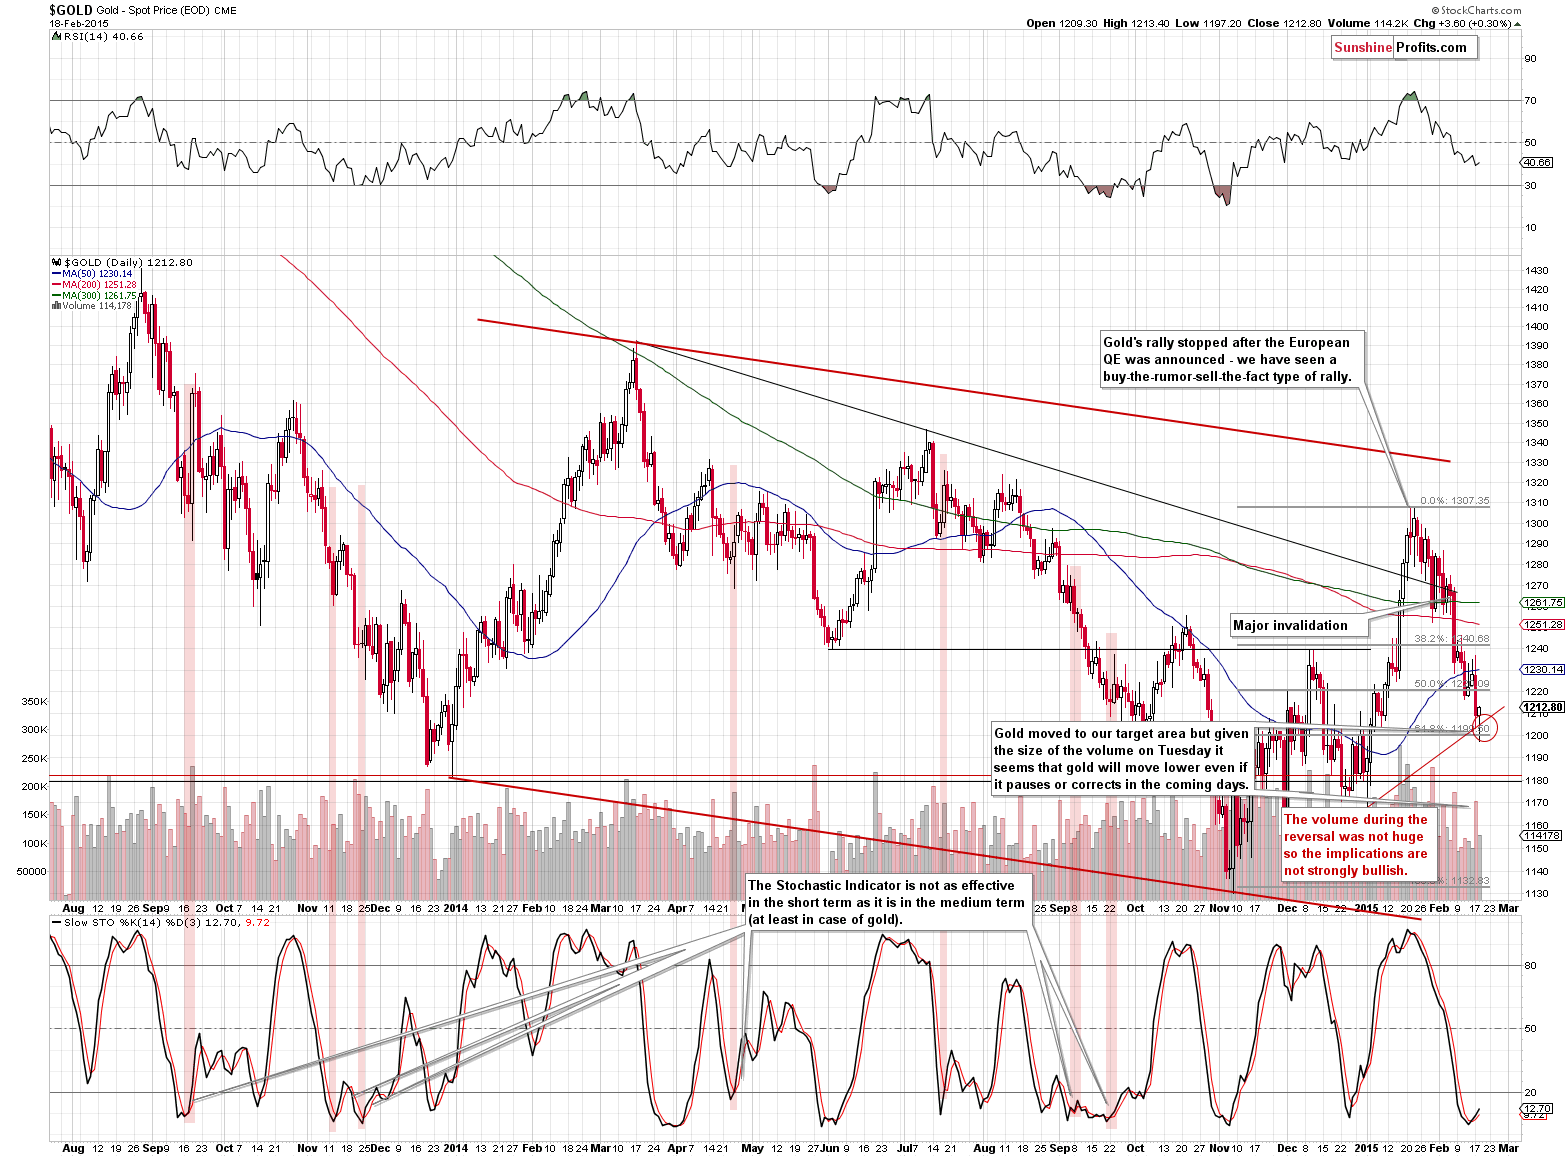
Here’s what we wrote previously:
The analysis of price levels suggests that the next interim target (but not the final target for this decline) is $1,200. That’s where the 61.8% Fibonacci retracement level and the rising short-term support line intersect. Plus, the $1,200 is a round number, which makes it significant from the psychological perspective. Will gold form a bottom at this level? A local one – quite likely. A final one – not likely.
Gold moved to our target area yesterday and it almost reached the $1,200 level. As we indicated above, the very short-term situation improved based on this move as we can see a bounce here, but we don’t think that it will be significant or that it will last long. Gold declined on significant volume, so the implications are bearish, even though we could see some strength in the following days.
We indeed saw some strength as gold reversed its intra-day decline and ended the session slightly higher. The daily candlestick is a reversal hammer candlestick, which has bullish implications, but before thinking about exiting the short positions, let’s keep in mind the comments based on the long-term chart (and the long-term charts are more important than the short-term ones) and the fact that yesterday’s price action took place on volume that was not nearly as significant as what we’d seen during the previous decline. If it had indeed been a major reversal then we would have expected to see average volume in the preceding days and very high volume during the reversal – there was no such action. Consequently, the following rally doesn’t have to be significant, and it doesn’t seem that it will be. In fact, it’s doubtful enough for us not to adjust the speculative positions at this time.
Yesterday we commented on gold priced in the Australian dollar and we would like to follow up on this topic today.
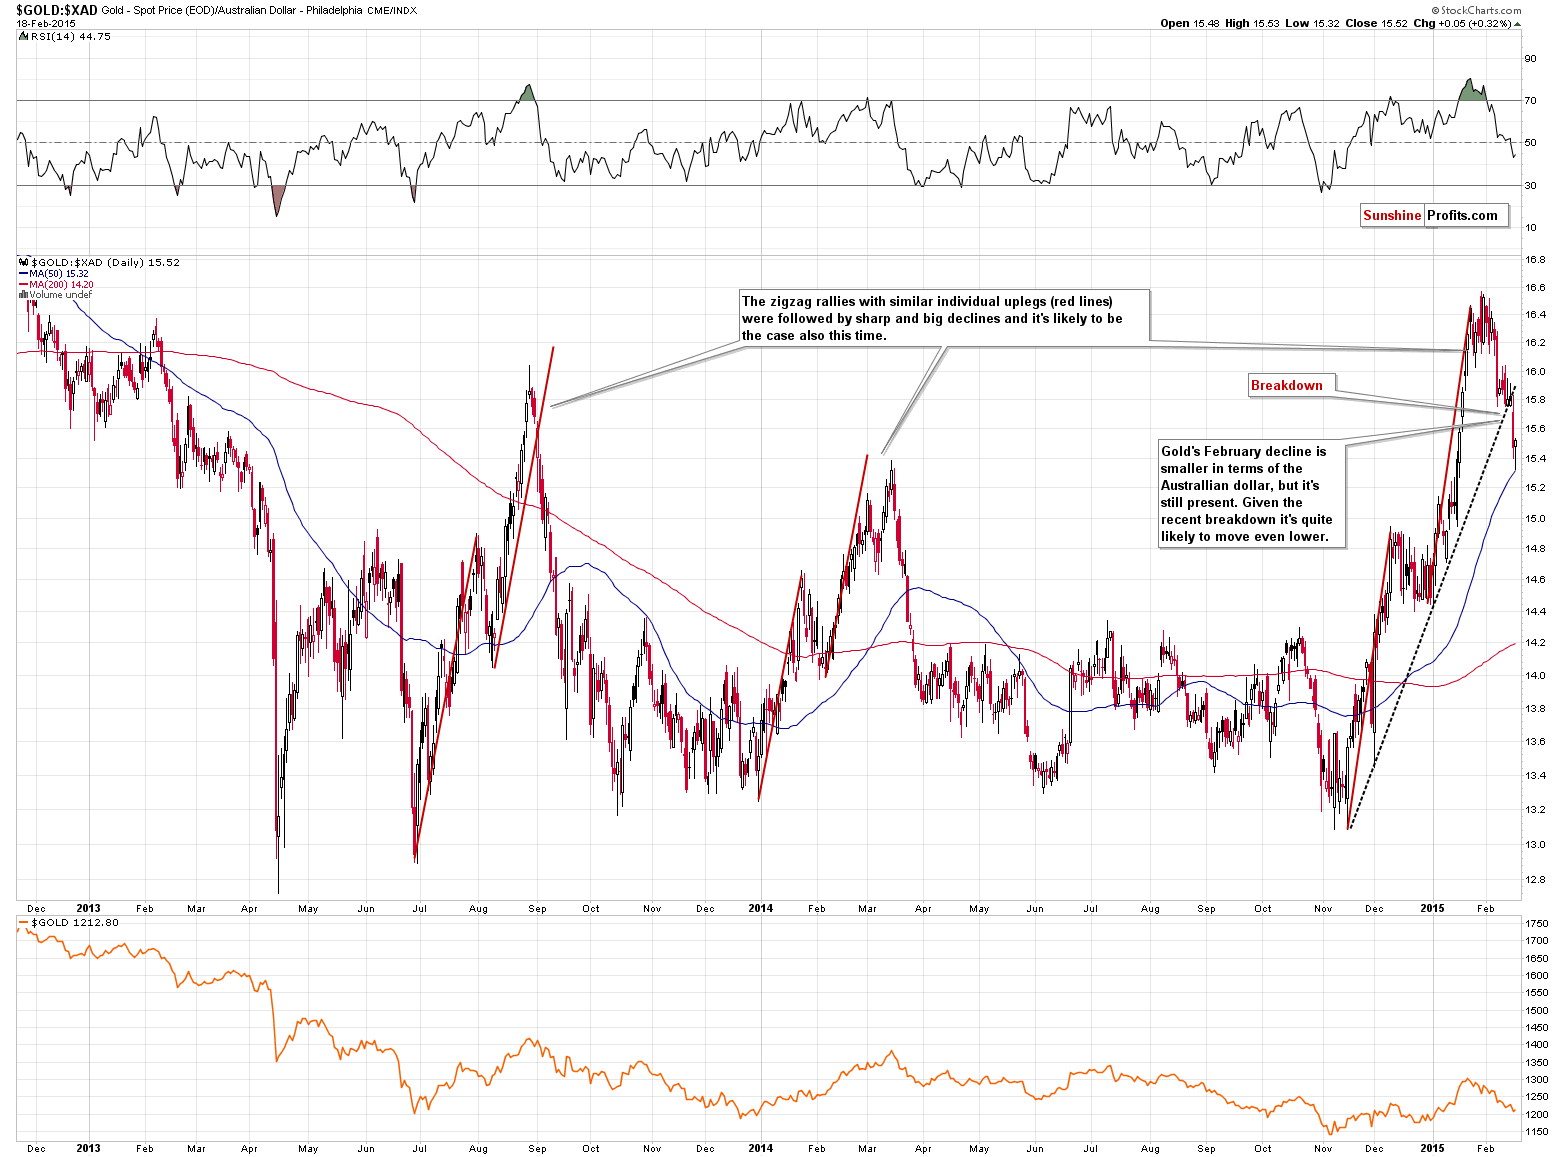
We saw the same reversal pattern, but on this chart we see an additional thing – that gold’s small rally didn’t take it back above the rising support/resistance line. The breakdown is almost confirmed. Our previous comments remain up-to-date:
We have just seen a breakdown below the rising, sharp short-term support line. The breakdown was significant and was preceded by a specific type of rally – a zigzag pattern. There were 2 cases in the recent history when we saw such patterns and in both cases gold declined sharply and significantly shortly thereafter. While the unconfirmed breakdown would not be really bearish on its own (until it was confirmed), its combination with the fact that we are right after a zigzag rally is bearish.
All in all, while the situation deteriorated for the medium term, it improved a bit for the very short term.
What about silver?
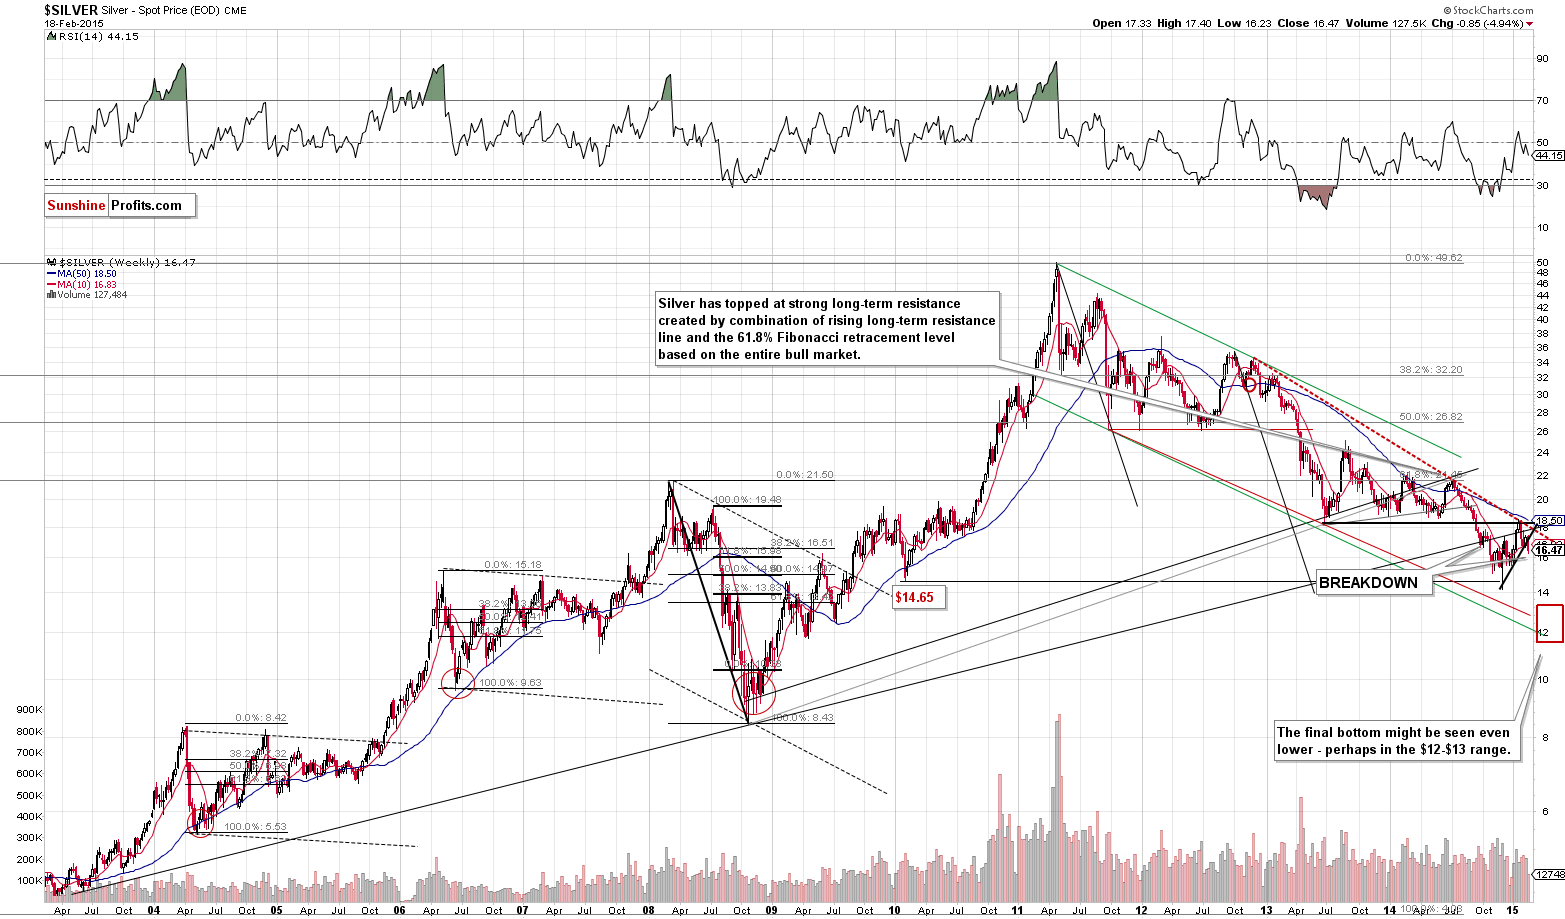
Not much. Silver didn’t move much and even though it corrected to the upside, this move didn’t take it back above the rising resistance line. Consequently, the technical picture remains unchanged and what we wrote previously remains up-to-date:
Silver declined and invalidated Friday’s strength. What’s important on the above chart is that we saw a visible breakdown below the rising support line. This is a major bearish signal for the coming weeks regardless of the possibility of a small bounce in the next few days.
Even if we see a small move higher here, it will not change anything.
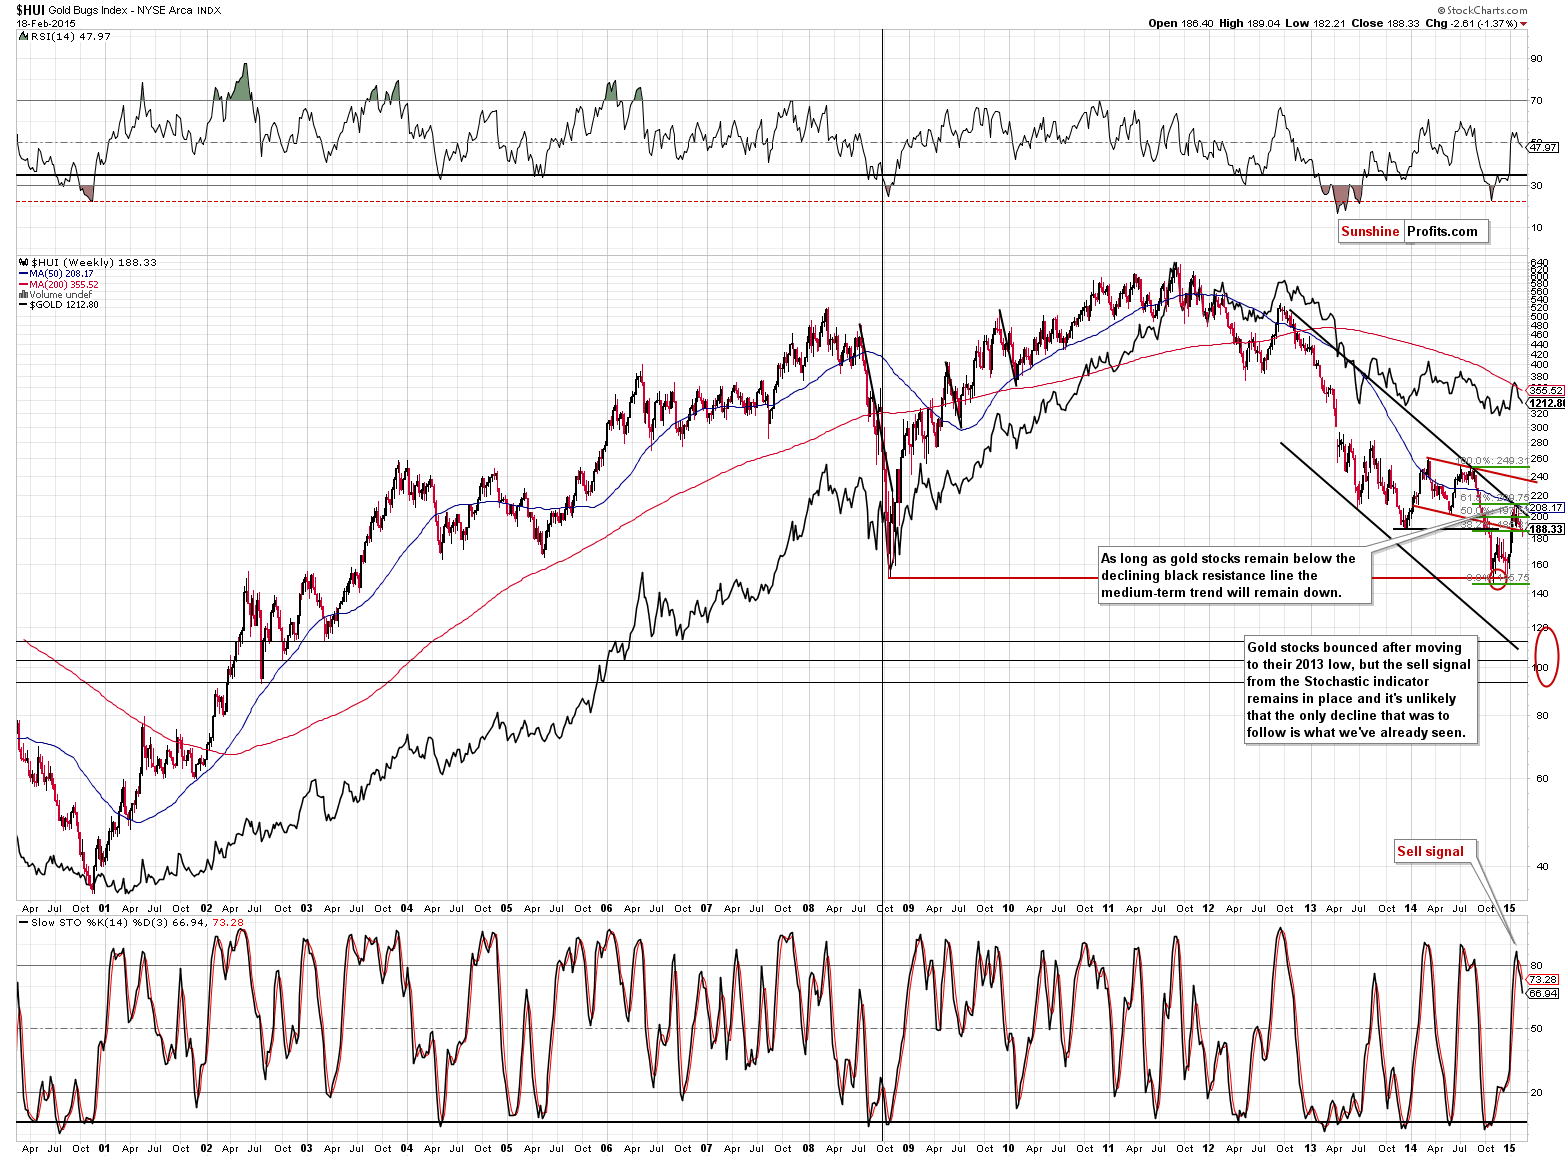
Mining stocks moved higher more visibly, but they had a good reason to do so – gold stocks moved to their 2013 lows. It’s no wonder that this level is a strong support.
We previously wrote the following about mining stocks:
Please note that back in October, the first day after the low-volume session was only the beginning of the decline. Consequently, even though we have support at $20, the GDX ETF could move well below it before correcting in a meaningful way. The volume (which was relatively high during Tuesday’s decline) serves as a bearish confirmation.
Gold stocks moved higher on Wednesday, but they are far from the declining resistance line, so the medium-term trend remains down. What could happen in the following days? Quite a lot. We can’t rule out further strength, but the odds are that the next decline will be quite sharp and we don’t want to be surprised by it. Just recall what happened recently in silver – it moved higher on Friday only to plunge on the following trading day. The same could happen shortly in the case of mining stocks.
Overall, we can summarize the situation in the same way as we did previously, but we can say that this/upcoming move higher could provide us with additional bearish confirmations that could make us exit the long-term precious metals investments completely (please note that being out with half of this capital during declines means outperforming the buy-and-hold approach anyway):
Summing up, the outlook remains bearish, but we haven’t seen enough bearish confirmations to believe that the outlook has significantly deteriorated (therefore we’re not making any adjustments to the long-term investment positions). It seems that we might see some kind of rebound very soon (as gold reached our interim target level), but at this time it’s unclear if a significant rally will really materialize (after all we are right after major sell signals from the Stochastic indicator for gold and the HUI Index), so all in all, we think its best to leave the current profitable positions intact and wait for additional signals before taking any action.
As always, we’ll keep you – our subscribers – informed.
To summarize:
Trading capital (our opinion): Short positions (full) in gold, silver and mining stocks with the following stop-loss orders and initial (!) target prices:
- Gold: initial target level: $1,180; stop-loss: $1,254, initial target level for the DGLD ETN: $75.23; stop loss for the DGLD ETN $63.16
- Silver: initial target level: $15.70 ; stop-loss: $17.63, initial target level for the DSLV ETN: $66.25 ; stop loss for DSLV ETN $45.40
- Mining stocks (price levels for the GDX ETN): initial target level: $18.40; stop-loss: $22.17, initial target level for the DUST ETN: $18.99 ; stop loss for the DUST ETN $11.32
In case one wants to bet on lower junior mining stocks' prices, here are the stop-loss details and initial target prices:
- GDXJ: initial target level: $23.37; stop-loss: $28.37
- JDST: initial target level: $12.30 ; stop-loss: $7.00
Long-term capital (our opinion): Half positions in gold, half positions in silver, half position in platinum and half position in mining stocks.
Insurance capital (our opinion): Full position
Please note that a full position doesn’t mean using all of the capital for a given trade. You will find details on our thoughts on gold portfolio structuring in the Key Insights section on our website.
As a reminder – “initial target price” means exactly that – an “initial” one, it’s not a price level at which we suggest closing positions. If this becomes the case (like it did in the previous trade) we will refer to these levels as levels of exit orders (exactly as we’ve done previously). Stop-loss levels, however, are naturally not “initial”, but something that, in our opinion, might be entered as an order.
Since it is impossible to synchronize target prices and stop-loss levels for all the ETFs and ETNs with the main markets that we provide these levels for (gold, silver and mining stocks – the GDX ETF), the stop-loss levels and target prices for other ETNs and ETF (among other: UGLD, DGLD, USLV, DSLV, NUGT, DUST, JNUG, JDST) are provided as supplementary, and not as “final”. This means that if a stop-loss or a target level is reached for any of the “additional instruments” (DGLD for instance), but not for the “main instrument” (gold in this case), we will view positions in both gold and DGLD as still open and the stop-loss for DGLD would have to be moved lower. On the other hand, if gold moves to a stop-loss level but DGLD doesn’t, then we will view both positions (in gold and DGLD) as closed. In other words, since it’s not possible to be 100% certain that each related instrument moves to a given level when the underlying instrument does, we can’t provide levels that would be binding. The levels that we do provide are our best estimate of the levels that will correspond to the levels in the underlying assets, but it will be the underlying assets that one will need to focus on regarding the sings pointing to closing a given position or keeping it open. We might adjust the levels in the “additional instruments” without adjusting the levels in the “main instruments”, which will simply mean that we have improved our estimation of these levels, not that we changed our outlook on the markets. We are already working on a tool that would update these levels on a daily basis for the most popular ETFs, ETNs and individual mining stocks.
Our preferred ways to invest in and to trade gold along with the reasoning can be found in the how to buy gold section. Additionally, our preferred ETFs and ETNs can be found in our Gold & Silver ETF Ranking.
As always, we'll keep you - our subscribers - updated should our views on the market change. We will continue to send out Gold & Silver Trading Alerts on each trading day and we will send additional Alerts whenever appropriate.
The trading position presented above is the netted version of positions based on subjective signals (opinion) from your Editor, and the automated tools (SP Indicators and the upcoming self-similarity-based tool).
As a reminder, Gold & Silver Trading Alerts are posted before or on each trading day (we usually post them before the opening bell, but we don't promise doing that each day). If there's anything urgent, we will send you an additional small alert before posting the main one.
=====
Latest Free Trading Alerts:
S&P 500 index remains at all-time high as investors react to economic data releases. Will uptrend continue even further?
Stock Trading Alert: Stocks Extended Short-Term Fluctuations Along Record Levels - No Weakness Yet
Although crude oil moved lower after the market’s open weakened by concerns over the situation in Ukraine and Greece, the commodity rebounded as weaker U.S. dollar supported the price. As a result, light crude gained 1.08% and climbed above an important resistance, but is it as bullish as it seems at the first sight?
Oil Trading Alert: Crude Oil – Double Top or Further Rally?
=====
Hand-picked precious-metals-related links:
Comfortably numb Fed watchers push gold price below $1,200
Global silver production up 3.8% in 2014
Here's one hedge fund not bailing on gold
Why ZIRP/NIRP Is Killing Fractional Reserve Banking & Forcing Deposits Into Gold
Banks allowed to import gold on consignment basis
Willem Middelkoop: A New Gold Standard In The Making
Doug Casey on ISIS, Gold, Oil, and What to Expect in 2015
=====
In other news:
Dollar slips after sideswipe from dovish Fed minutes
ECB’s first minutes eyed for QE disputes
Greece requests euro zone loan extension, offers big concessions
Did the Fed Just Enter the Currency Wars?
ECB Set to Publish Summary of QE Deliberations
Buffett spills Exxon stake: big hedge funds less bullish on U.S.
Caviar mixed with gold: The ultimate luxury?
=====
Thank you.
Sincerely,
Przemyslaw Radomski, CFA
Founder, Editor-in-chief
Gold & Silver Trading Alerts
Forex Trading Alerts
Oil Investment Updates
Oil Trading Alerts

