

Briefly: In our opinion speculative short positions (full) in gold, silver and mining stocks are justified from the risk/reward perspective. We are lowering the stop-loss levels, which means that we are effectively locking-in even bigger gains and at the same time we’re allowing the profits to increase.
Gold, mining stocks, and – especially – silver declined on Tuesday, which was quite likely to happen given silver’s fake breakout and the miners’ ultra-low-volume rally. The situation developed in a quite interesting way – what are the implications?
We can draw different conclusions based on the short- and long-term charts, at least in the case of gold. Let’s take a closer look (charts courtesy of http://stockcharts.com).
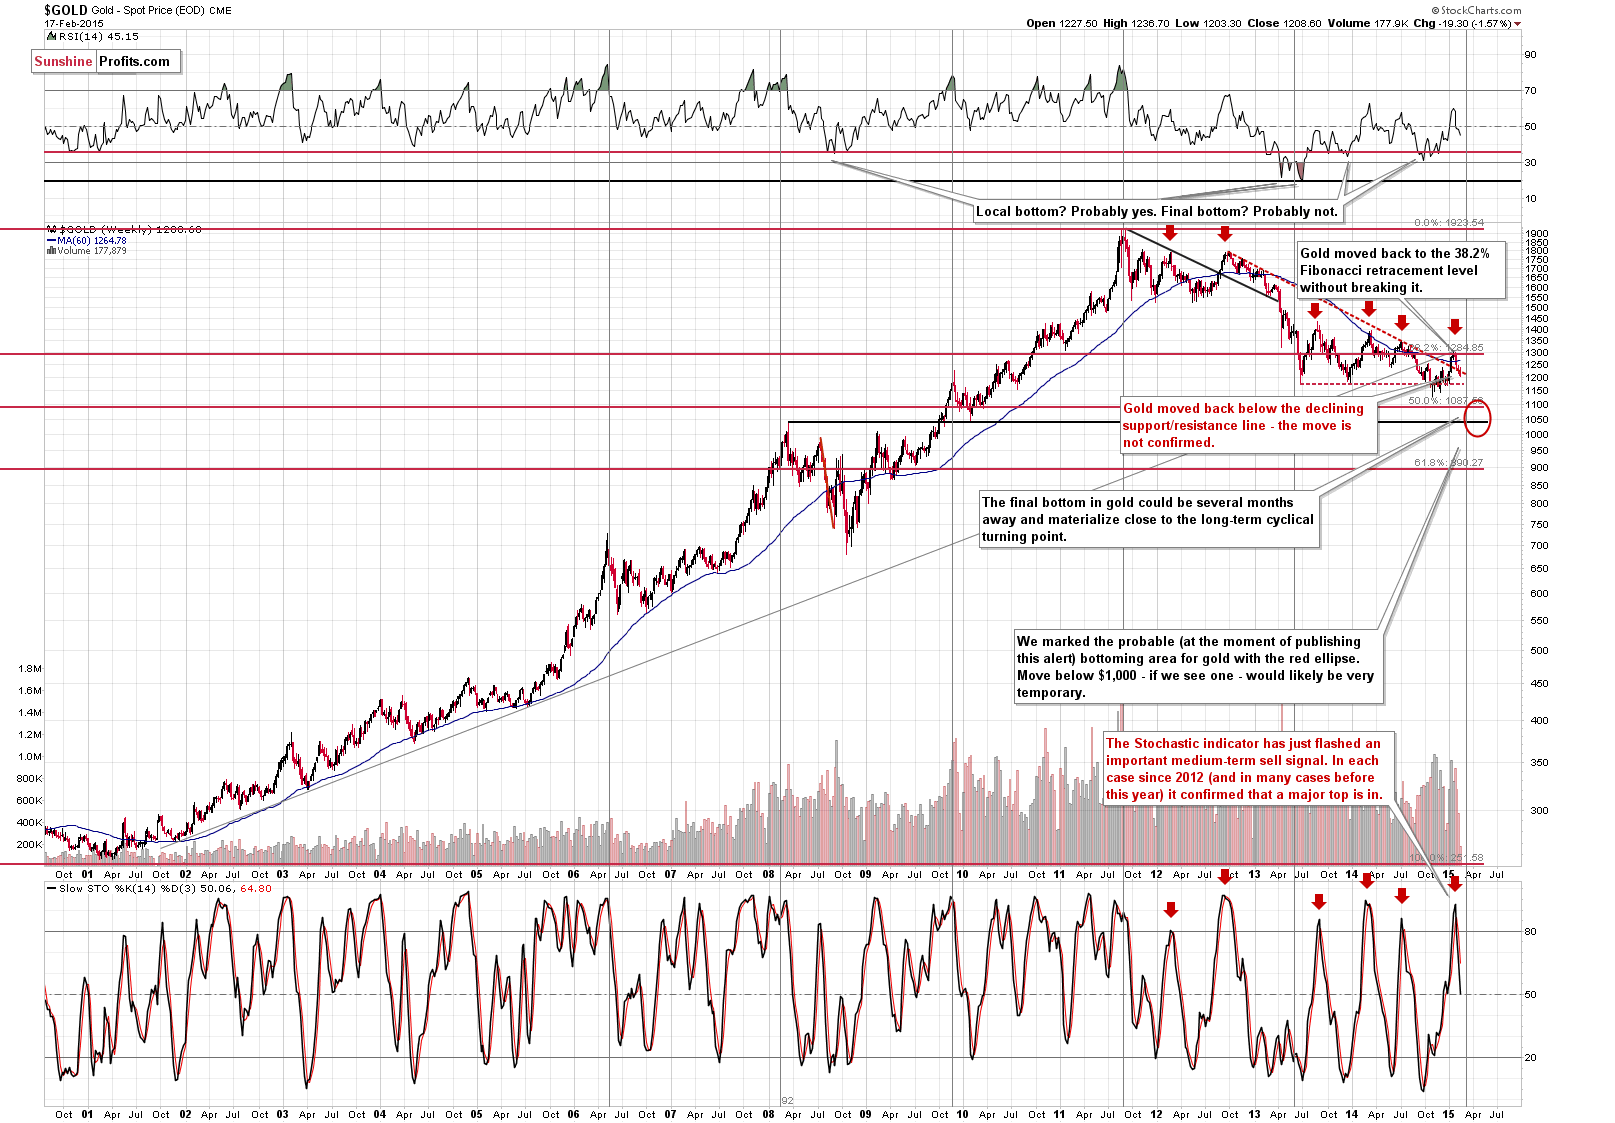
We previously commented on the above chart in the following way:
From the long-term perspective, absolutely nothing changed. The move higher is not even visible on the above chart. At the same time, let’s not forget that the previous move below the declining dashed resistance/support line was not significant and it is not confirmed. Consequently, the situation remains unchanged – the outlook is bearish, but not extremely bearish.
Gold moved below the declining support line. The breakdown is not confirmed, but it is definitely a bearish development. Did the situation become much more bearish based on the above chart? No. More bearish, yes, but not much more bearish.
What about the short-term chart?
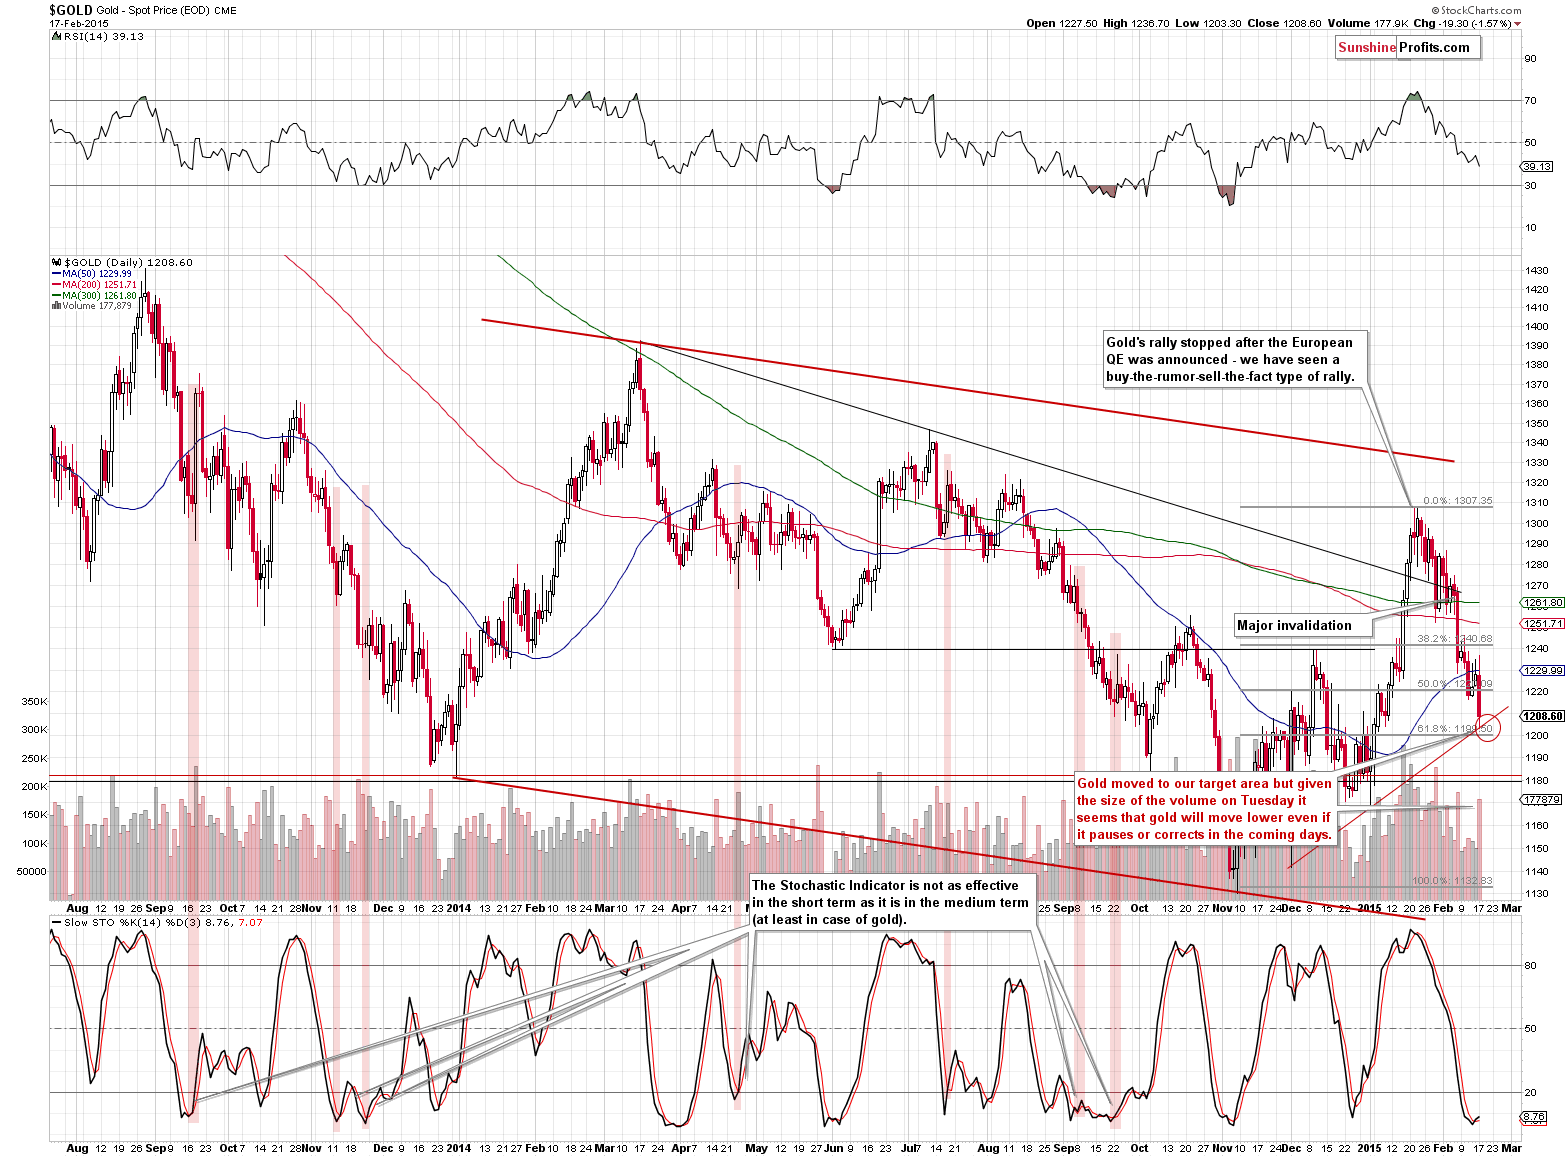
Here’s what we wrote previously:
We have just seen a buy signal from the Stochastic indicator based on daily closing prices, but, based on its previous performance, it’s not very bullish. There were a few cases when this signal was followed by significant rallies, but there were also many cases when gold either moved just a little higher or declined shortly after such a signal. The price / volume implications are bearish and they seem more important than the buy signal from the Stochastic indicator.
(…)
The analysis of price levels suggests that the next interim target (but not the final target for this decline) is $1,200. That’s where the 61.8% Fibonacci retracement level and the rising short-term support line intersect. Plus, the $1,200 is a round number, which makes it significant from the psychological perspective. Will gold form a bottom at this level? A local one – quite likely. A final one – not likely.
Gold moved to our target area yesterday and it almost reached the $1,200 level. As we indicated above, the very short-term situation improved based on this move as we can see a bounce here, but we don’t think that it will be significant or that it will last long. Gold declined on significant volume, so the implications are bearish, even though we could see some strength in the following days.
There was an interesting development in gold priced in the Australian dollar.
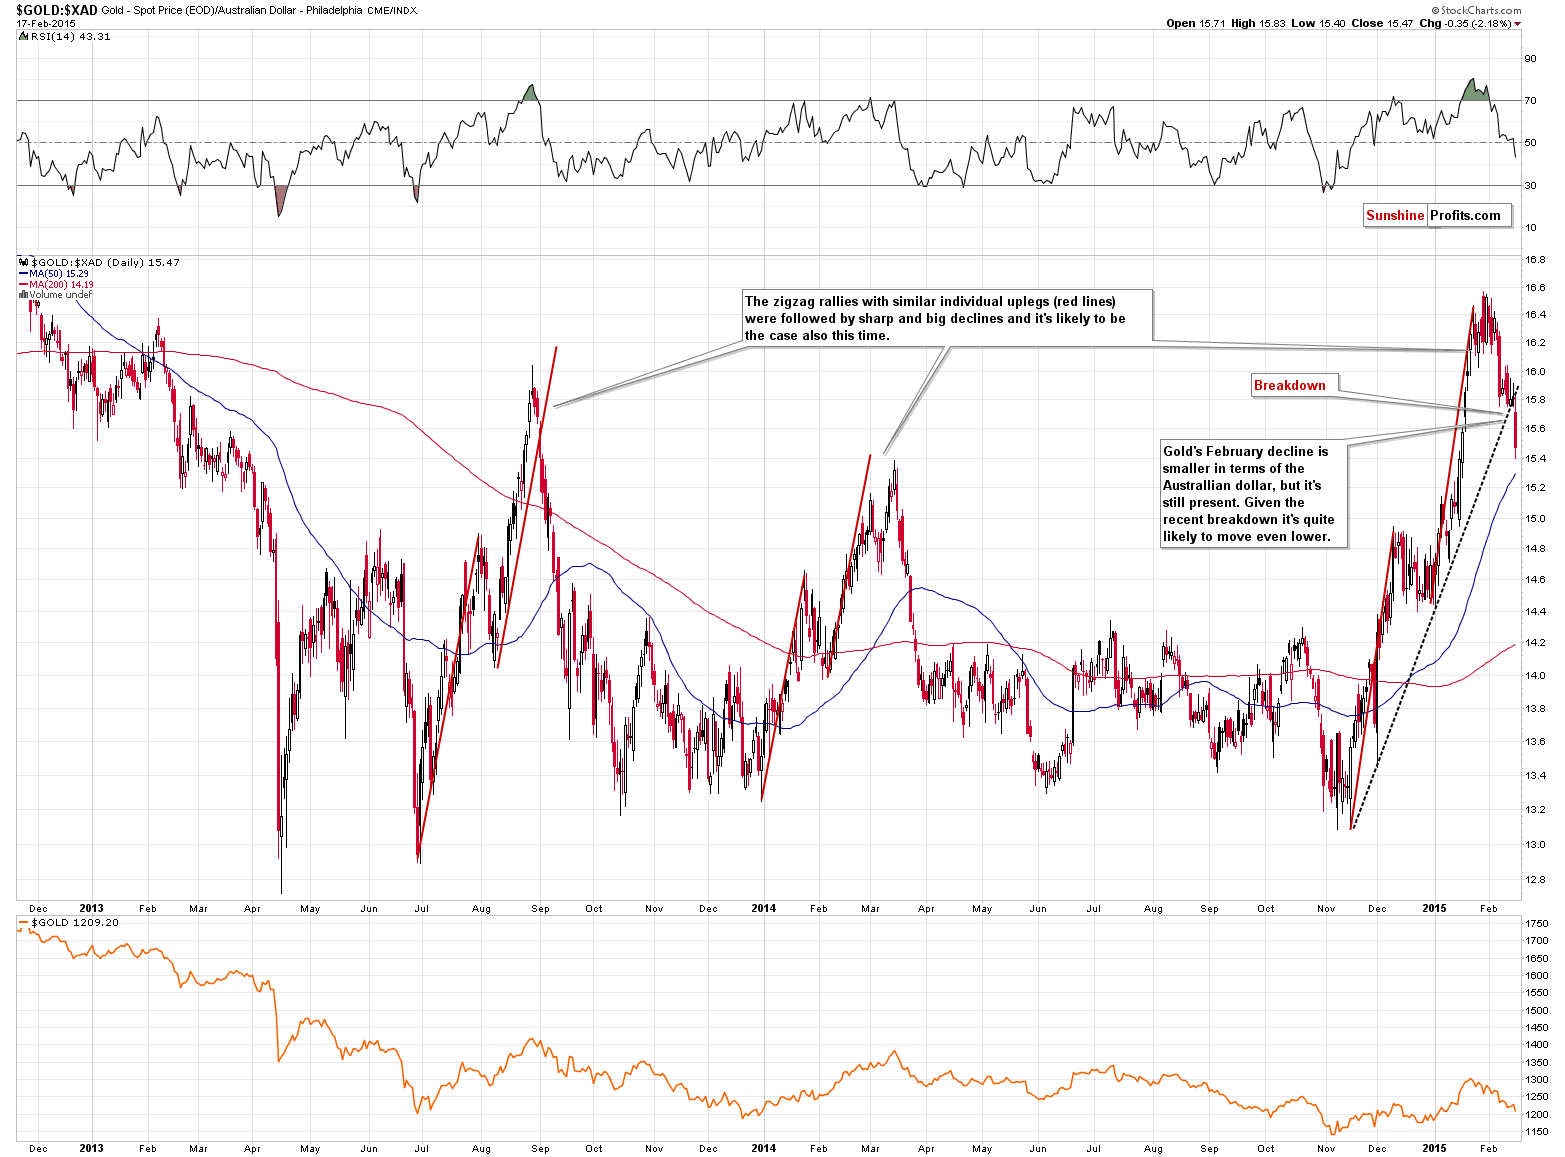
We have just seen a breakdown below the rising, sharp short-term support line. The breakdown was significant and was preceded by a specific type of rally – a zigzag pattern. There were 2 cases in the recent history when we saw such patterns and in both cases gold declined sharply and significantly shortly thereafter. While the unconfirmed breakdown would not be really bearish on its own (until it was confirmed), its combination with the fact that we are right after a zigzag rally is bearish.
All in all, while the situation deteriorated for the medium term, it improved a bit for the very short term.
What about silver?
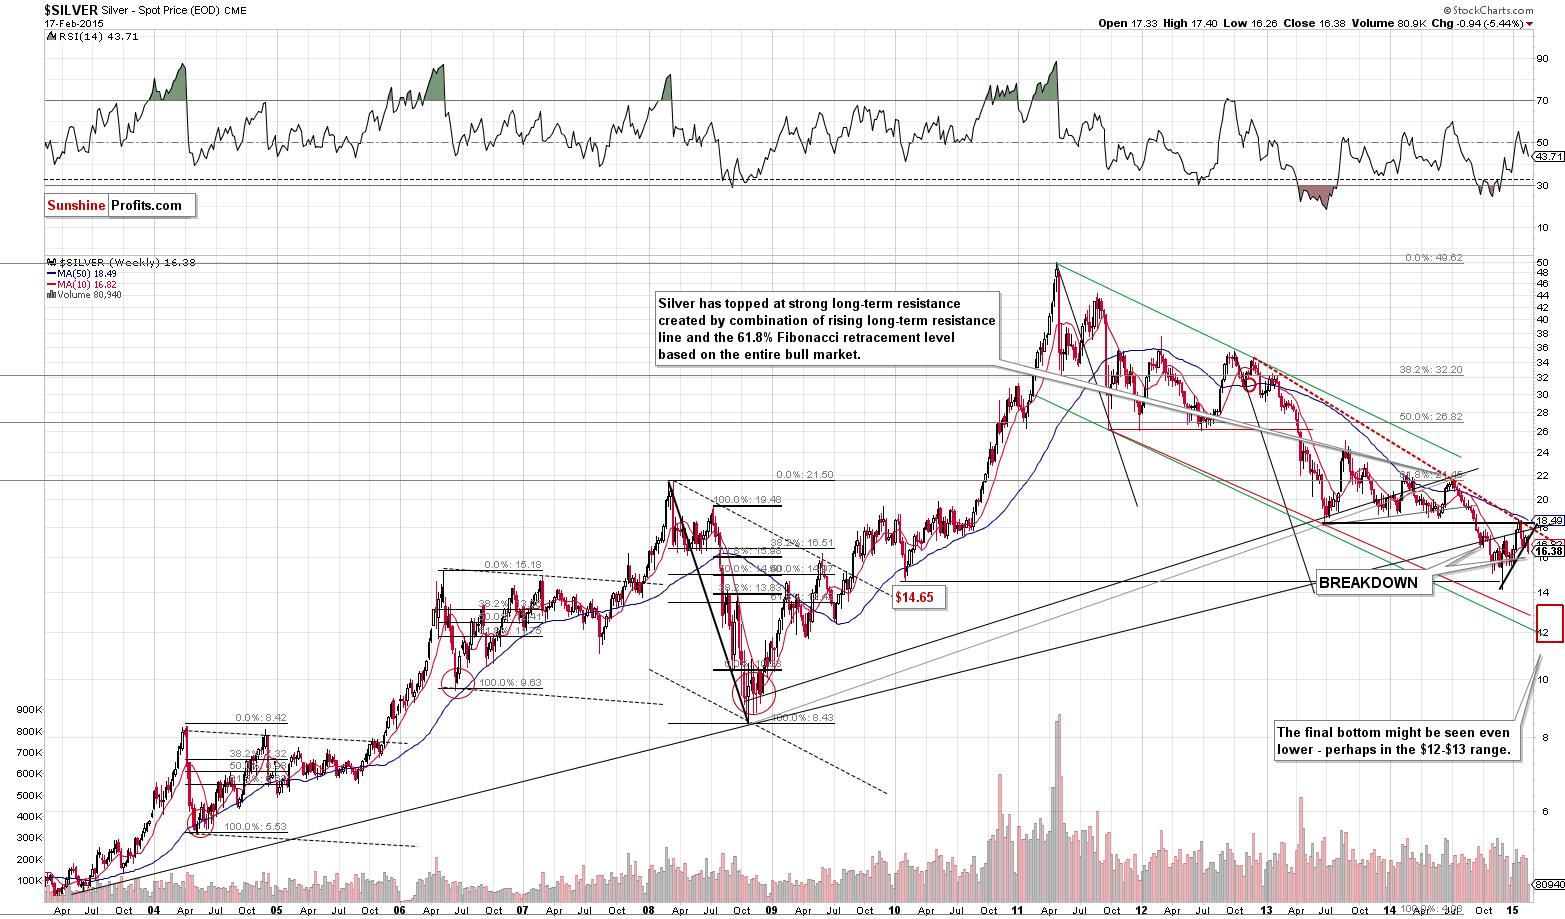
We previously wrote the following:
Moving on to the silver market, we see that there was no breakdown below the rising short-term support line – there was a move higher from it. Is this a bullish observation? Not really. Silver didn’t move above the rising long-term resistance line, so the outlook is just as it was previously – bearish. Silver recently corrected back to the previously broken 2013 low and then declined once again. It’s in the post-verification decline and on Friday we saw a bounce within a short-term downtrend – at least that’s what we can infer from the above chart.
Tuesday’s rally confirms the above bearish remarks. Silver declined and invalidated Friday’s strength. What’s important on the above chart is that we saw a visible breakdown below the rising support line. This is a major bearish signal for the coming weeks regardless of the possibility of a small bounce in the next few days.
What about the short-term signals?
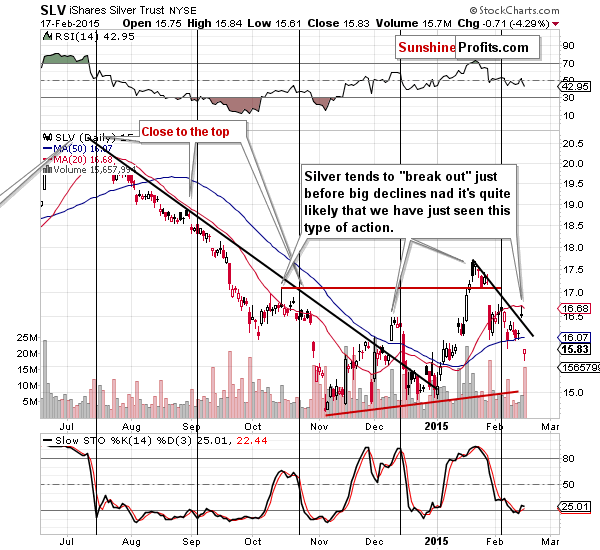
On a short-term basis we saw an invalidation of the previous “breakout”. Our previous comments remain up-to-date:
Silver is known for its fake breakouts and it seems that we have just seen one of them. Silver’s strength was confirmed neither by gold (small rally on low volume) nor by mining stocks (small rally on extremely low volume). This makes the breakout doubtful, even if we don’t take into account that silver rallied on volume that was not huge (we would expect it to be huge during a real breakout).
In most markets breakouts are followed by rallies. In silver, this is also the case sometimes, but it seems that in most cases breakouts are invalidated and followed by big declines. Please note silver’s action in late October 2014, mid-December 2014 and in late January 2015 – we saw visible breakouts that were followed by further declines.
It’s quite likely that we will see further declines in silver, especially that silver plunged on high volume on Tuesday. It moved not only back below the short-term rising support/resistance line, but also below the previous lows. The implications and outlook are bearish.
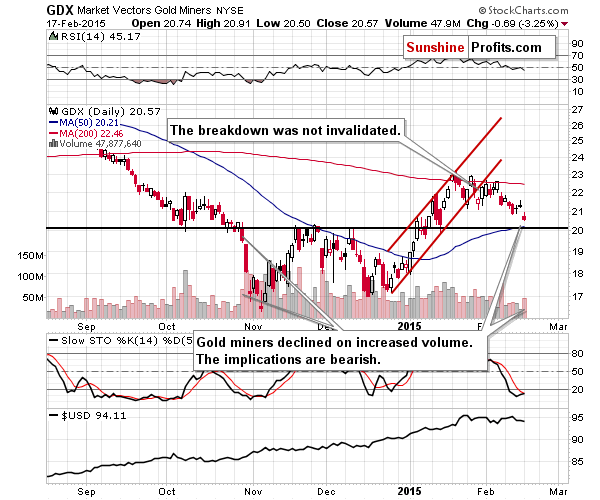
We previously wrote the following about mining stocks:
Friday’s action in mining stocks was similar to the one in gold, but the bearish implications are stronger in this case because the volume was lower.
It was not only lower than what we had seen in the previous days, but it’s the lowest daily volume that we’ve seen in months. The last time we saw volume that was similarly low during a daily upswing, was in late October 2014 (please recall that silver also “broke out” in October 2014). Back then miners declined quickly and significantly shortly after the very-low-volume session. Consequently, the situation deteriorated based on Friday’s move higher. The outlook is bearish.
The next support is slightly above the $20 level, at the Nov. and Dec. 2014 highs. It seems that it could correspond to the $1,200 level in gold if the entire precious metals sector moves lower.
The history repeated itself and we saw a daily decline once again. Please note that back in October, the first day after the low-volume session was only the beginning of the decline. Consequently, even though we have support at $20, the GDX ETF could move well below it before correcting in a meaningful way. The volume (which was relatively high during Tuesday’s decline) serves as a bearish confirmation.
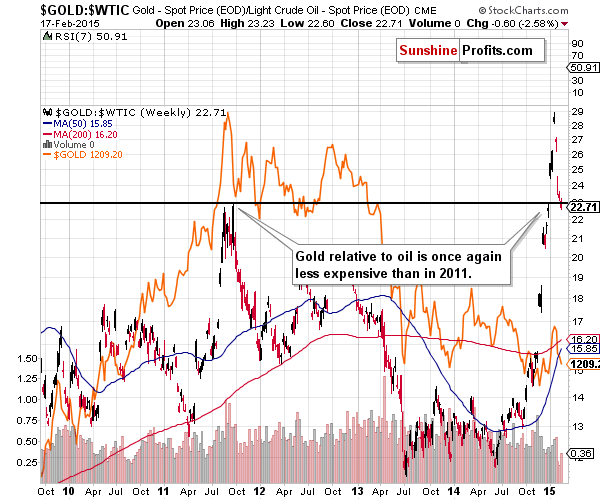
The final chart for today features the gold to oil ratio. The ratio moved much lower this month and is now below the 2011 high. This invalidation of the major breakout has bearish implications for gold and (which is less clear) bullish implications for crude oil. It serves as a rather unclear but still present bearish confirmation for gold.
Overall, we can summarize the situation in the same way as we did previously:
Summing up, the outlook remains bearish, but we haven’t seen enough bearish confirmations to believe that the outlook has significantly deteriorated (therefore we’re not making any adjustments to the long-term investment positions). It seems that we might see some kind of rebound very soon (as gold reached our interim target level), but at this time it’s unclear if it will really materialize (after all we are right after major sell signals from the Stochastic indicator for gold and the HUI Index), so all in all, we think its best to leave the current positions intact and wait for additional signals before taking any action.
We’re keeping the short-term position intact and we are moving the stop-loss orders (actually, they should be named differently at this time as if they were triggered, it would mean exiting the trade at a profit) lower, thus effectively securing even bigger gains and at the same time we’re allowing the profits on the short positions to become even bigger.
As always, we’ll keep you – our subscribers – informed.
To summarize:
Trading capital (our opinion): Short positions (full) in gold, silver and mining stocks with the following stop-loss orders and initial (!) target prices:
- Gold: initial target level: $1,180; stop-loss: $1,254, initial target level for the DGLD ETN: $75.23; stop loss for the DGLD ETN $63.16
- Silver: initial target level: $15.70 ; stop-loss: $17.63, initial target level for the DSLV ETN: $66.25 ; stop loss for DSLV ETN $45.40
- Mining stocks (price levels for the GDX ETN): initial target level: $18.40; stop-loss: $22.17, initial target level for the DUST ETN: $18.99 ; stop loss for the DUST ETN $11.32
In case one wants to bet on lower junior mining stocks' prices, here are the stop-loss details and initial target prices:
- GDXJ: initial target level: $23.37; stop-loss: $28.37
- JDST: initial target level: $12.30 ; stop-loss: $7.00
Long-term capital (our opinion): Half positions in gold, half positions in silver, half position in platinum and half position in mining stocks.
Insurance capital (our opinion): Full position
Please note that a full position doesn’t mean using all of the capital for a given trade. You will find details on our thoughts on gold portfolio structuring in the Key Insights section on our website.
As a reminder – “initial target price” means exactly that – an “initial” one, it’s not a price level at which we suggest closing positions. If this becomes the case (like it did in the previous trade) we will refer to these levels as levels of exit orders (exactly as we’ve done previously). Stop-loss levels, however, are naturally not “initial”, but something that, in our opinion, might be entered as an order.
Since it is impossible to synchronize target prices and stop-loss levels for all the ETFs and ETNs with the main markets that we provide these levels for (gold, silver and mining stocks – the GDX ETF), the stop-loss levels and target prices for other ETNs and ETF (among other: UGLD, DGLD, USLV, DSLV, NUGT, DUST, JNUG, JDST) are provided as supplementary, and not as “final”. This means that if a stop-loss or a target level is reached for any of the “additional instruments” (DGLD for instance), but not for the “main instrument” (gold in this case), we will view positions in both gold and DGLD as still open and the stop-loss for DGLD would have to be moved lower. On the other hand, if gold moves to a stop-loss level but DGLD doesn’t, then we will view both positions (in gold and DGLD) as closed. In other words, since it’s not possible to be 100% certain that each related instrument moves to a given level when the underlying instrument does, we can’t provide levels that would be binding. The levels that we do provide are our best estimate of the levels that will correspond to the levels in the underlying assets, but it will be the underlying assets that one will need to focus on regarding the sings pointing to closing a given position or keeping it open. We might adjust the levels in the “additional instruments” without adjusting the levels in the “main instruments”, which will simply mean that we have improved our estimation of these levels, not that we changed our outlook on the markets. We are already working on a tool that would update these levels on a daily basis for the most popular ETFs, ETNs and individual mining stocks.
Our preferred ways to invest in and to trade gold along with the reasoning can be found in the how to buy gold section. Additionally, our preferred ETFs and ETNs can be found in our Gold & Silver ETF Ranking.
As always, we'll keep you - our subscribers - updated should our views on the market change. We will continue to send out Gold & Silver Trading Alerts on each trading day and we will send additional Alerts whenever appropriate.
The trading position presented above is the netted version of positions based on subjective signals (opinion) from your Editor, and the automated tools (SP Indicators and the upcoming self-similarity-based tool).
As a reminder, Gold & Silver Trading Alerts are posted before or on each trading day (we usually post them before the opening bell, but we don't promise doing that each day). If there's anything urgent, we will send you an additional small alert before posting the main one.
=====
Latest Free Trading Alerts:
Today we make a short break from the news from the main financial markets in order to analyze gold demand trends for the full year 2014, published a few days ago by the World Gold Council. How did the demand for gold behave last year?
Gold News Monitor: Gold Demand in 2014
Earlier today, the ZEW Centre for Economic Research showed that its index of German economic sentiment rose by 4.6 points to 53.0 this month from January’s reading of 48.4, which is the highest reading since February 2014. Thanks to these positive numbers, EUR/USD bounced off this week’s lows and climbed above 1.1400. Will we see the exchange rate above 1.1500 later this week?
Forex Trading Alert: Good News for Euro
We didn’t see much action yesterday. The price itself didn’t move much, especially in comparison with what we had seen earlier, and the volume was relatively weak. This was the calm after the “storm” but are there any hints at the direction in which Bitcoin is headed?
Bitcoin Trading Alert: Bitcoin Suggests Yet Another Move
=====
Hand-picked precious-metals-related links:
Weakening Safe-Haven Bids for Gold
Paulson Keeps Gold Stake as Investors Lose Love for Metal
Soros Fund cut Market Vectors Gold Miner ETF stake in Q4 2014 -filing
Gold may see firmer floor ahead of Lunar New Year: Barclays
Gold price starting to look 'vulnerable' on seasonality: UBS
Shanghai gold market winds down
Mainland's gold imports from HK tumble 32% in 2014
This chart shows Grexit would send gold price to $2,000
=====
In other news:
BOJ's Kuroda: No immediate need to ease policy again
Greece Poised to Request Six-Month Loan Extension
Putin and Biden in war of words over Ukraine
Analysts still see more BOJ stimulus coming
=====
Thank you.
Sincerely,
Przemyslaw Radomski, CFA
Founder, Editor-in-chief
Gold & Silver Trading Alerts
Forex Trading Alerts
Oil Investment Updates
Oil Trading Alerts

