

Briefly: In our opinion speculative short positions (full) are currently justified from the risk/reward perspective. In other words, we are increasing the size of the speculative short position in the precious metals sector.
Gold finally plunged yesterday, which was not unexpected given how poorly gold reacted to the euro-QE. Yesterday’s session changed something that in turn made us change our approach toward the current trading position.
Let’s jump right into charts, starting with the USD Index (charts courtesy of http://stockcharts.com).
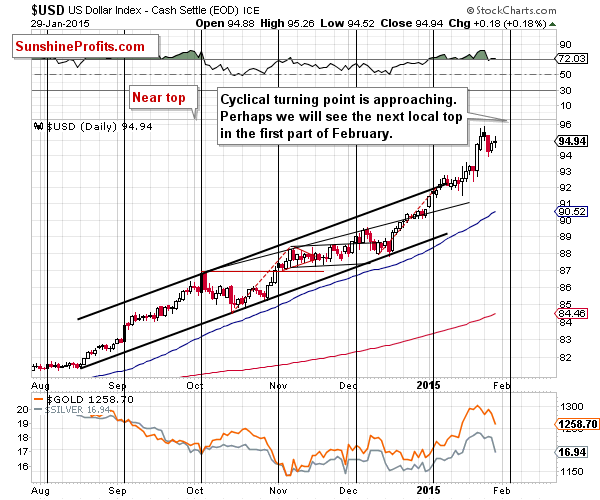
Our yesterday’s comments remain up-to-date:
The target price based on the long-term chart remains at 96.2, and the above chart tells us that this target could be reached in a week or so. The other possibility is that we will see a decline for an additional week and then another move up. Whatever the outcome for the next week is, it seems likely that the following week will bring a change in the short-term trend.
The direct implications for gold are unclear at this time, but it seems that if the USD index moves in one direction and then reverses, we will be able to see how gold currently reacts to the changes in the index. In other words, perhaps the euro-QE factor is already in the price and we will see the return to the “normal” negative correlation between the USD Index and gold, which will allow us to once again use the USD Index chart to estimate the future changes in the price of gold.
For now, we’ve seen gold’s strong reaction to the dollar’s relatively small daily upswing, so we might see much greater weakness in the PMs if the USD Index moves above 96. It could also be the case that gold reacted to yesterday’s employment numbers, not really to the USD move. The following days should tell us more.
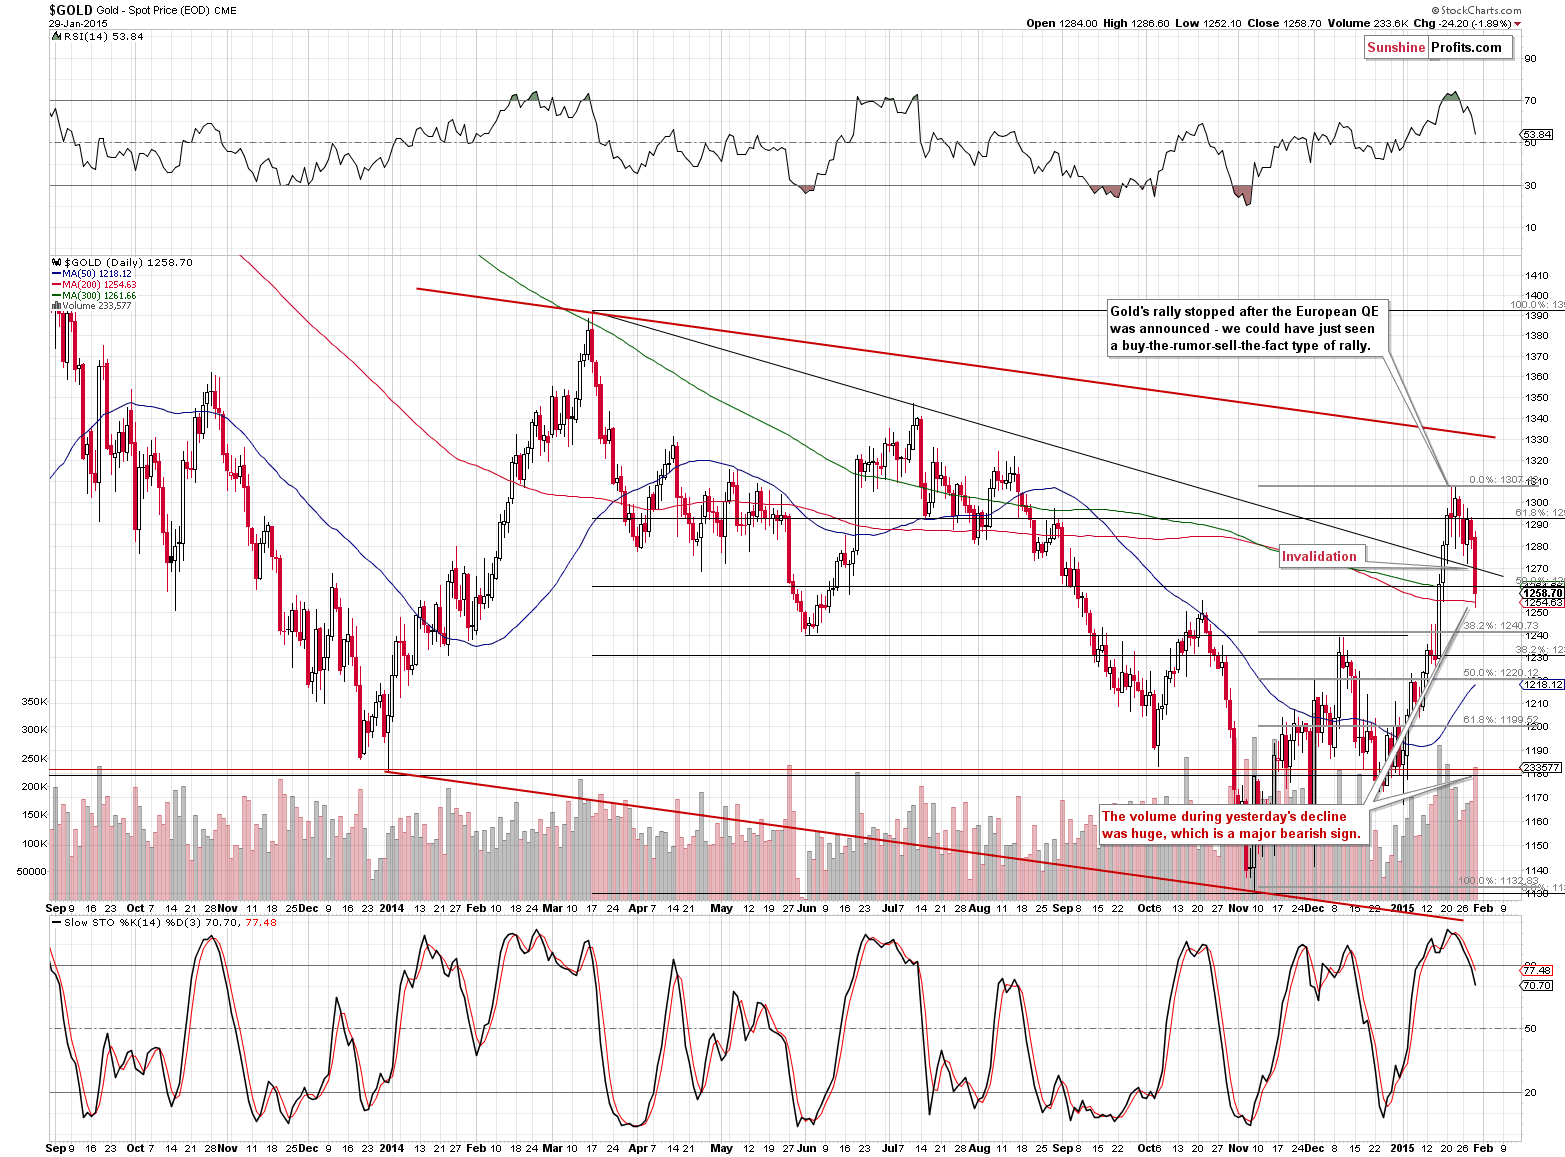
The gold chart, however, is already telling us that gold is likely to move lower and that by opening short positions before the Jan. 23 session, we opened them right after the top.
We previously wrote the following:
Will gold fall further? If we see a close back below the declining support line (based on the March and July 2014 highs) it will be a sign that we will see further declines without an additional move higher before that. At this time, the situation is not extremely bearish for the short term.
The previous breakout above the declining resistance line was invalidated yesterday and since this move took place on high volume and gold ended visibly below this line, it seems that we can view this move as confirmed.
Consequently, it seems that gold will move even lower in the short term.
How low can it go? It might be best to keep the short position intact until we see bullish signs, but at this time the highest of the target prices is the first Fibonacci retracement level – close to $1,240. The $1,200 level, which is approximately the 61.8% retracement, is even more likely to stop the current decline. Still, it seems that we are not seeing a local top in the USD Index and gold keeps declining, so perhaps we will see a move even below the 2014 lows. We will be monitoring the market for signs of strength and report to you accordingly.
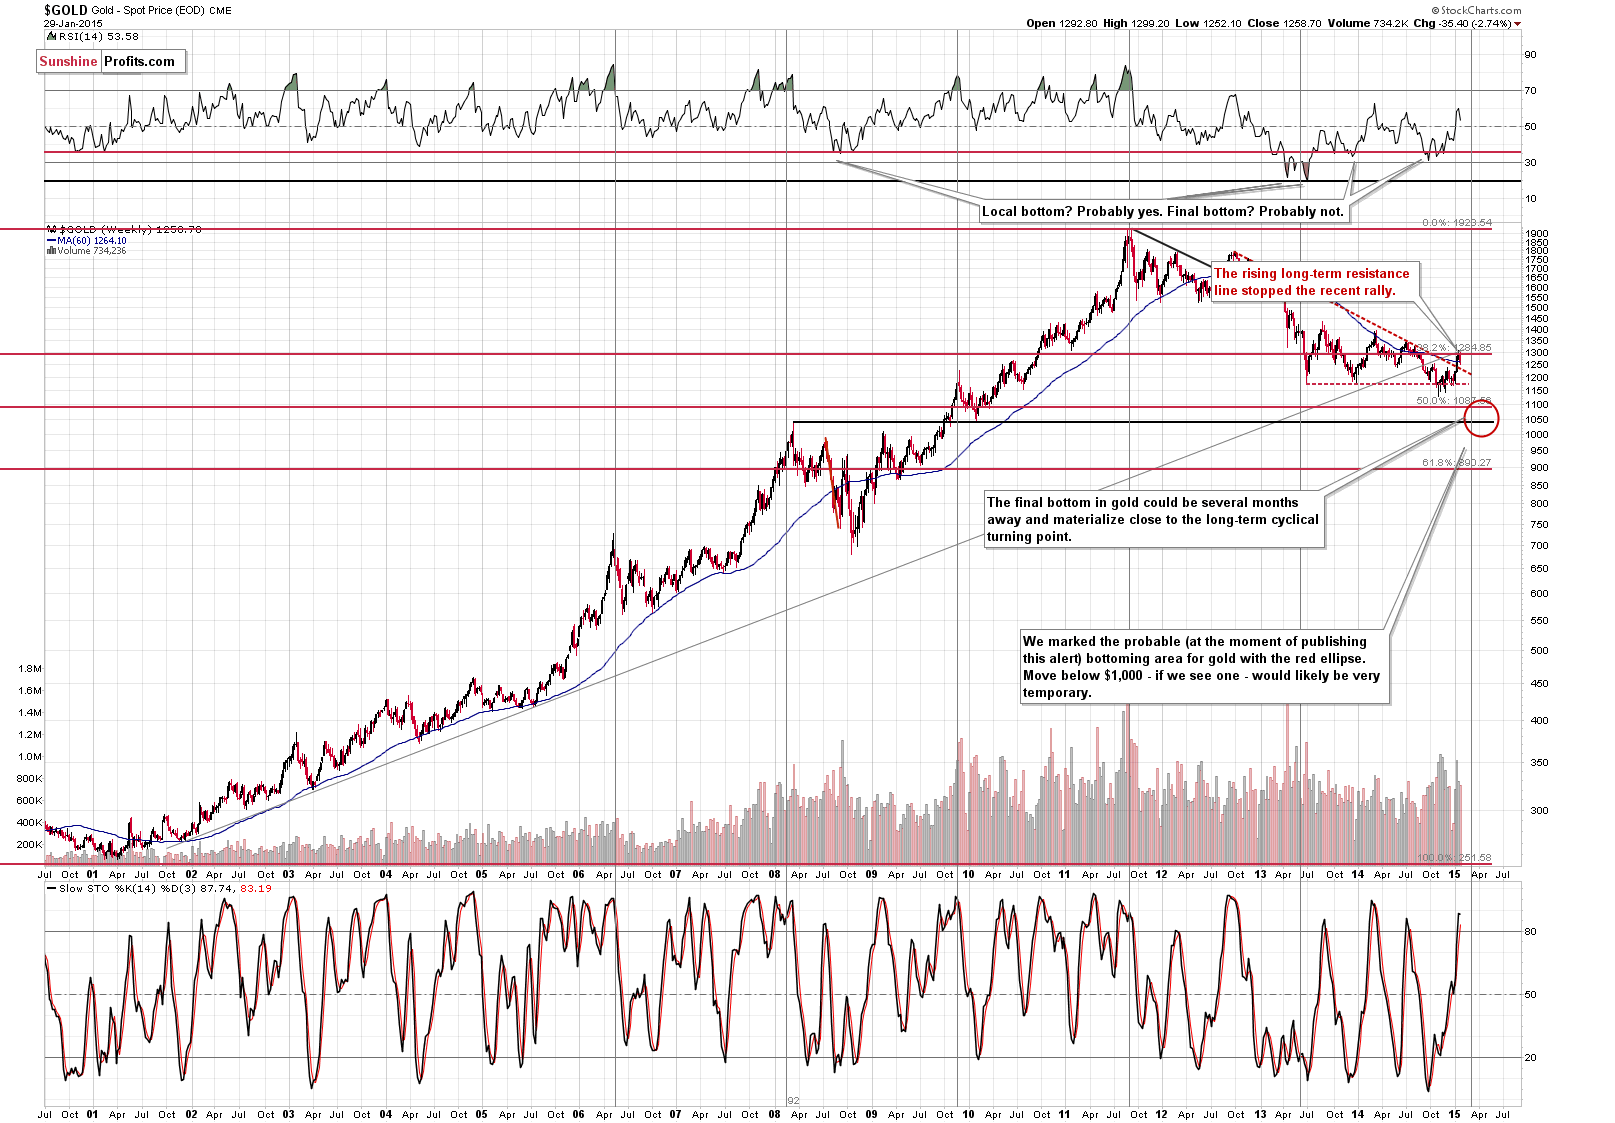
Let’s keep in mind that gold is quite likely to decline based on the long-term cyclical turning point. It seems probable that the next major bottom will be formed within the next several months – please see how effective these turning points were in the past cases.
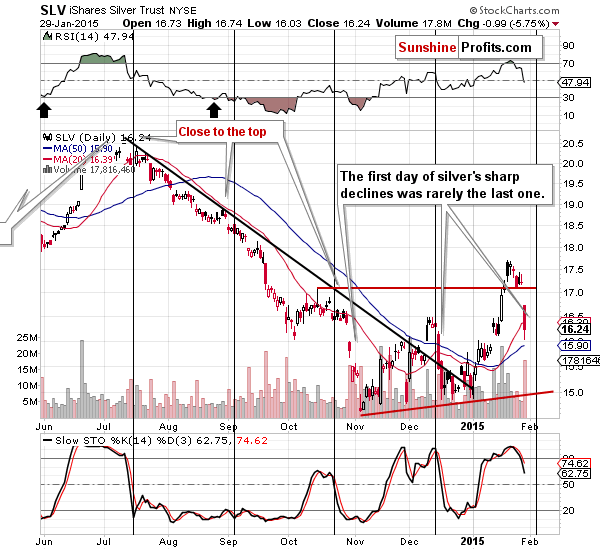
Speaking of turning points, we have those in the case of silver as well and the next one is relatively close. However, given the size of yesterday’s decline in the white metal, it seems that it can quickly move even lower. Please note that in the past, when silver started to suddenly plunge (the pace of the decline increased dramatically) it was usually not a single-day decline. In the recent past we had 2 similar cases. In the first one (late October 2014) after the first day silver still had most of the decline ahead of it, and in the second case (mid-December 2014), silver declined more or less half in the first day.
If the history is to repeat itself to a considerable extent, then we might see another $1 decline in silver very soon – quite likely to the rising red support line.
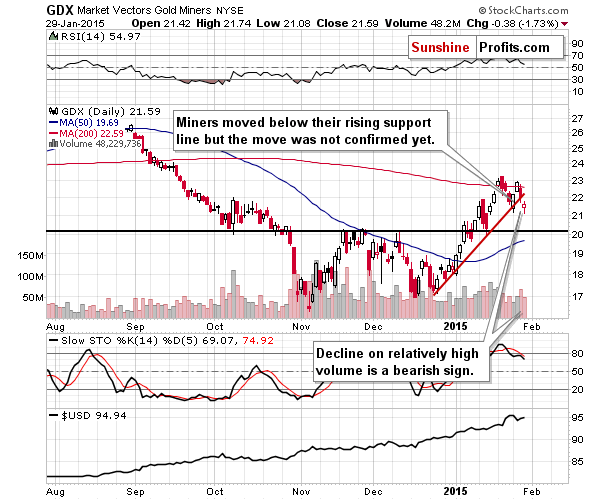
Yesterday we wrote the following about the GDX ETF chart:
The strength of the bearish price-volume signal in mining stocks is much more significant. In this case, the volume was much bigger than what we saw on Tuesday, so the implications are bearish. However, before we can say that the situation is much more bearish (and, thus, that perhaps increasing the size of the speculative short positions is a good idea) we will need to see a breakdown below the rising red support line. Miners closed more or less at it, so we need to see only a little more weakness in order to see this.
We have just seen this breakdown. The move was not as huge as it was in the case of gold, so we don’t view it as confirmed, but it’s still a bearish development. Let’s keep in mind that the general stock market rallied yesterday, which could have contributed to the miners’ strength. Perhaps this “strength” took the form of not declining as significantly as gold. All in all, the fact that miners closed below the support line is meaningful and bearish.
Summing up, , the short-term outlook deteriorated based on yesterday’s decline in the precious metals market and it seems that increasing the size of the speculative short position in gold, silver and mining stocks is now justified from the risk/reward perspective.
At the same time, it seems that staying 50% invested with the long-term investment capital (in gold, silver, platinum and mining stocks) is still a good idea. Is the situation extremely bearish for the medium term at this time? No – the European QE was announced, and we saw gold rallying strongly despite the soaring USD Index and these are not very unfavorable circumstances for the precious metals sector for the medium term. Technically, however, it seems that we will see metals and miners move lower, so being only partly invested (again, we’re discussing the long-term investments here only) is justified.
We will be re-evaluating these positions on a daily basis and if we think that the situation no longer justifies keeping speculative short positions or that adjustments to the long-term investment capital are necessary, we’ll let you know. As always, we’ll keep you – our subscribers – informed.
To summarize:
Trading capital (our opinion): Short positions (full) in gold, silver and mining stocks with the following stop-loss orders and initial (!) target prices:
- Gold: initial target level: $1,245; stop-loss: $1,318, initial target level for the DGLD ETN: $64.60 ; stop loss for the DGLD ETN $55.00
- Silver: initial target level: $16.13 ; stop-loss: $18.63, initial target level for the DSLV ETN: $62.07 ; stop loss for DSLV ETN $41.94
- Mining stocks (price levels for the GDX ETN): initial target level: $20.40 ; stop-loss: $24.23, initial target level for the DUST ETN: $15.55 ; stop loss for the DUST ETN $9.28
In case one wants to bet on lower junior mining stocks' prices, here are the stop-loss details and initial target prices:
- GDXJ: initial target level: $25.43 ; stop-loss: $32.17
- JDST: initial target level: $10.50 ; stop-loss: $5.19
Long-term capital (our opinion): Half positions in gold, half positions in silver, half position in platinum and half position in mining stocks.
Insurance capital (our opinion): Full position
Please note that a full position doesn’t mean using all of the capital for a given trade. You will find details on our thoughts on gold portfolio structuring in the Key Insights section on our website.
As a reminder – “initial target price” means exactly that – an “initial” one, it’s not a price level at which we suggest closing positions. If this becomes the case (like it did in the previous trade) we will refer to these levels as levels of exit orders (exactly as we’ve done previously). Stop-loss levels, however, are naturally not “initial”, but something that, in our opinion, might be entered as an order.
Since it is impossible to synchronize target prices and stop-loss levels for all the ETFs and ETNs with the main markets that we provide these levels for (gold, silver and mining stocks – the GDX ETF), the stop-loss levels and target prices for other ETNs and ETF (among other: UGLD, DGLD, USLV, DSLV, NUGT, DUST, JNUG, JDST) are provided as supplementary, and not as “final”. This means that if a stop-loss or a target level is reached for any of the “additional instruments” (DGLD for instance), but not for the “main instrument” (gold in this case), we will view positions in both gold and DGLD as still open and the stop-loss for DGLD would have to be moved lower. On the other hand, if gold moves to a stop-loss level but DGLD doesn’t, then we will view both positions (in gold and DGLD) as closed. In other words, since it’s not possible to be 100% certain that each related instrument moves to a given level when the underlying instrument does, we can’t provide levels that would be binding. The levels that we do provide are our best estimate of the levels that will correspond to the levels in the underlying assets, but it will be the underlying assets that one will need to focus on regarding the sings pointing to closing a given position or keeping it open. We might adjust the levels in the “additional instruments” without adjusting the levels in the “main instruments”, which will simply mean that we have improved our estimation of these levels, not that we changed our outlook on the markets. We are already working on a tool that would update these levels on a daily basis for the most popular ETFs, ETNs and individual mining stocks.
Our preferred ways to invest in and to trade gold along with the reasoning can be found in the how to buy gold section. Additionally, our preferred ETFs and ETNs can be found in our Gold & Silver ETF Ranking.
As always, we'll keep you - our subscribers - updated should our views on the market change. We will continue to send out Gold & Silver Trading Alerts on each trading day and we will send additional Alerts whenever appropriate.
The trading position presented above is the netted version of positions based on subjective signals (opinion) from your Editor, and the automated tools (SP Indicators and the upcoming self-similarity-based tool).
As a reminder, Gold & Silver Trading Alerts are posted before or on each trading day (we usually post them before the opening bell, but we don't promise doing that each day). If there's anything urgent, we will send you an additional small alert before posting the main one.
=====
Latest Free Trading Alerts:
Is it a new downtrend or just a retracement within medium-term consolidation? S&P 500 index extended its short-term downtrend yesterday, as it moved closer to the level of 2,000.
Stock Trading Alert: Stocks Suffered Some Further Losses Following FOMC Decision Release
=====
Hand-picked precious-metals-related links:
India overtakes China as world’s top gold consumer – GFMS
BRIEF-CME lowers margins for natgas, ups silver
Consensus forecast 2015 gold price average: DOWN
U.S. 10 month gold mine output falls 7% y/y
Will gold ever top $1,300 again?
=====
In other news:
Euro zone slides deeper into deflation
Markets brace for Big Oil profit plunge
=====
Thank you.
Sincerely,
Przemyslaw Radomski, CFA
Founder, Editor-in-chief
Gold & Silver Trading Alerts
Forex Trading Alerts
Oil Investment Updates
Oil Trading Alerts

