

Briefly: In our opinion speculative short positions (half) are currently justified from the risk/reward perspective.
Gold moved higher yesterday right after the session when miners outperformed gold. This seems like a bullish development – but is it?
Not really. The price is not the only factor that needs to be considered. The volume is the second. Let’s move right to the charts (charts courtesy of http://stockcharts.com).
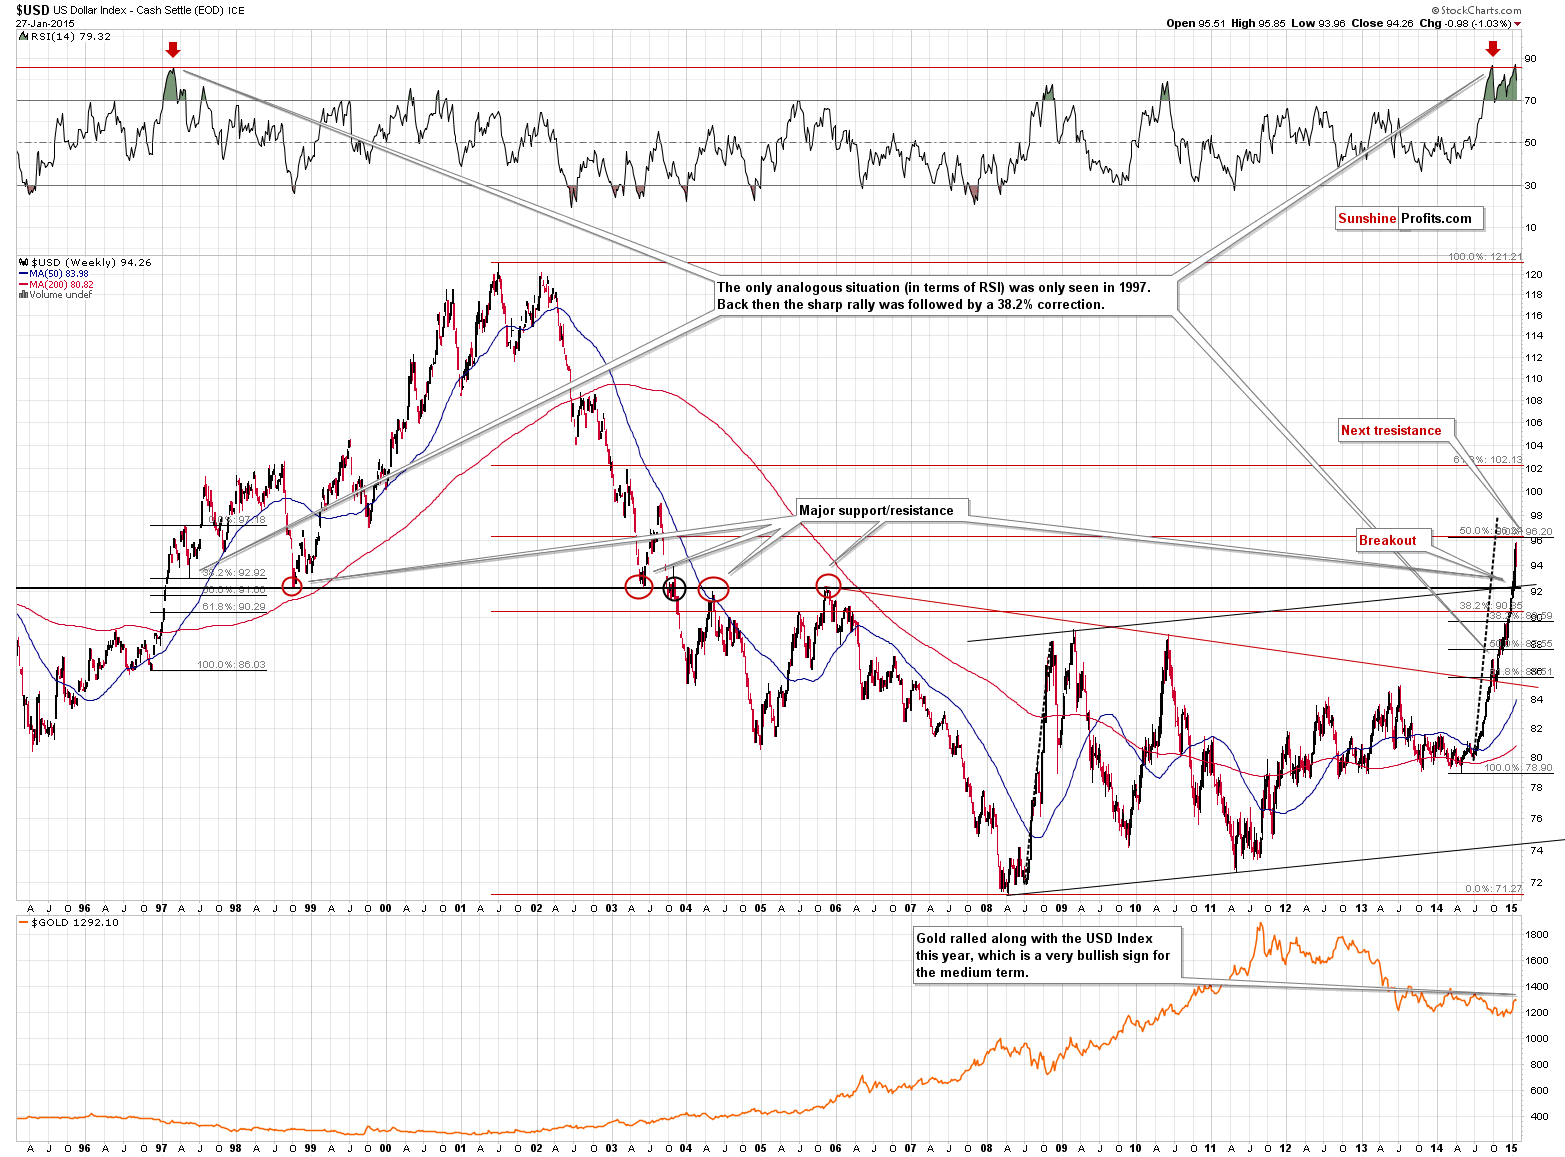
The USD Index rallied in the past several weeks but it declined quite significantly yesterday. Did gold soar? It moved a bit higher, but it didn’t move as high as one might’ve expected it to, based on a daily 0.98 decline in the USD Index. Consequently, our previous comments on the gold-USD link remain up-to-date:
Please note that since gold was not driven by weakness in the USD Index, but by the European QE announcement, it doesn’t have to be the case that if the USD index corrects, gold will rally. It could be the case that the USD Index will move above 96 and correct, but gold won’t rally at that time, but rather correct as well.
Gold did rally along with a move lower in the USD Index, but the size of gold’s upswing was small compared to the size of the U.S. dollar’s decline and, consequently, the implications are rather mixed. It was neither a bearish reaction, nor a bullish one – it was simply normal given that we already were in the early stages of a downtrend.
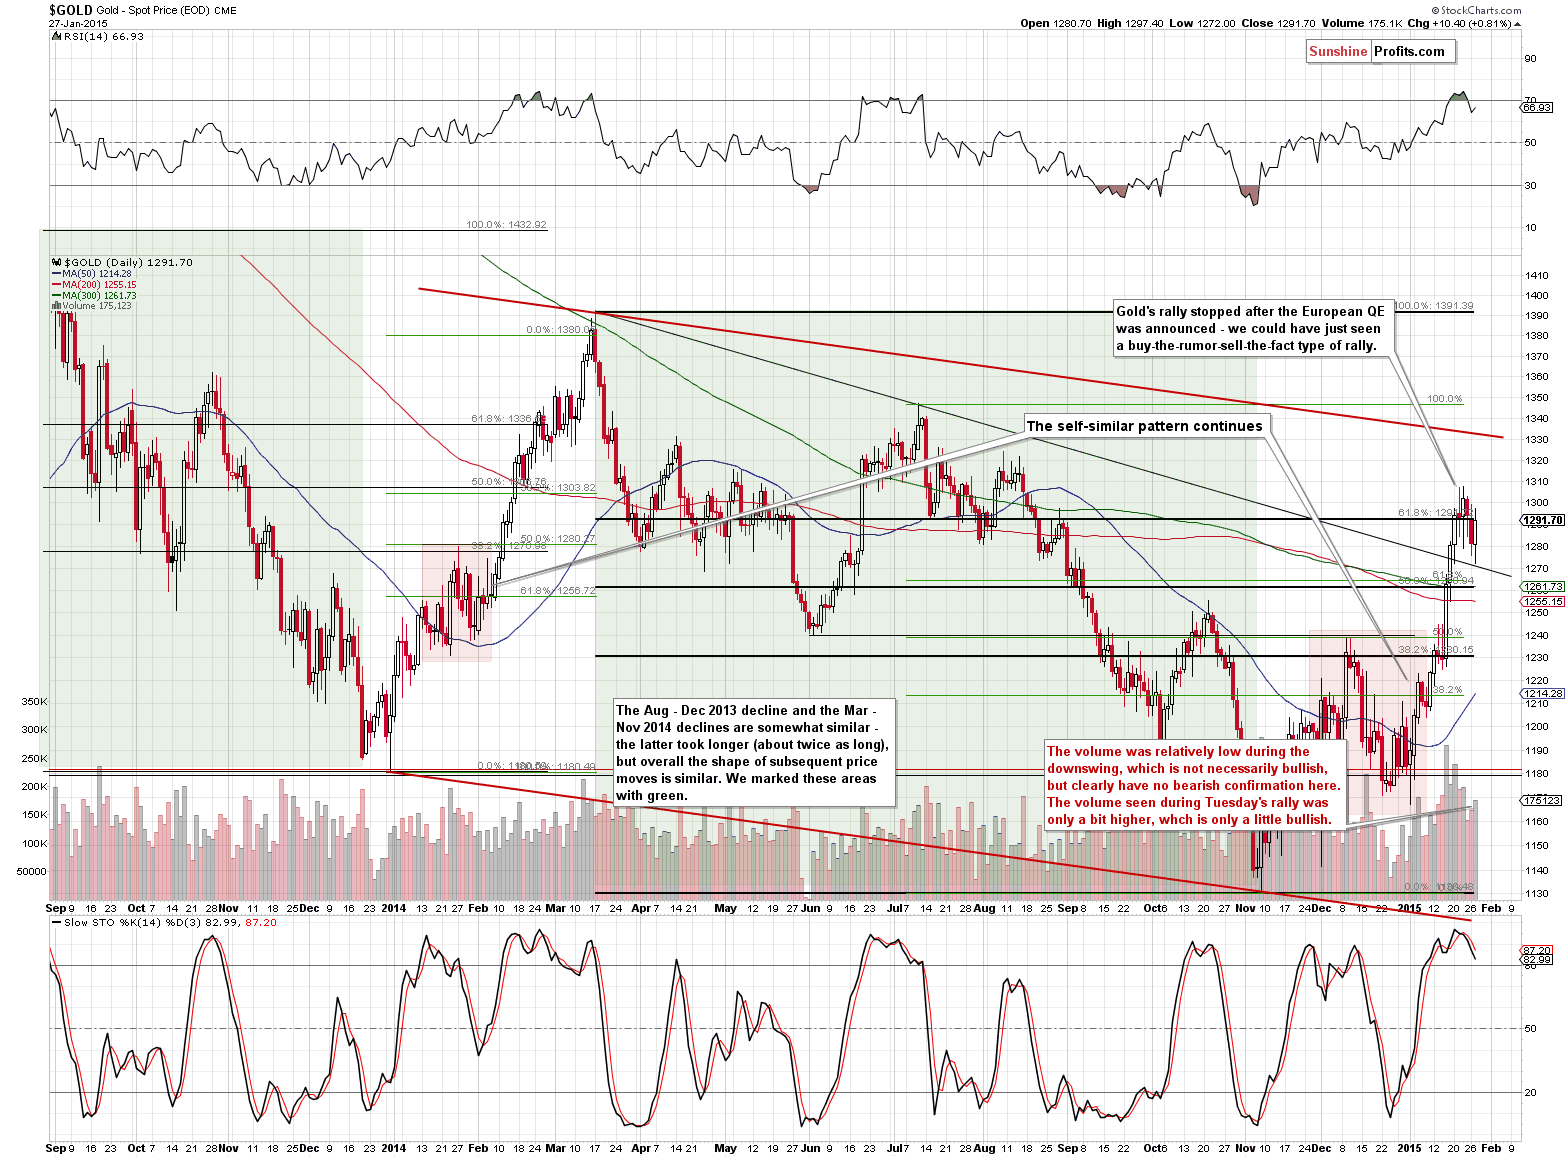
While the USD Index moved visibly below the previous high, the price of gold didn’t move above the previous high at all. The volume that accompanied the daily rally was a bit higher than the one that we had seen on the day before, but it was lower than the volume seen during the previous daily rallies. Overall there are little implications of yesterday’s price/volume action in gold.
Our previous comments remain up-to-date:
Will gold fall further? If we see a close back below the declining support line (based on the March and July 2014 highs) it will be a sign that we will see further declines without an additional move higher before that. At this time, the situation is not extremely bearish for the short term.
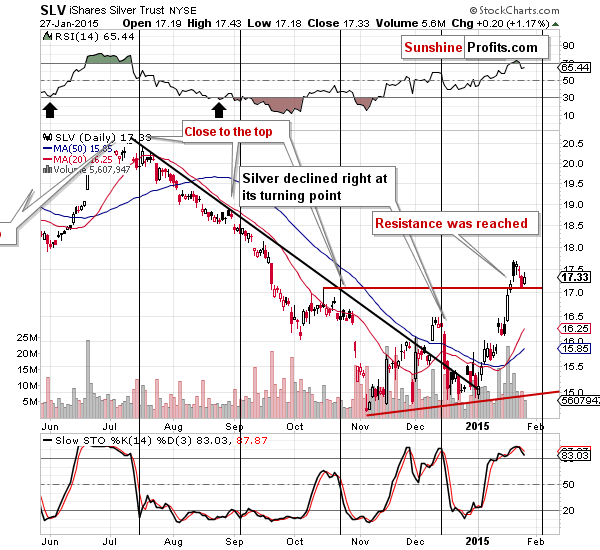
The SLV ETF had previously moved above the Oct. 2013 high, but in the last couple of days it declined once again, touching the previously-broken support. Has the move back up confirmed the breakout? Not really, because the volume was relatively low, which suggests that it was a counter-trend move.
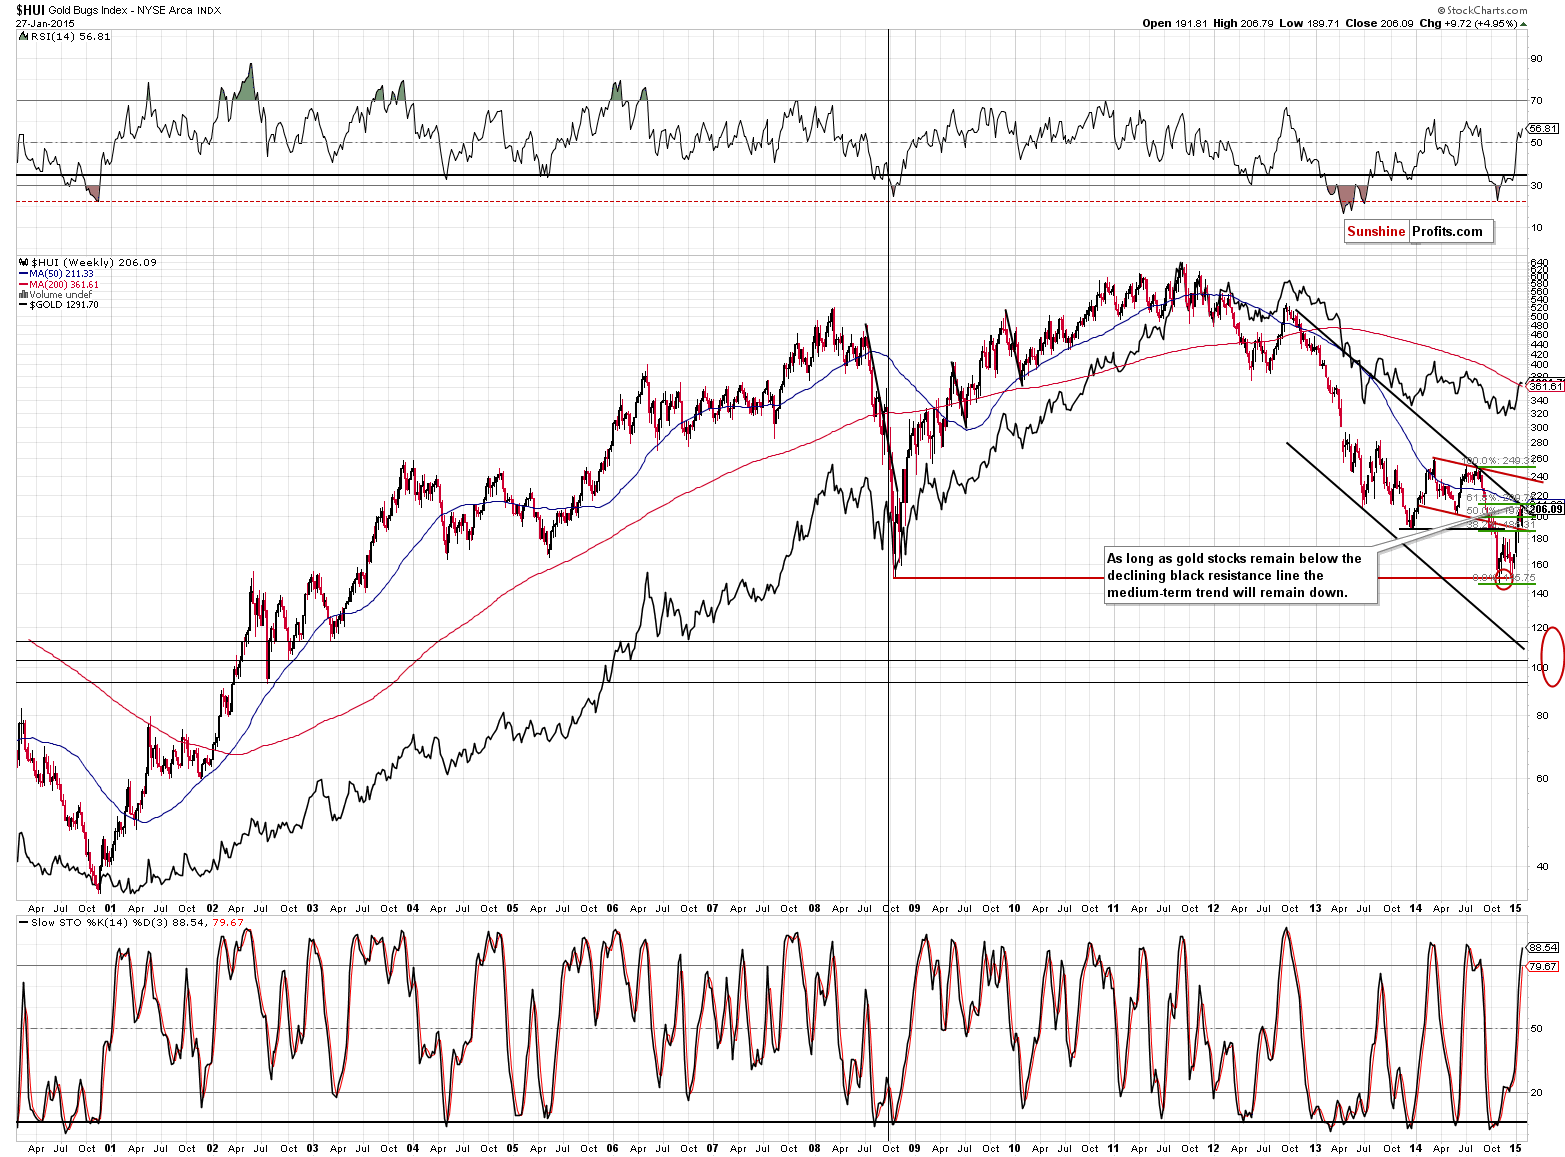
Gold stocks moved higher as well, but the move didn’t take the HUI Index above the declining resistance line.
Without a breakout, our previous comments still remain up-to-date:
The 3 important resistance levels intersect close to the 210 level: the 61.8% Fibonacci retracement, the 50-week moving average, and – most importantly – the declining long-term resistance line. If gold stocks manage to break and confirm the breakout above this level, it might serve as a confirmation that another major upswing is underway. For now, the current rally looks similar to the corrections that we saw in July 2013, in late-2013 to early-2014, and in June 2014.
This resistance (combination of resistances) was reached (…). The HUI Index is either about to break out or about to decline once again. Since there has been no breakout so far, the odds are that it will decline once again.
[Recently], gold stocks had a good reason to rally (Euro-QE announcement) but they didn’t – they declined. Consequently, it seems that the decline was indeed indicating weakness in the precious metals market.
As soon as the HUI Index moves back below its 2013 low and this move is confirmed, it will make further – significant – declines much more likely.
What about yesterday’s strength? There’s not much to tell since miners didn’t move above the declining resistance line. The above comments remain up-to-date and the outlook remains bearish.
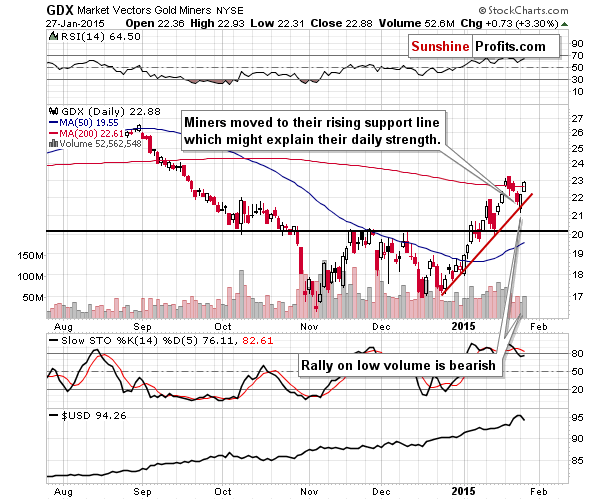
From the short-term perspective, mining stocks moved higher, but the move materialized on rather insignificant volume, so we don’t view it as really bullish.
Our previous comments remain up-to-date:
Mining stocks had a good technical reason to rally – they reached their rising support line. Consequently, the rally is not an unexpected or important development – it’s a way that one could expect a decline to take place – to see pauses when support levels are reached. The important thing here is that the miners’ “strength” is not really bullish, because yesterday’s rally took place on low volume. This is a bearish sign for the short term.
Overall, the situation didn’t change yesterday and we can summarize it in the same way as we did yesterday:
Summing up, based on the announcement of the QE program in the Eurozone, the situation in the precious metals market improved for the medium and long term, but based on the gold’s, silver’s and – most importantly – mining stocks’ reaction, the outlook deteriorated for the short term.
It seems that keeping the short positions in the precious metals is justified from the risk/reward perspective at this time as the profits on them are likely (in our opinion) to become even bigger. The trade is risky, so we are still using a limited amount of capital. We will likely increase it if we see additional bearish confirmations in the coming days.
We will be re-evaluating these positions on a daily basis and if we think that the situation no longer justifies keeping small short positions, we’ll let you know. As always, we’ll keep you – our subscribers – informed.
To summarize:
Trading capital (our opinion): Short positions (half) in gold, silver and mining stocks with the following stop-loss orders and initial (!) target prices:
- Gold: initial target level: $1,245; stop-loss: $1,318, initial target level for the DGLD ETN: $64.60 ; stop loss for the DGLD ETN $55.00
- Silver: initial target level: $16.73 ; stop-loss: $18.63, initial target level for the DSLV ETN: $55.63 ; stop loss for DSLV ETN $41.94
- Mining stocks (price levels for the GDX ETN): initial target level: $20.40 ; stop-loss: $24.23, initial target level for the DUST ETN: $15.55 ; stop loss for the DUST ETN $9.28
In case one wants to bet on lower junior mining stocks' prices, here are the stop-loss details and initial target prices:
- GDXJ: initial target level: $25.43 ; stop-loss: $32.17
- JDST: initial target level: $10.50 ; stop-loss: $5.19
Long-term capital (our opinion): Half positions in gold, half positions in silver, half position in platinum and half position in mining stocks.
Insurance capital (our opinion): Full position
Please note that a full position doesn’t mean using all of the capital for a given trade. You will find details on our thoughts on gold portfolio structuring in the Key Insights section on our website.
As a reminder – “initial target price” means exactly that – an “initial” one, it’s not a price level at which we suggest closing positions. If this becomes the case (like it did in the previous trade) we will refer to these levels as levels of exit orders (exactly as we’ve done previously). Stop-loss levels, however, are naturally not “initial”, but something that, in our opinion, might be entered as an order.
Since it is impossible to synchronize target prices and stop-loss levels for all the ETFs and ETNs with the main markets that we provide these levels for (gold, silver and mining stocks – the GDX ETF), the stop-loss levels and target prices for other ETNs and ETF (among other: UGLD, DGLD, USLV, DSLV, NUGT, DUST, JNUG, JDST) are provided as supplementary, and not as “final”. This means that if a stop-loss or a target level is reached for any of the “additional instruments” (DGLD for instance), but not for the “main instrument” (gold in this case), we will view positions in both gold and DGLD as still open and the stop-loss for DGLD would have to be moved lower. On the other hand, if gold moves to a stop-loss level but DGLD doesn’t, then we will view both positions (in gold and DGLD) as closed. In other words, since it’s not possible to be 100% certain that each related instrument moves to a given level when the underlying instrument does, we can’t provide levels that would be binding. The levels that we do provide are our best estimate of the levels that will correspond to the levels in the underlying assets, but it will be the underlying assets that one will need to focus on regarding the sings pointing to closing a given position or keeping it open. We might adjust the levels in the “additional instruments” without adjusting the levels in the “main instruments”, which will simply mean that we have improved our estimation of these levels, not that we changed our outlook on the markets. We are already working on a tool that would update these levels on a daily basis for the most popular ETFs, ETNs and individual mining stocks.
Our preferred ways to invest in and to trade gold along with the reasoning can be found in the how to buy gold section. Additionally, our preferred ETFs and ETNs can be found in our Gold & Silver ETF Ranking.
As always, we'll keep you - our subscribers - updated should our views on the market change. We will continue to send out Gold & Silver Trading Alerts on each trading day and we will send additional Alerts whenever appropriate.
The trading position presented above is the netted version of positions based on subjective signals (opinion) from your Editor, and the automated tools (SP Indicators and the upcoming self-similarity-based tool).
As a reminder, Gold & Silver Trading Alerts are posted before or on each trading day (we usually post them before the opening bell, but we don't promise doing that each day). If there's anything urgent, we will send you an additional small alert before posting the main one.
=====
Latest Free Trading Alerts:
We saw very significant appreciation yesterday. The volume shot up. This was the highest level of volume since the violent rebound of Jan. 15 and Bitcoin hit a high of over $300. Today, the currency has gone down relatively significantly. This looks like a very important move. Is it, in our opinion?
Bitcoin Trading Alert: Tense Days Ahead
Yesterday, the U.S. Commerce Department showed that total durable goods orders dropped 3.4% last month, missing expectations for a gain of 0.5%, while core durable goods orders (without volatile transportation items) dropped by 0.8% in the previous month, disappointing forecasts for a 0.6% gain. Thanks to these numbers, AUD/USD extended gains, invalidating a breakdown below an important support level. Is it enough to trigger further rally?
Forex Trading Alert: AUD/USD – Invalidation of Breakdown
=====
Hand-picked precious-metals-related links:
Goldman Sees Commodities as Worst Pick Before Year-End Rally
ScotiaMocatta Precious Metals 2015 Forecast
Dutch Central Bank Says It Didn't Buy Gold In December
Randgold's Kibali ramp-up on track for 600koz
=====
In other news:
Deflationary Pressure Is Building
Russian government outlines $35 billion anti-crisis plan
Everyone is scared: Nobel Prize winner Shiller
=====
Thank you.
Sincerely,
Przemyslaw Radomski, CFA
Founder, Editor-in-chief
Gold & Silver Trading Alerts
Forex Trading Alerts
Oil Investment Updates
Oil Trading Alerts

