

Briefly: In our opinion (full) speculative long positions in gold, silver and mining stocks are currently justified from the risk/reward perspective. Being on the long side of the precious metals market with half of the long-term investment capital seems justified from the risk/reward perspective.
Gold closed much higher last week and the daily rallies were accompanied by high volume. Gold managed to do so despite the initial move higher in the USD Index. Initial, because the USD finally turned south and pushed gold and miners even higher. With this kind of strength it seems that we can expect the rally to continue.
In short, the situation developed in tune with our expectations and this made the rally even more probable. In the last couple of days (except for Friday) the USD Index continued to move higher and the precious metals sector refused to move much lower – the declines were small and they were accompanied by low volume. When the USD finally declined – on Friday – gold and gold stocks rallied more significantly and on higher volume. The short-term trend seems to be up and the rally is likely to continue in the following days.
Let’s take a closer look at the charts (charts courtesy of http://stockcharts.com).
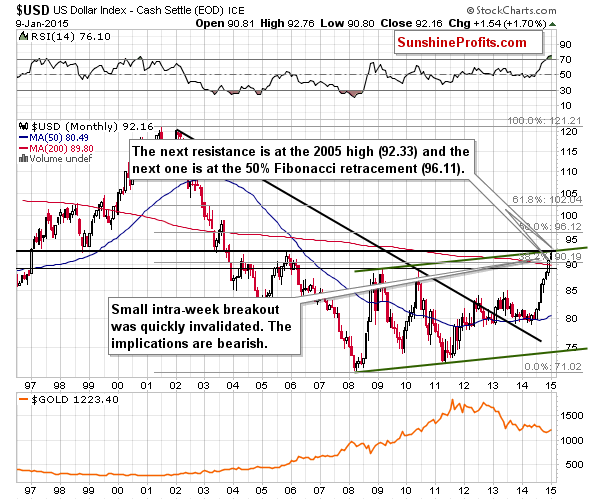
In the previous alerts we emphasized the significance of the long-term resistance that was just reached. It – combined with short-term resistance and the cyclical turning point – was likely to stop the current rally and trigger a correction. It seems that we are seeing the beginning thereof.
The USD Index moved a little above the long-term resistance last week, but this “breakout” was quickly invalidated and the USD ended the week below the key resistance. In fact, the weekly reversal is a bearish sign on its own.
Overall, the USD Index rallied by 0.79% (0.73) last week. Did gold decline by as much?
Not at all – it rallied almost 3% ($33.60). Gold is clearly showing strength relative to the USD Index. It was reluctant to decline in spite of the negative signs from the USD Index and finally it even managed to rally despite a continuous move up in the USD. If the USD declines – and it’s probably about to decline – gold’s rally will be likely to accelerate.
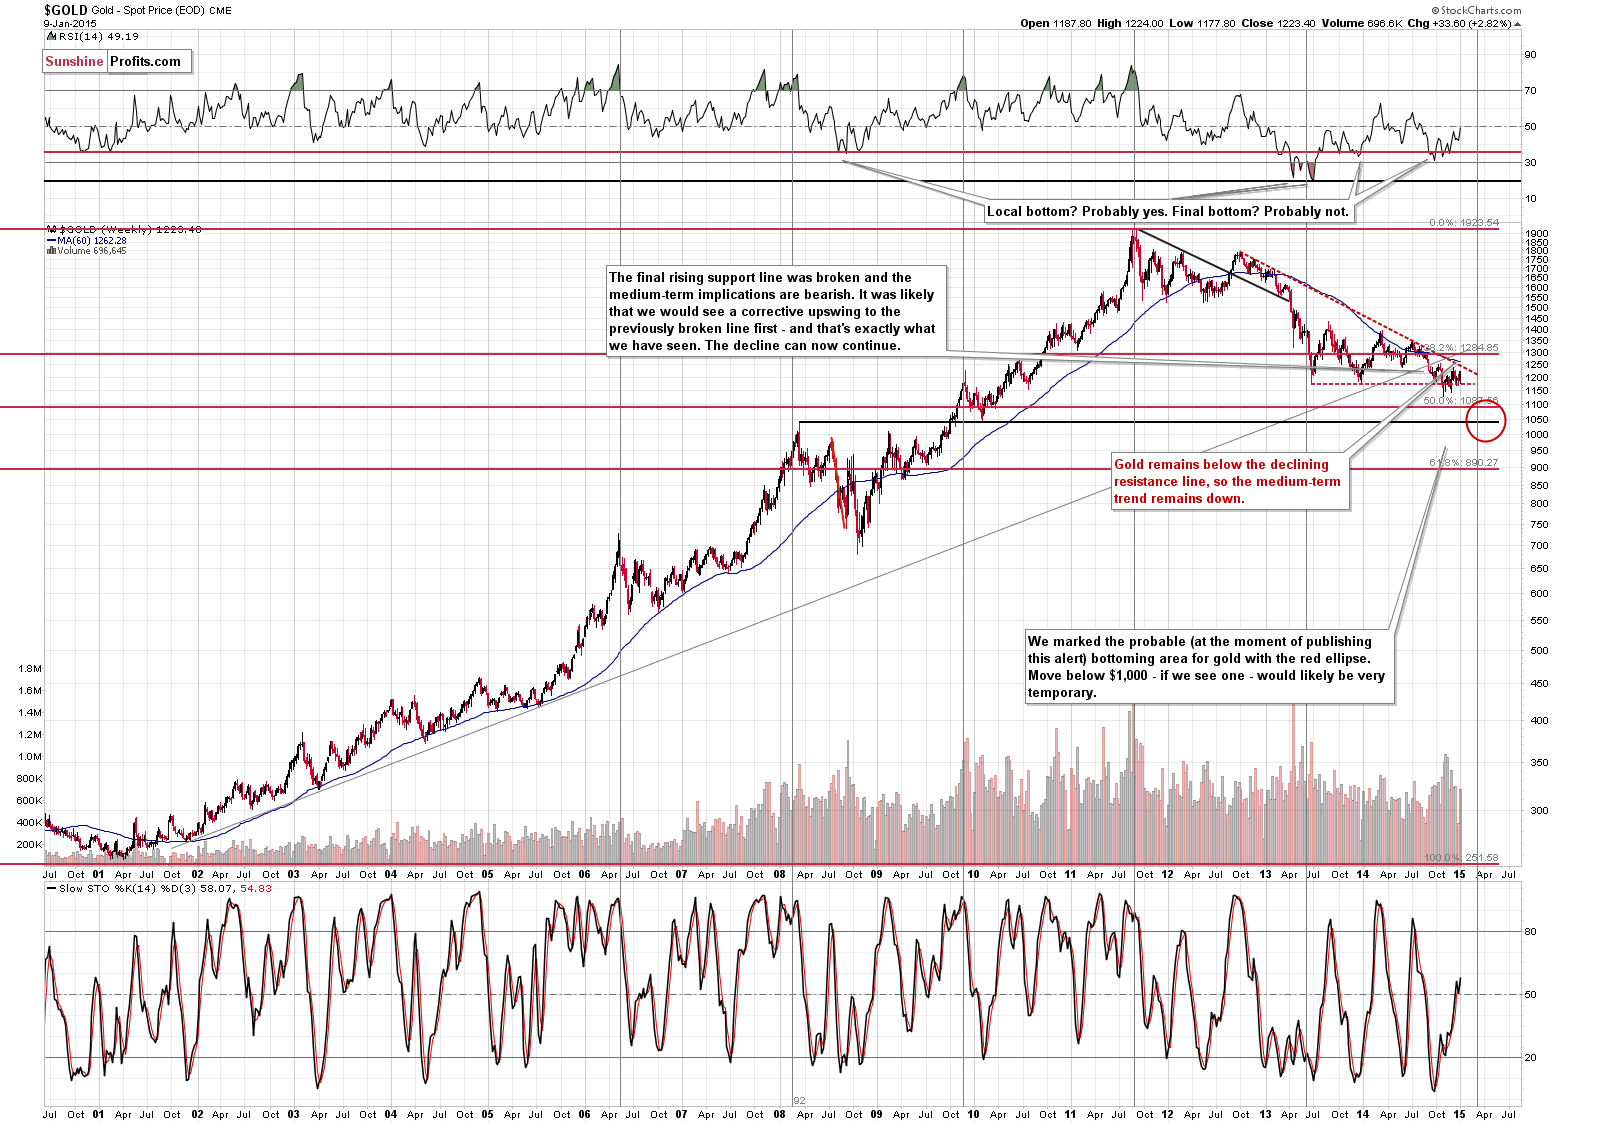
The declining medium-term resistance line (currently at about $1,250) could stop or pause the current rally, but given the potential size of the U.S. dollar’s decline (about 5 index points) and the way gold reacts to the dollar’s weakness, we shouldn’t be surprised to see gold moving above this line.
The $1,260 - $1,280 range seems more probable. Our previous comments regarding the target and the above chart remain up-to-date:
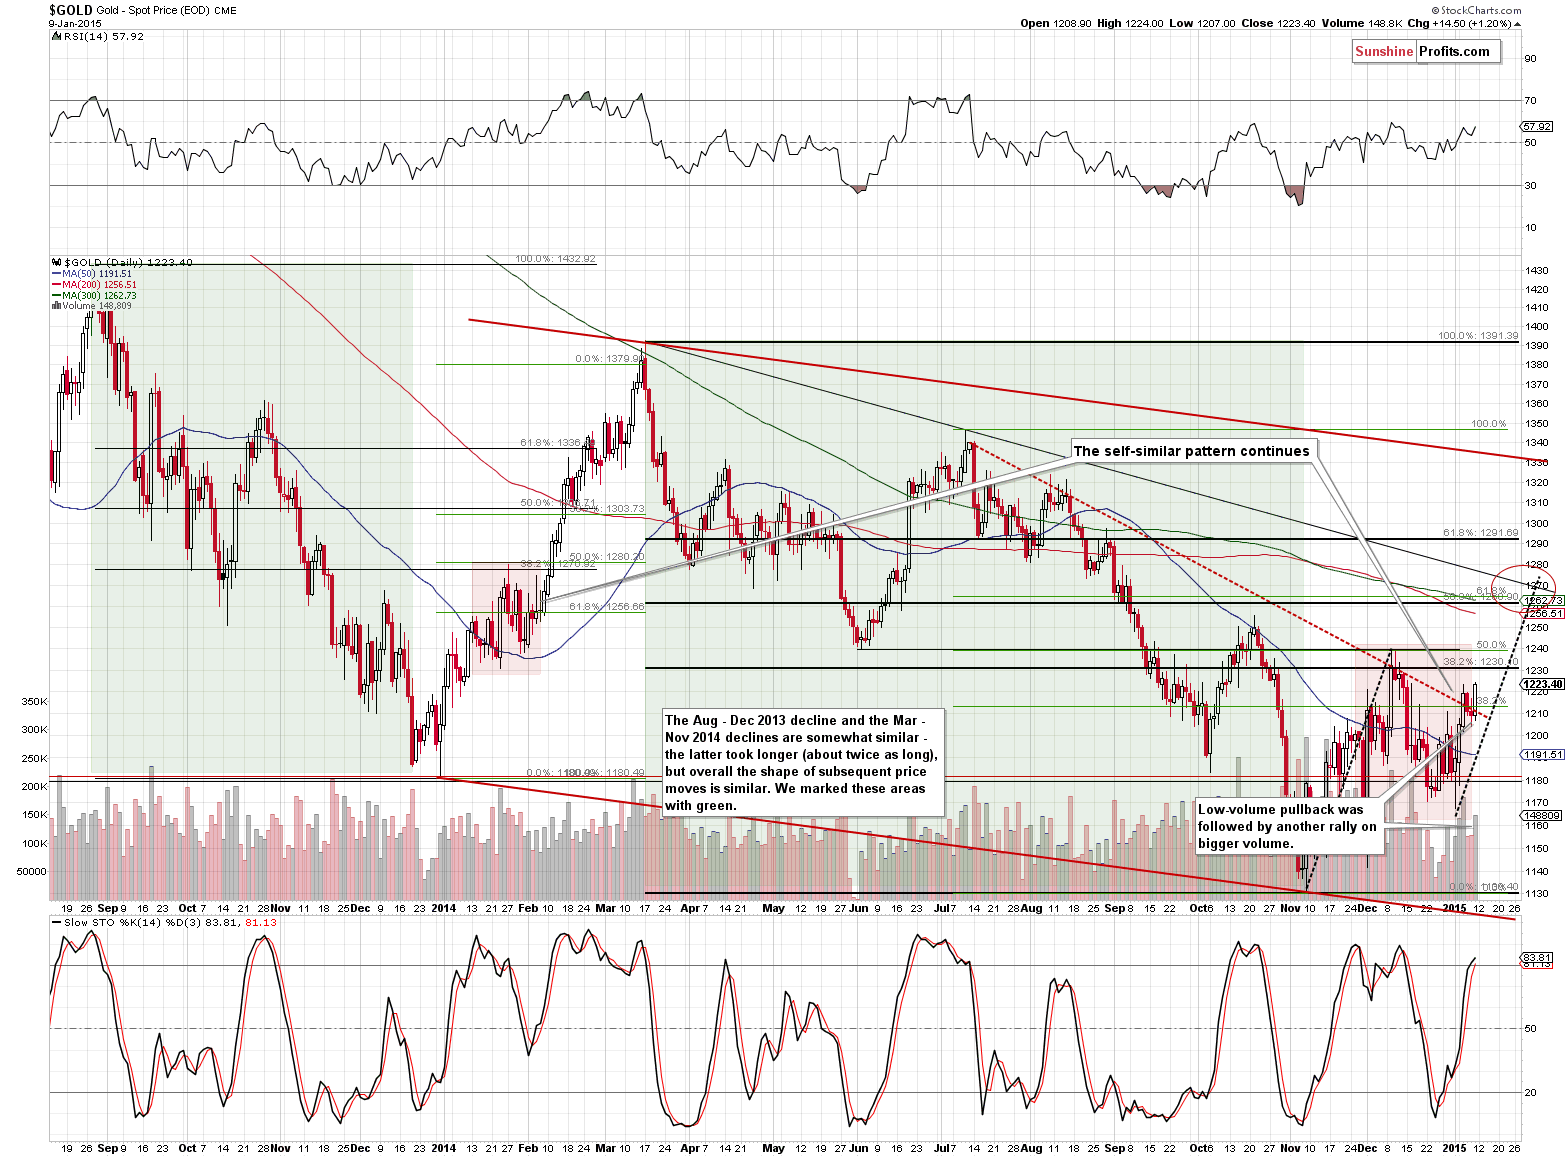
(…) In a way (…) gold looks like it’s about to rally as what happened in the areas marked with red rectangles is similar and both red areas follow green areas that are also similar. The more recent decline (green area) took more time than the previous one, so it’s no wonder that the post-decline consolidation took more time as well. Please note that in both cases we saw gold declining initially around the 50-day moving average, then rallying some more (above the previous high) and then a decline that didn’t take gold below the first local low. In Feb 2014, gold rallied shortly thereafter. Consequently, the implications are bullish.
How high could gold go? Probably at least to the previous local top, close to the $1,250 level, which is also where the declining medium-term resistance line is.
On the above chart we marked another – more probable – target price. The red ellipse points to targets around the [$1,260 - 1,280] range.
Still, that’s just our initial target. Much will depend on the way gold reacts to the dollar’s decline and the way gold stocks react to gold’s performance – we will be monitoring the situation.
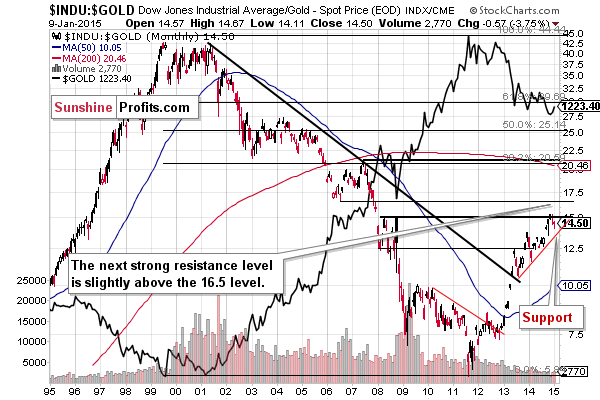
Based on the Dow to gold ratio, the decline in the ratio and the rally in gold are not over either. The general stock market might have formed another local bottom, so this ratio could move higher if gold does nothing. This means that perhaps gold has even greater room for appreciation than it seems based on the above chart. If stocks rally at the same pace as gold, then the Dow to gold ratio will not move. Either way, it seems that gold could rally further.
All in all, we can summarize the situation in the same way as we did previously:
Summing up, gold’s and mining stocks’ strength (another day proving it) combined with the likelihood of a relatively big corrective downswing in the USD Index made the situation more bullish not only from the short-term perspective, but also from the medium-term one. The trends in gold, silver and mining stocks remain down, so we are likely to see even lower values of precious metals and mining stocks. However, the odds that this will not be the case have increased. Does the risk/reward ratio still favor staying completely out of the precious metals market with the long-term investment capital? While it’s tempting to aim for buying back exactly at the bottom or extremely close to it, the prudent answer to this questions is “no”. The odds that this rally will become something bigger than just a corrective upswing are too high at this time (we subjectively guesstimate these odds at about 40%). Not everything is in place, but enough happened (or is about to happen, like the likely top in the USD Index) to [be] in with half of the long-term investment capital.
Meanwhile, the trading positions are already profitable. It seems that they will become much more profitable before the trade is over. As always – we’ll keep you – our subscribers - informed.
To summarize:
Trading capital (our opinion):
It seems that having speculative (full) long positions in gold, silver and mining stocks is a good idea:
- Gold: initial target level: $1,277; stop-loss: $1,179, initial target level for the UGLD ETN: $ 14.00; stop loss for the UGLD ETN $11.10
- Silver: initial target level: $17.46 ; stop-loss: $15.44, initial target level for the USLV ETN: $25.69 ; stop loss for USLV ETN $17.91
- Mining stocks (price levels for the GDX ETN): initial target level: $21.46 ; stop-loss: $18.38 , initial target level for the NUGT ETN: $17.14 ; stop loss for the NUGT ETN $10.93
In case one wants to bet on lower junior mining stocks' prices, here are the stop-loss details and initial target prices:
- GDXJ: initial target level: $28.96 ; stop-loss: $23.87
- JNUG: initial target level: $42.46 ; stop-loss: $23.84
Long-term capital (our opinion): Half positions in gold, half positions in silver, half position in platinum and half position in mining stocks.
We continue to favor senior mining stocks over junior mining stocks, but this will likely change relatively soon as the SP Junior Long Term Indicator is already below the lower of the signal lines and as soon as it turns back up, we will see a “move from seniors to juniors” signal. As far as senior gold stocks and silver stocks selection is concerned for speculative and long-term investment purposes, we continue to view our tools: Golden StockPicker and Silver StockPicker as the optimal way of choosing them.
Insurance capital (our opinion): Full position
Please note that a full position doesn’t mean using all of the capital for a given trade. You will find details on our thoughts on gold portfolio structuring in the Key Insights section on our website.
As a reminder – “initial target price” means exactly that – an “initial” one, it’s not a price level at which we suggest closing positions. If this becomes the case (like it did in the previous trade) we will refer to these levels as levels of exit orders (exactly as we’ve done previously). Stop-loss levels, however, are naturally not “initial”, but something that, in our opinion, might be entered as an order.
Since it is impossible to synchronize target prices and stop-loss levels for all the ETFs and ETNs with the main markets that we provide these levels for (gold, silver and mining stocks – the GDX ETF), the stop-loss levels and target prices for other ETNs and ETF (among other: UGLD, DGLD, USLV, DSLV, NUGT, DUST, JNUG, JDST) are provided as supplementary, and not as “final”. This means that if a stop-loss or a target level is reached for any of the “additional instruments” (DGLD for instance), but not for the “main instrument” (gold in this case), we will view positions in both gold and DGLD as still open and the stop-loss for DGLD would have to be moved lower. On the other hand, if gold moves to a stop-loss level but DGLD doesn’t, then we will view both positions (in gold and DGLD) as closed. In other words, since it’s not possible to be 100% certain that each related instrument moves to a given level when the underlying instrument does, we can’t provide levels that would be binding. The levels that we do provide are our best estimate of the levels that will correspond to the levels in the underlying assets, but it will be the underlying assets that one will need to focus on regarding the sings pointing to closing a given position or keeping it open. We might adjust the levels in the “additional instruments” without adjusting the levels in the “main instruments”, which will simply mean that we have improved our estimation of these levels, not that we changed our outlook on the markets. We are already working on a tool that would update these levels on a daily basis for the most popular ETFs, ETNs and individual mining stocks.
Our preferred ways to invest in and to trade gold along with the reasoning can be found in the how to buy gold section. Additionally, our preferred ETFs and ETNs can be found in our Gold & Silver ETF Ranking.
As always, we'll keep you - our subscribers - updated should our views on the market change. We will continue to send out Gold & Silver Trading Alerts on each trading day and we will send additional Alerts whenever appropriate.
The trading position presented above is the netted version of positions based on subjective signals (opinion) from your Editor, and the automated tools (SP Indicators and the upcoming self-similarity-based tool).
As a reminder, Gold & Silver Trading Alerts are posted before or on each trading day (we usually post them before the opening bell, but we don't promise doing that each day). If there's anything urgent, we will send you an additional small alert before posting the main one.
=====
Latest Free Trading Alerts:
Yesterday, Bitcoin ended lower than it had opened, erasing Wednesday’s gains but the overall volume was lower than on Wednesday. It was a day of depreciation but not a decisive fall. It seems now that Bitcoin is in tense territory as it might move decisively in the next couple of days. In which direction? Read this alert to learn our opinion.
Bitcoin Trading Alert: Bitcoin in Tense Territory
=====
Hand-picked precious-metals-related links:
Goldcorp up 5% as investors dive back into gold stocks
Enormous Bullish Gold Bet was just made with Call Options
Gold Speculators bullish positions rise for 2ndd week to highest level since August
India no longer worried about gold imports
=====
In other news:
Yellen Proves Master of Math Forecasting U.S. Economy
ECB plans QE according to paid in capital: Source
Paulson Event-Driven Fund Said to End Last Year Down 36%
U.S. Retakes the Helm of the Global Economy
=====
Thank you.
Sincerely,
Przemyslaw Radomski, CFA
Founder, Editor-in-chief
Gold & Silver Trading Alerts
Forex Trading Alerts
Oil Investment Updates
Oil Trading Alerts

