
It seems that collective memory is becoming shorter and shorter. We just celebrated two important holidays in the Judeo-Christian traditions that commemorate events that took place thousands of years ago. Yet, now, in the age of Internet, people seem to forget major events after weeks, or even days. Given this weeks’ performance in the precious metals, people have forgotten that only two weeks ago Cyprus was on the brink of unraveling not only the European union, but the sacrosanct foundations of fractional banking, with the crisis highlighting the fundamental fault lines of both.
On Wednesday silver for immediate delivery slid as much as 1.3 percent to $26.9175 an ounce, the lowest since July 25. Gold is now trading below the pre-Cyprus crisis level and is challenging the two-month low. Wednesday we sent you three Market Alerts to keep you up to speed with changing conditions.
There is a difference between a bear market and a correction, which is a short-term trend with a shelf life of less than two months. In a bear market, widespread pessimism becomes self-sustaining. Many consider a downturn of 20% or more over at least a two-month period to be an entry into a bear territory. We disagree with this definition in case of precious metals. The secular bull market remains in place as long as fundamentals remain in place – and that is clearly the case with silver.
According a Credit Suisse Group AG report Wednesday, global government stimulus has cut the likelihood of further banking and liquidity crises and reduced the need for a protection of wealth. The bank cut its 2013 gold forecast by 9.2 percent to $1,580 and lowered its silver estimate by 11 percent to $28.50.
We can only guess that the folks at Credit Suisse have forgotten as well. It was only last Thursday that Cyprus cautiously opened the doors of its banks but tightly rationed withdrawals. People could only withdraw 300 euros of their own money, couldn't freely cash checks or use their bank to pay suppliers who use other banks. In a few short weeks Cyprus lost its status as an off shore banking center with a banking sector 7 times larger than the annual GDP.
“In Cyprus they will go back to growing tomatoes and raising sheep,” said an acquaintance whose Eastern European building firm channels its banking operations through Cyprus.
The restrictions are meant to keep Cypriots from emptying their accounts in the wake of the bailout deal announced last Monday that would drastically prune Cyprus’s oversized banking sector, bloated by deposits from Russia and other former Soviet Union countries. Although the deal scrapped the highly controversial idea of a tax on bank deposits, it would still require forced losses for depositors and bondholders, with the amount to be yet determined. The ink has not even dried on the Cyprus story. We have gotten the message loud and clear that gold and silver are the ultimate monetary assets. Now we need to wait for everyone else to get it without losing our shirts in the process.
There are several important lessons to be learned here. There is a presumption that bank customers are exempt from risk. They may get interest (not much nowadays) but if the bank uses their money badly and loses, the depositor is insured in most western countries on deposits of less than $100,000 dollars or euros. This is not how markets usually work, much to our collective pain. When we invest in something hoping to gain, we know that there is risk involved. This is the way things usually work. To shore up the idea that banks are a safe place for your money, governments have undertaken wealth transfers in the form of direct subsidies and bailouts financed by the taxpayer and resulting in inflation. Peter Schiff wrote recently and we agree:
The inflation tax accomplishes the same goal - reduces the real value of bank deposits and other assets values to accord with the actual capital base of the economy. But it is done in a backhanded way that allows myths to persist about the "safety" of the banking system and the "wisdom" of government management of the economy.
In fact, the inflation tax hurts savers twice: once by the lost interest from suppressed rates and again by the sapping of purchasing power. While the former only hurts depositors, the latter harms everyone holding and using the national currency, not just depositors.
Cypriots, Europeans, and investors the world over are, for the first time in generations, getting the message that risk is real. Banks are not endless fountains of profit set on unshakeable concrete foundations. In fact, fiat fractional-reserve banking is an inherently unstable system.
We have gotten the message loud and clear so let’s turn to the technical portion and start with the very long-term US Dollar Index chart (charts courtesy by http://stockcharts.com.)
USD and Euro Indices
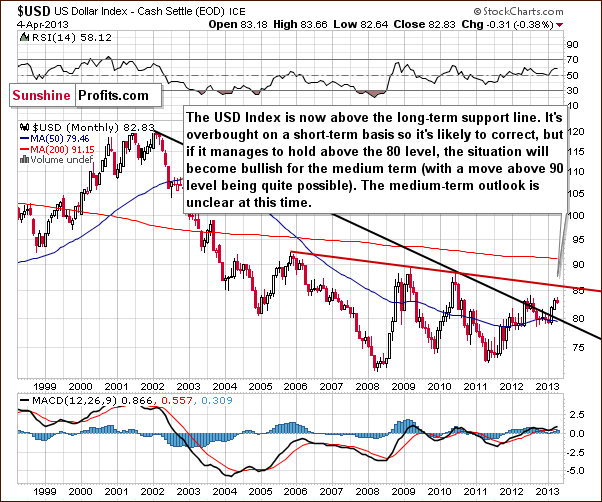
We begin this week with the very long-term USD Index chart and our first question is what happened this week? Well, it’s not seen here because the index has been trading at about the same level and pretty much sideways for some time now. On the above chart you can see it as a pause. Comments made in our last Premium Update remain up-to-date:
The breakout here is now quite significant, and we must consider the possibility that the USD Index might move higher in the medium term. The situation in the short term, however, is overbought, so it is likely that we will see the index decline soon and then we’ll see what happens next.
If the correction stops at the declining support line, around the 80 level, then the breakout will be confirmed, and a rally will likely follow. If however, the correction takes the index below the 80 level, the whole breakout will be invalided, and lower values would probably follow. At this time, the medium term and long-term outlooks are somewhat unclear based on this chart alone.
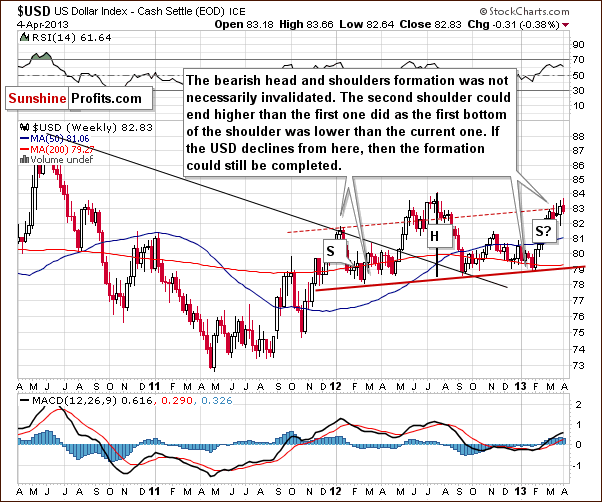
In the medium-term USD Index chart, the implications are the same as they have been. Little has changed over the past two weeks, and comments made in our last Premium Update remain current:
...the important thing to discuss here is the head-and-shoulders formation. This trading pattern has bearish implications for the USD Index and the question now is whether the formation is still present given the recent rally. We feel the answer is “yes”, because even though the index is now higher than the level of the left shoulder, the full formation is simply a bit skewed.
Local bottoms have been a bit higher each time so it is perhaps quite natural for the second shoulder to be above the first shoulder. Consequently, the formation could still be completed - though not yet - the other should has yet to form. Declines in the index are needed for this to happen, and we feel this could still be seen.
The head-and-shoulders pattern has not yet been invalidated so completion of this trading pattern is still possible.
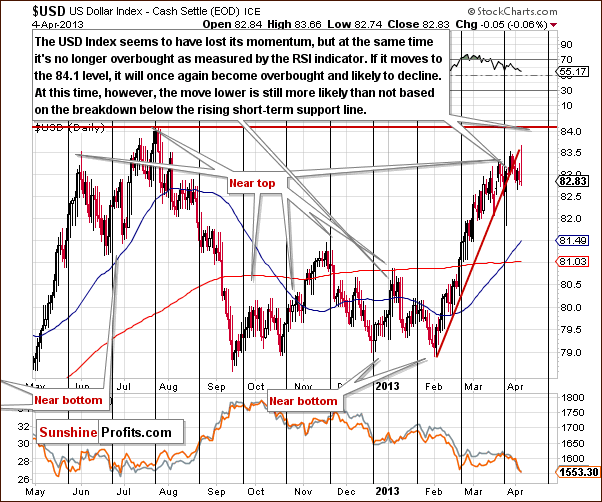
In the short-term USD Index chart, we see a breakdown below the rising short-term support line. This chart is a bit bearish, at least more bearish than it has been in previous weeks. The RSI level is no longer overbought and the decline is not visible yet, but the breakdown was confirmed.
Although we cannot rule out a move to the July 2012 high before the next decline, an immediate decline appears possible now. Such a move could finally trigger a rally in the precious metals. This is no sure bet, however. Recent moves to the downside in precious metals prices while the USD Index was also declining were not very encouraging.
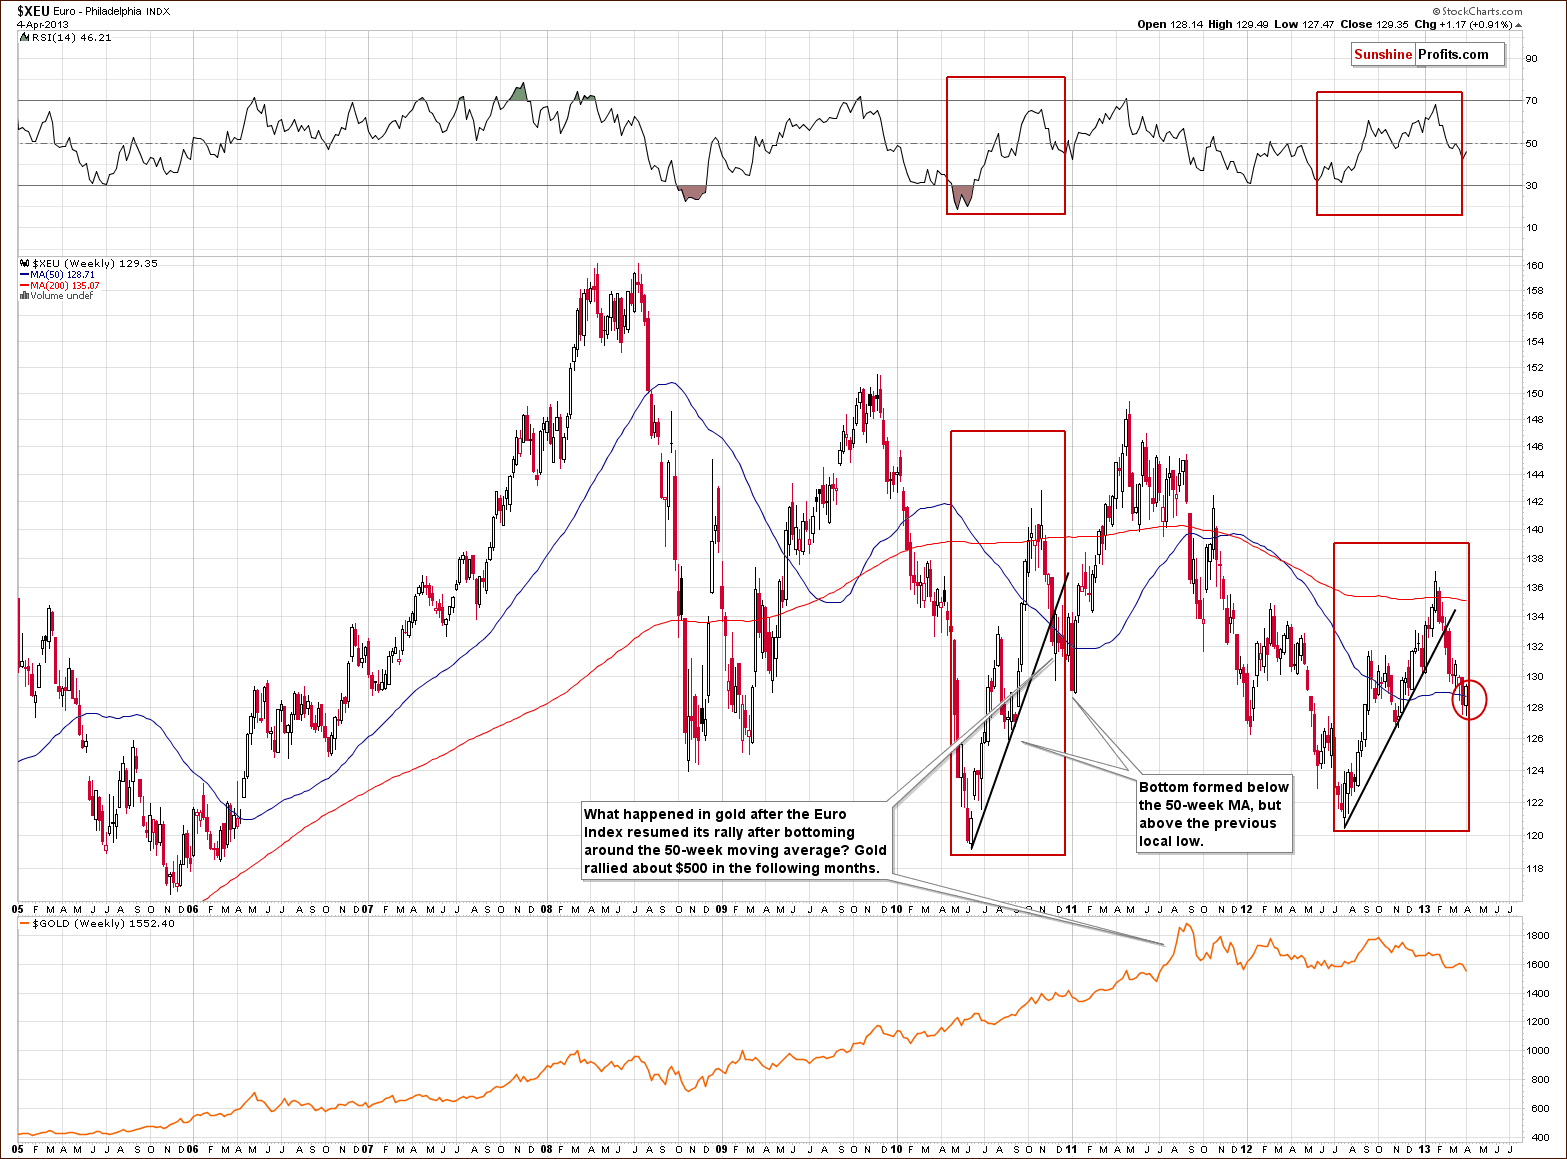
In the long-term Euro Index chart, the index level is right at our expected bottom now. It moved to the lower bottom of the target area and then reversed. This target area is based on the 50-week moving average and the previous low.
We have illustrated an analogy between current trading patterns and those seen in 2010 with red rectangles in this week’s chart. Back then the bottom formed at about the point where we are today in the current trading pattern: between the 50-week moving average and the previous local low. A bottom forming now would make the situation more bearish for the dollar. It seems that the Cyprus events have caused the euro to decline recently and now – as the situation gets less and less coverage – euro moves back up.
Summing up, the USD Index quite likely to decline shortly even though the very short-term implications are not as clear as we would like them to be. Early week declines in the USD Index did not cause precious metals prices to rise, they actually declined as well, so the implications are not clear at this time.
General Stock Market
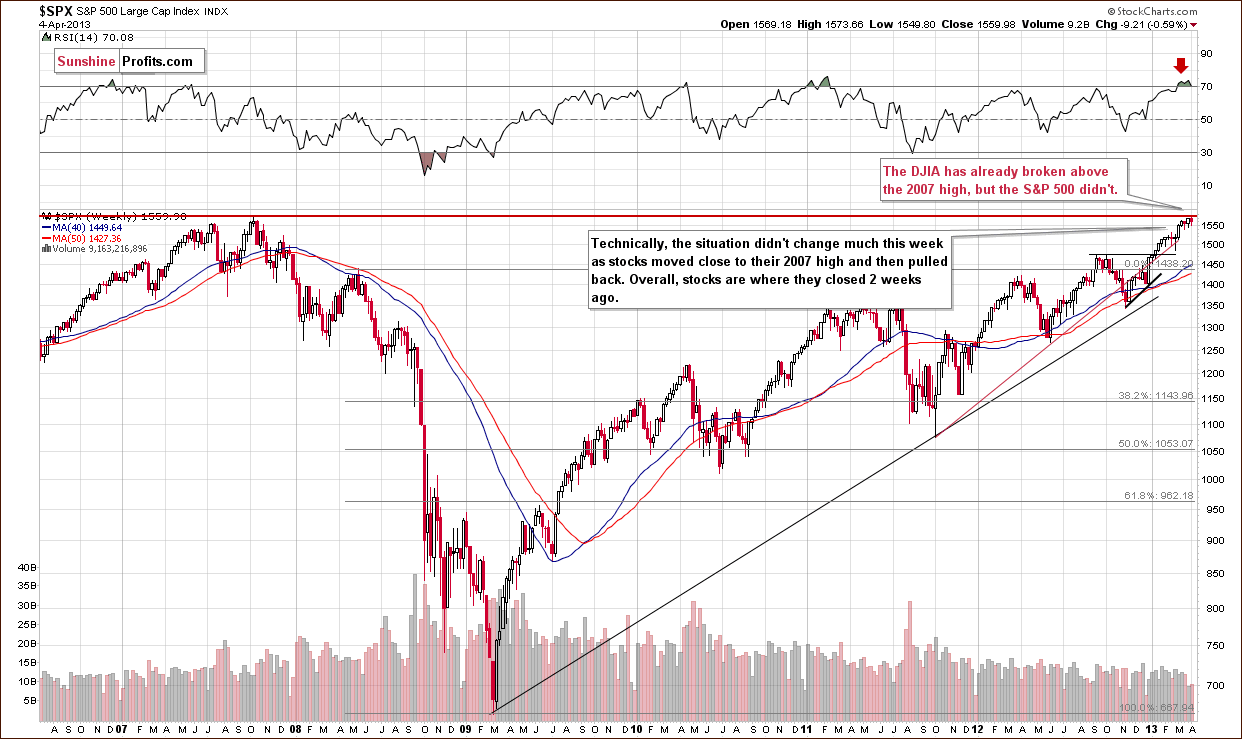
In the long-term S&P 500 Index chart, we see that there has been no breakout although stocks did move higher early in the week. Overall, the situation has not changed so much in the past two weeks as stocks are still overbought and the RSI level remains above 70. It seems that another breakout attempt is quite possible so the very-short-term trend remains up.
What happens after stocks move to their 2007 high is unclear, but it’s very likely that the reaction – whatever it will be – will be important. If stocks breakout and then invalidated it and at the same time precious metals move to/below their key support levels and then invalidate such breakdown, we will have a very bullish and very important signal for the precious metals market.
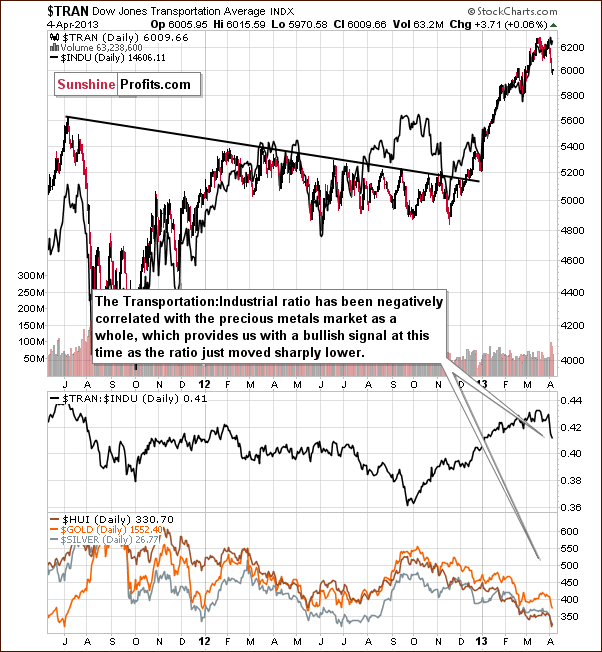
Turning now to the transportation-industrial stocks ratio, we see an important development this week as the transportation stocks declined. This resulted in a significant decline in the ratio and the ratio has been inversely correlated with the precious metals for some time now. This relationship has been quite strong week-to-week, especially since last August. It seems that at this time, it could have positive implications on the precious metals market. So, in short a lot has happened, but not much has changed yet.
Summing up, we have seen a positive clue in the declining transportation-industrial stocks ratio, which could have a positive impact on the precious metals. Overall, the implications are unclear to a bit bullish for the very short term. Once the S&P moves above its 2007 high or fails to do so and declines significantly, we will have a clearer picture here.
Gold and Silver Correlations
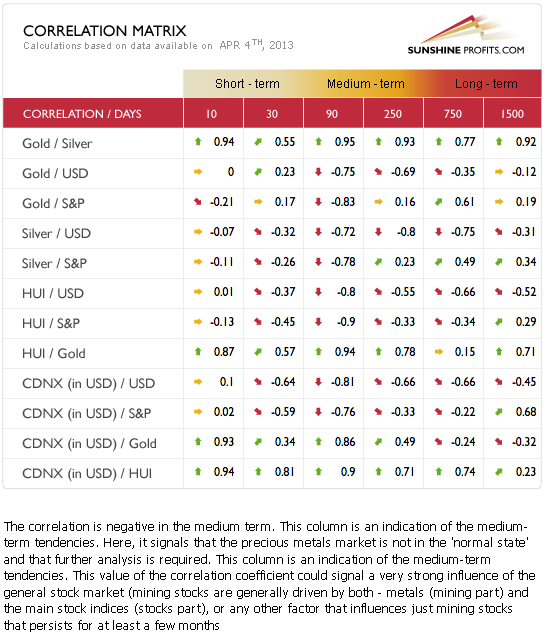
The Correlation Matrix is a tool which we have developed to analyze the impact of the currency markets and the general stock market upon the precious metals sector, (namely: gold and silver correlations). The link between the precious metals market and other markets (stocks, currencies) has weakened significantly this week. Gold’s prices have also declined significantly in terms of the euro and this happened when stocks declined as well. At this time, we need to see the correlations behave regularly for some time (with similar impact on the market for a few weeks) before we can start inferring short-term price moves in precious metals based on short-term moves in stocks or the USD Index.
The medium-term correlations are negative, so if stocks or the USD Index decline significantly (!), the metals are likely to rally.
Gold
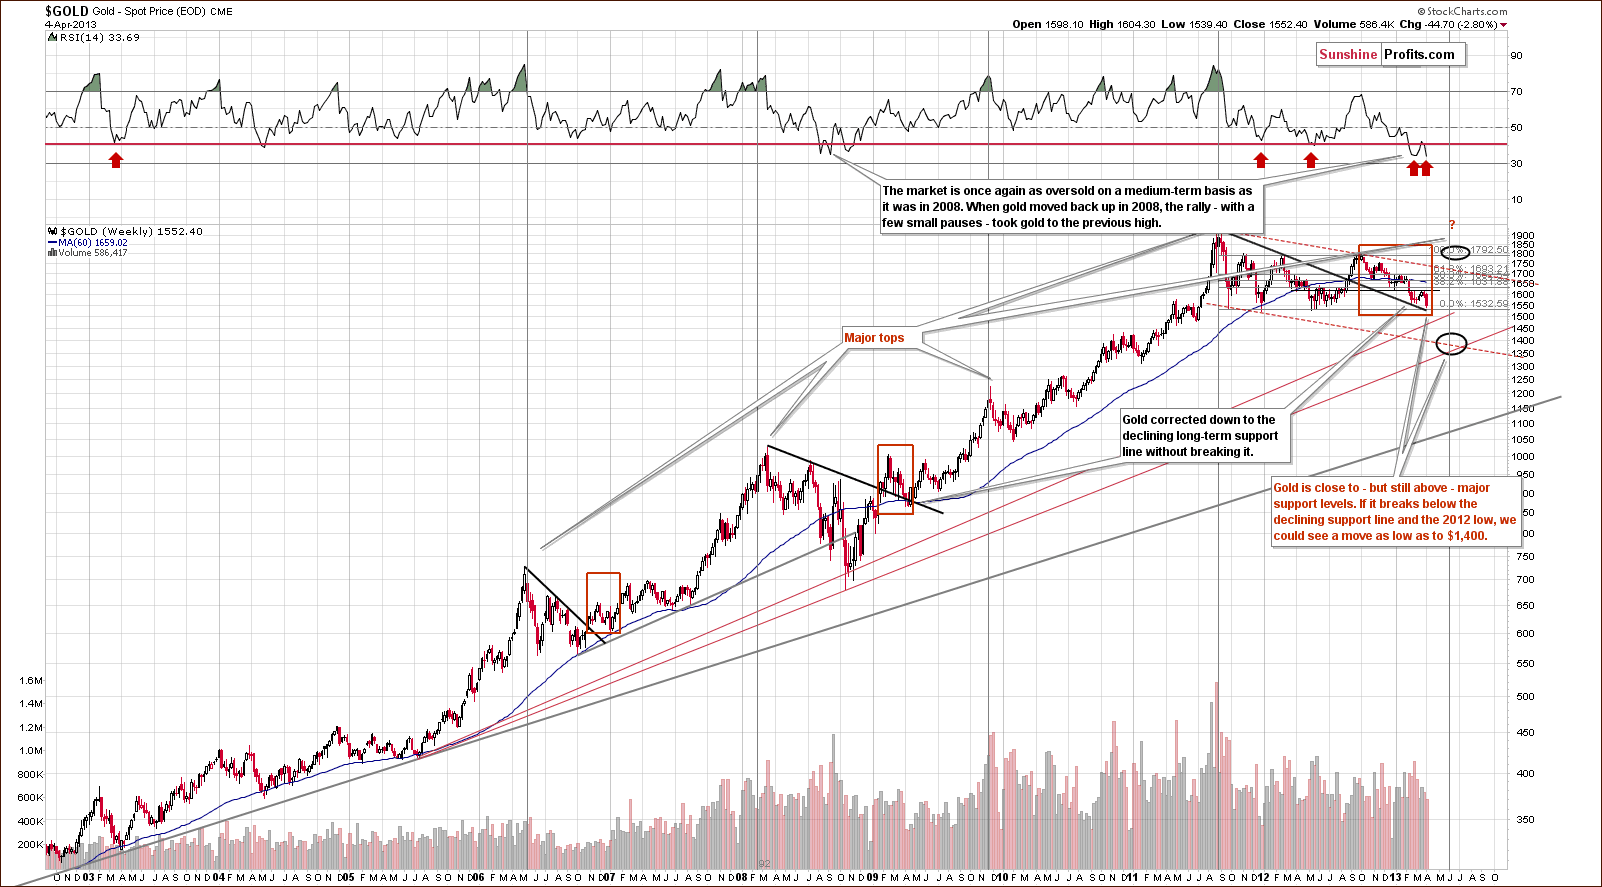
In this week’s very long-term gold chart, we saw a significant price decline this week.
Even though the situation is still bullish, as gold is above its long-term support lines, it seems that it could be the case that the next long-term turning point in gold may be a major bottom as opposed to a top. If gold prices break below the declining support line and the 2012 low, the next significant support is about $100 lower.
At the same time, although prepared and looking to the downside target level, it does not mean that the situation is bearish for the medium term. RSI levels are still oversold, so gold may not decline significantly.
As we discussed in Thursday’s Market Alert:
Gold could actually decline to $1,350 or $1,100 and still remain in a secular bull market(in mid-70's this gold retraced almost 50% of its earlier high). Don't panic - this is not a likely outcome. The consolidation is already almost 2-years long (2-years long in case of silver), investors are already very discouraged and the fundamental situation (QEs among other things) is in our opinion more favorable than it was in the 70s.
We do not recommend closing long-term positions at this point.
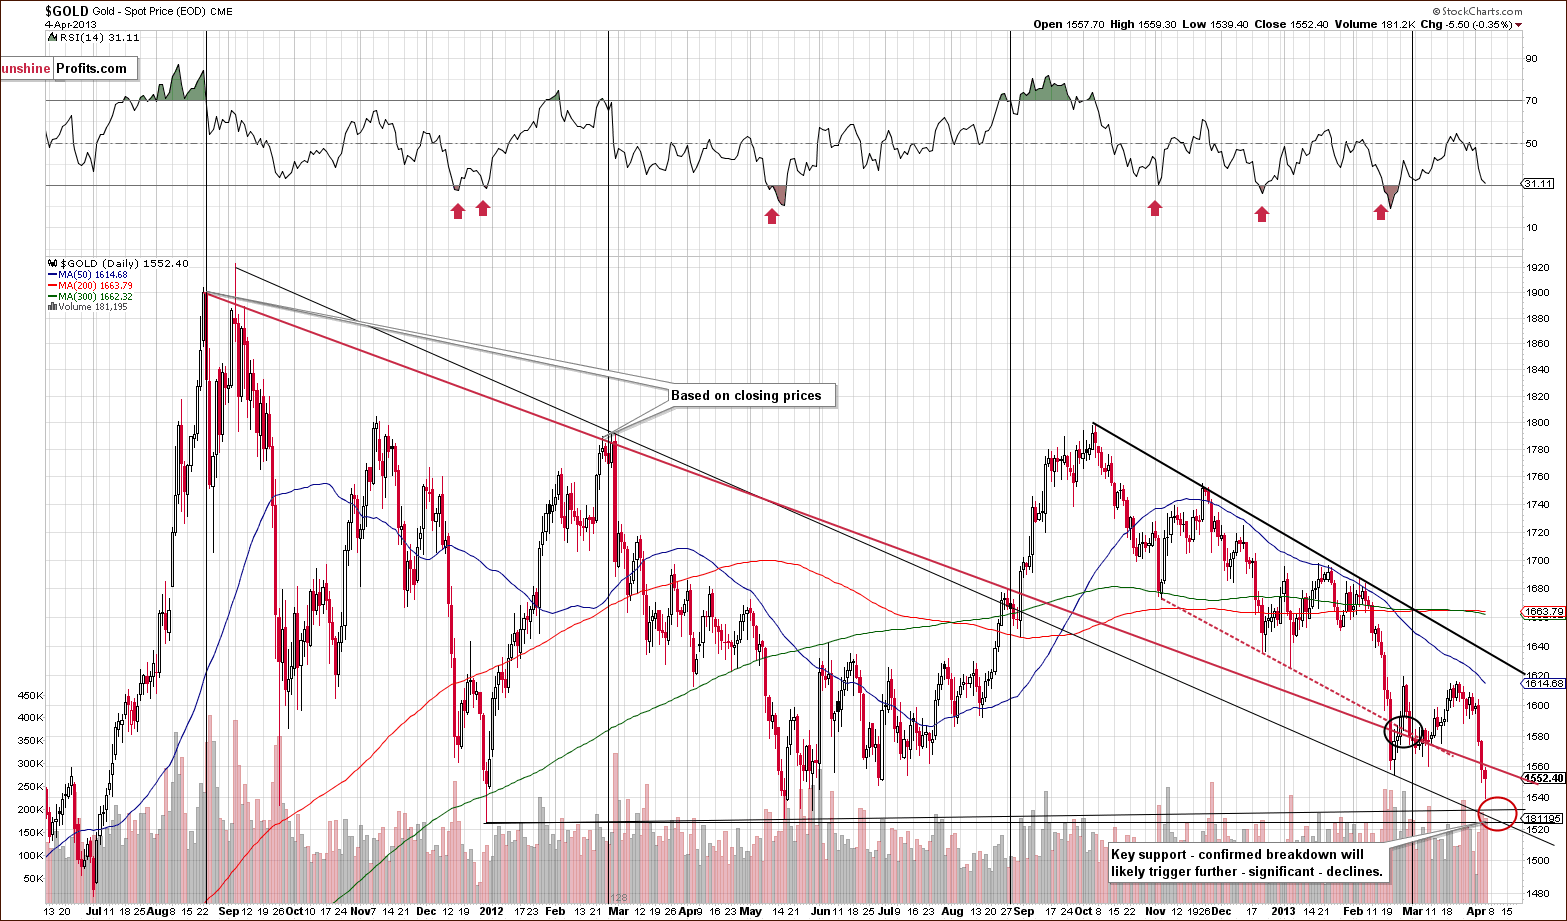
In the medium-term gold chart, we saw a reversal during the day on Thursday, but overall gold’s price still dropped $5.50. Gold’s price is still visibly above a key support line and as long as it stays above the red ellipse in our chart, the medium and long-term situations will remain bullish.
A confirmed breakdown is needed before any action would be suggested here. This means that we would need to see three consecutive closes below $1,520 or an intra-day move below $1,496. For now, the situation remains bullish, though it may not appear so at first glance.
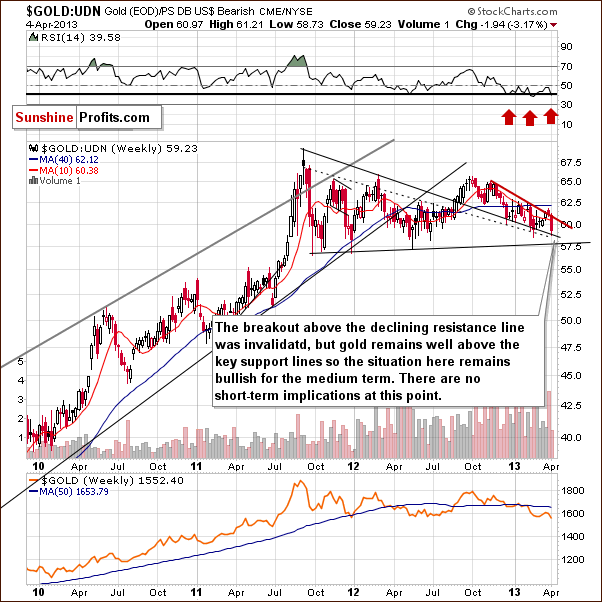
In this week’s chart of gold from the non-USD perspective, we see mixed short-term signals this week. The breakout above the declining resistance line has been invalidated, but the declining support line has held. Even if broken, another is just a bit lower. The situation is mixed for the short term but the medium-term outlook remains positive.
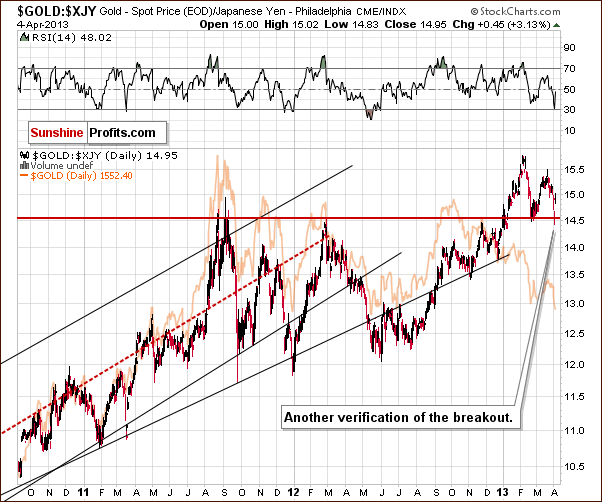
In this week’s chart of gold from the perspective of the Japanese yen, we see there was a sharp decline on Wednesday followed by a quick pullback on Thursday when the Bank of Japan announced a huge round of quantitative easing. This is indeed a very significant move and a very positive long-term factor for gold. Gold reacted immediately and in terms of the yen remains quite bullish.
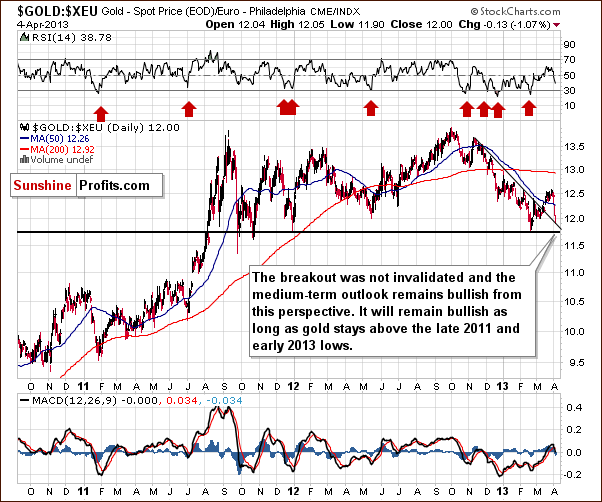
In this week’s chart of gold from the euro perspective, we saw a sharp though unlikely decline this week. Prices did not go beyond support lines however so the situation remains bullish.
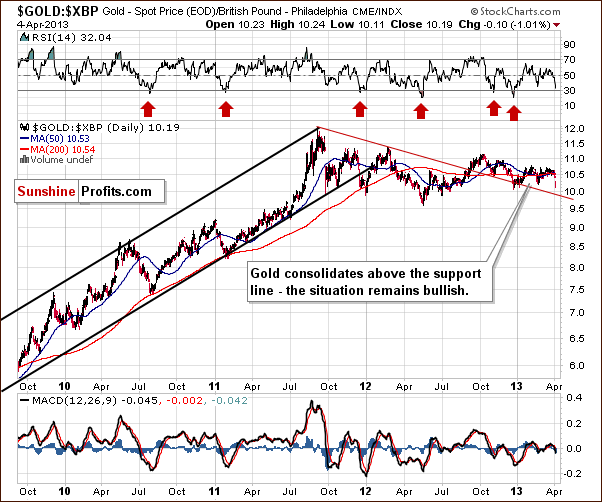
In this week’s chart of gold from the British pound perspective, a strong support line is in place as well, and the situation is also bullish.
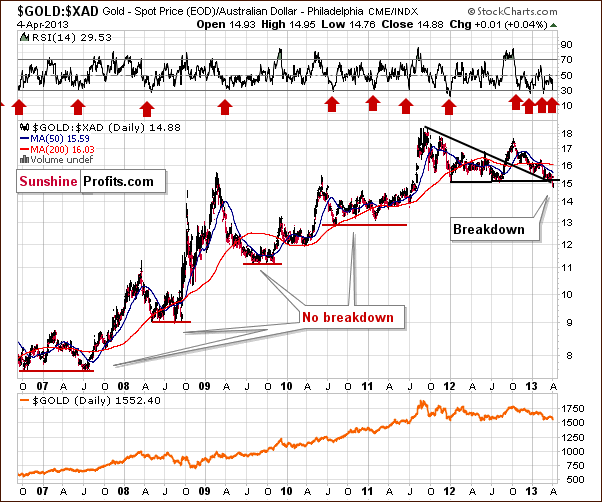
In this week’s chart of gold from the Australian dollar perspective, we have our most concerning chart this week. Periods of consolidation over the past six years have not resulted in gold’s price moving below the previous low until now.
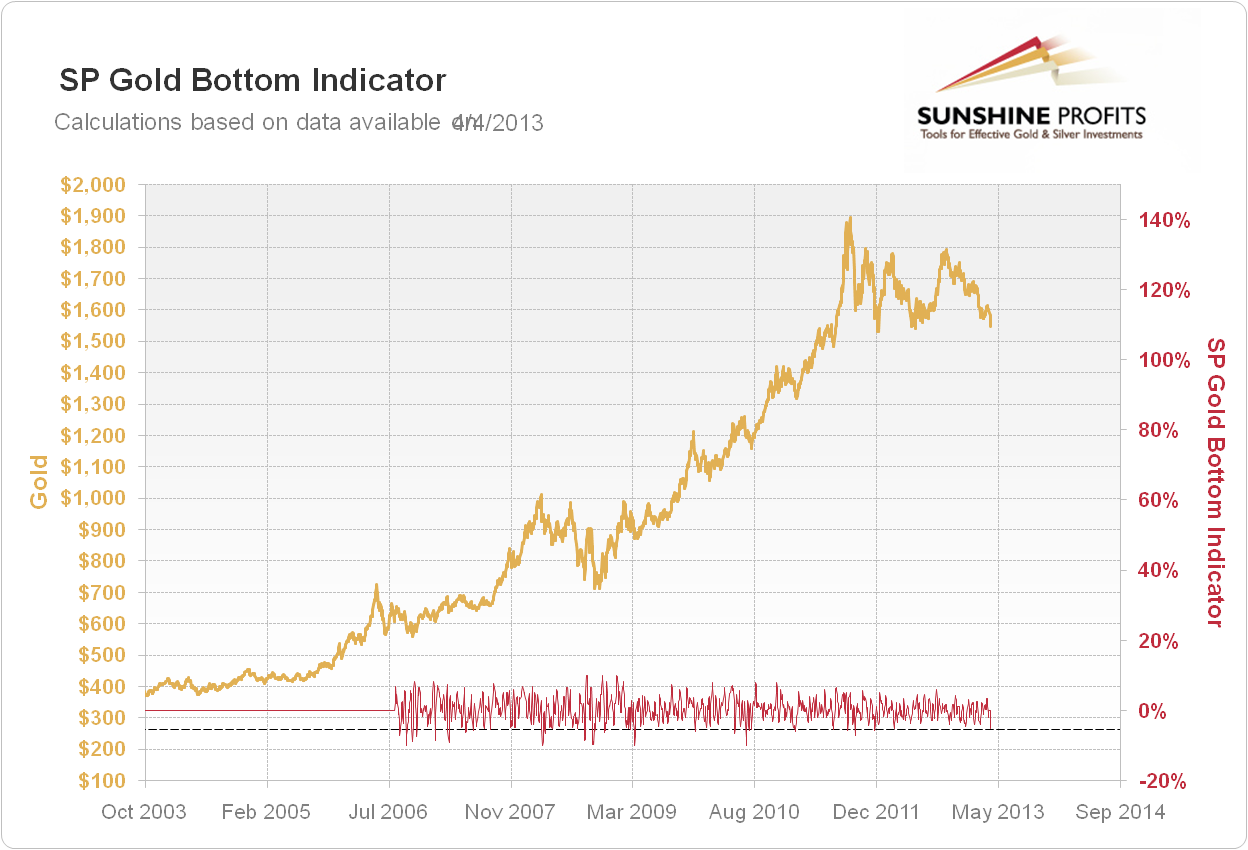
We have just seen a long-term buy signal from the SP Gold Bottom Indicator. Please click on the above chart to expand it and examine how often these signals corresponded to major (!) bottoms in gold – this indicator was very useful in the past years and should not be ignored.
Summing up, if we see a repeat of this week’s price declines, we will likely need to consider hedging long-term positions in gold. So far, no breakdown has been seen except for gold priced in Australian dollars and at the same time we have a breakout in case of gold priced in the Japanese yen. Moreover, we just saw an important long-term buy signal from one of our most reliable indicators. The medium and long-term outlooks remain bullish.
Silver
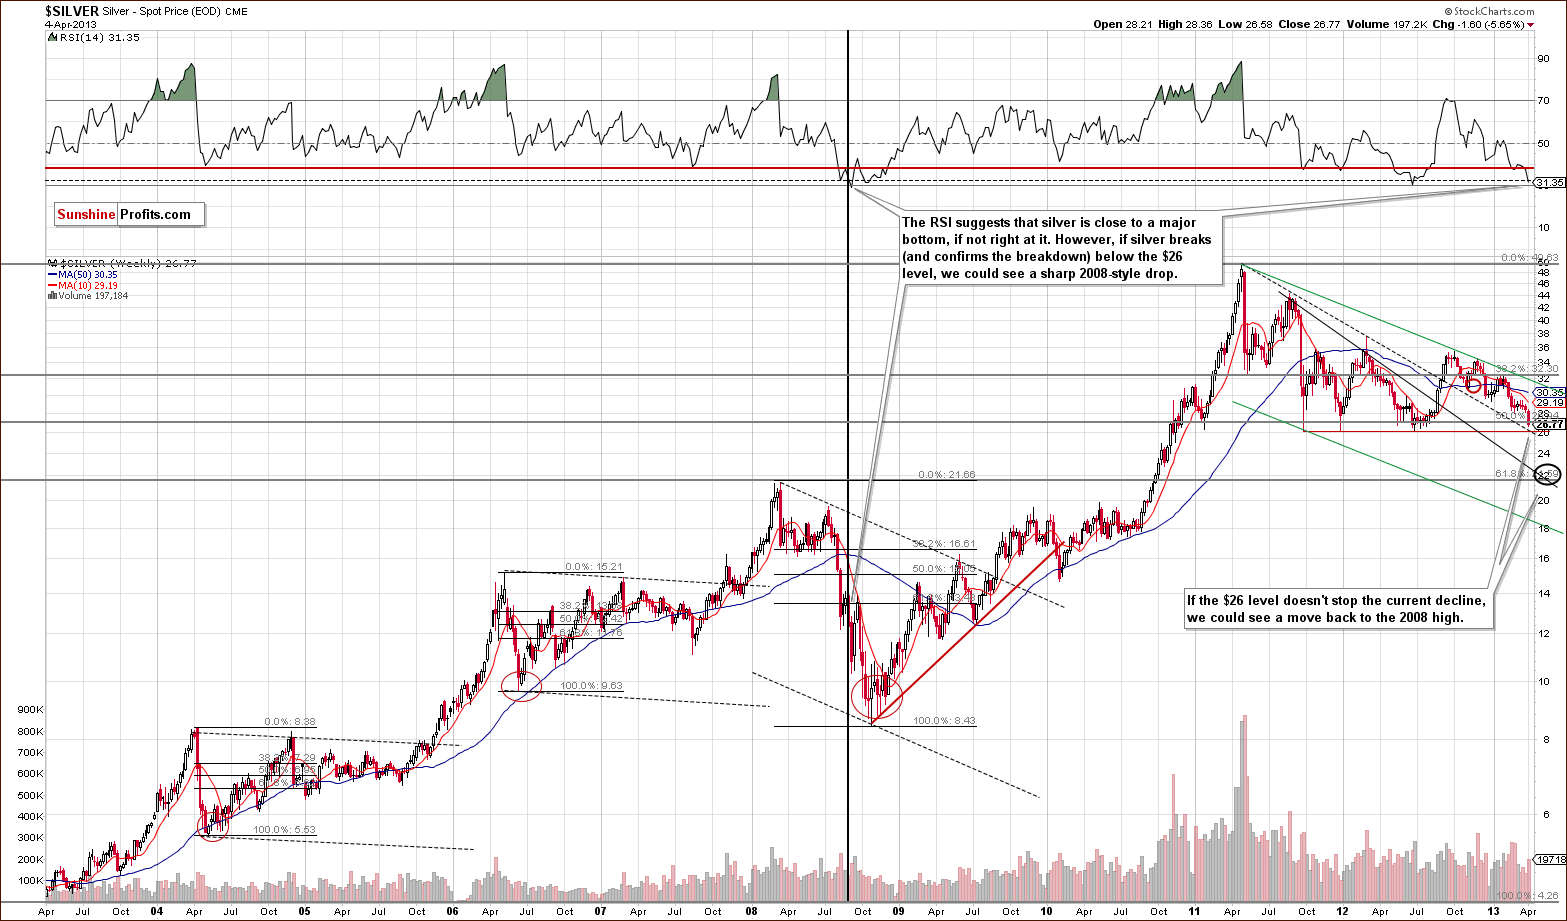
In this week’s very long-term silver chart, we have a situation quite similar to what we described for gold. The lows of the past two years are very close to silver’s current price level. We also have silver just above the declining support line based on previous major tops, much as is the case for gold as well.
On a long-term basis, silver is close to these price levels, but there are several support lines in place. The picture remains bullish here, but there will be concern if prices break down below the support lines.
More declines appear to be possible, and a downside target level around $22 seems appropriate. This is considerably lower, by about $5, almost 20% below silver’s current price. Such a decline is worth avoiding, of course, but, as with gold, there has been no breakdown seen here yet, so the situation remains bullish for the medium term.
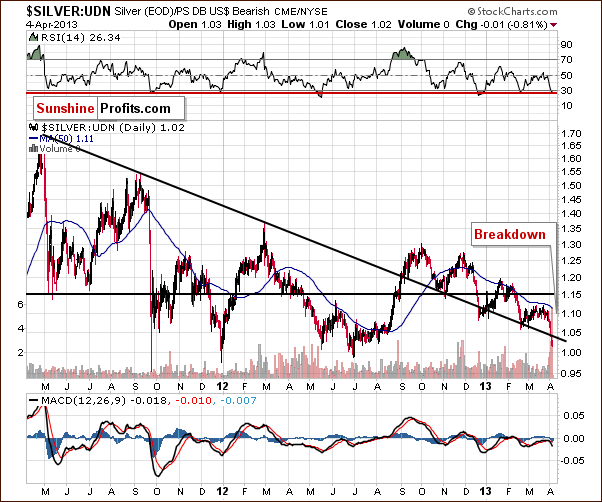
In the medium-term chart of silver from a non-USD perspective, we see a breakdown on huge volume following a much smaller breakdown. This is not a major concern at this time. RSI levels are still below 30 and this level previously coincided with local bottoms. This chart suggests that the local bottom is in and the outlook is therefore bullish even though technically a breakdown has already happened. Such has been the case three times in the past as well (where a breakdown has actually led to a bullish outlook).
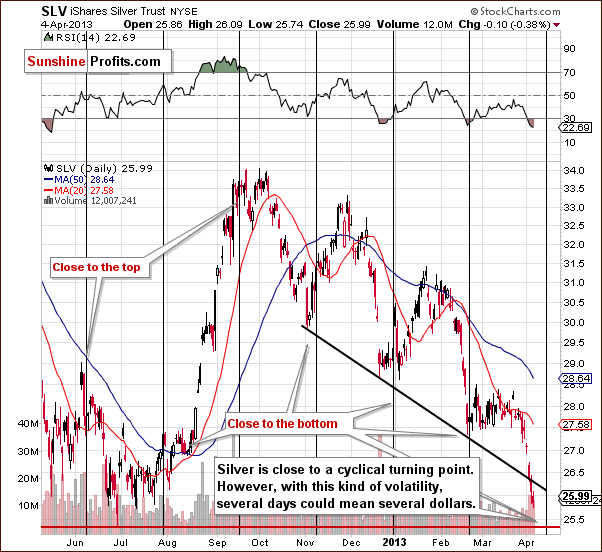
In the short-term SLV ETF chart, we see that a cyclical turning point is close at hand, and a rally or at least a pause in the decline is quite likely soon. With this week’s volatility, however, we do not find much comfort in this statement. Looking at major support lines leads us to feel that silver could bottom above the support line and then rally back up. We would like to see this, as it would provide an excellent entry point for a speculative position (without making changes in the long-term investments). Be prepared, however, for a possible breakdown below the support line; this scenario provides a bearish factor in the chart this week.
Summing up, the situation for silver is very much like that of gold although their charts are not identical. Silver has a combination of two critical support lines: one is the medium-term, declining support line, and the second a support line based on previous lows. Silver is above these levels now, but the potential volatility could bring silver’s price to these levels in a day or so. The situation is critical but remains bullish, as these support levels have not been breached.
Gold and Silver Mining Stocks
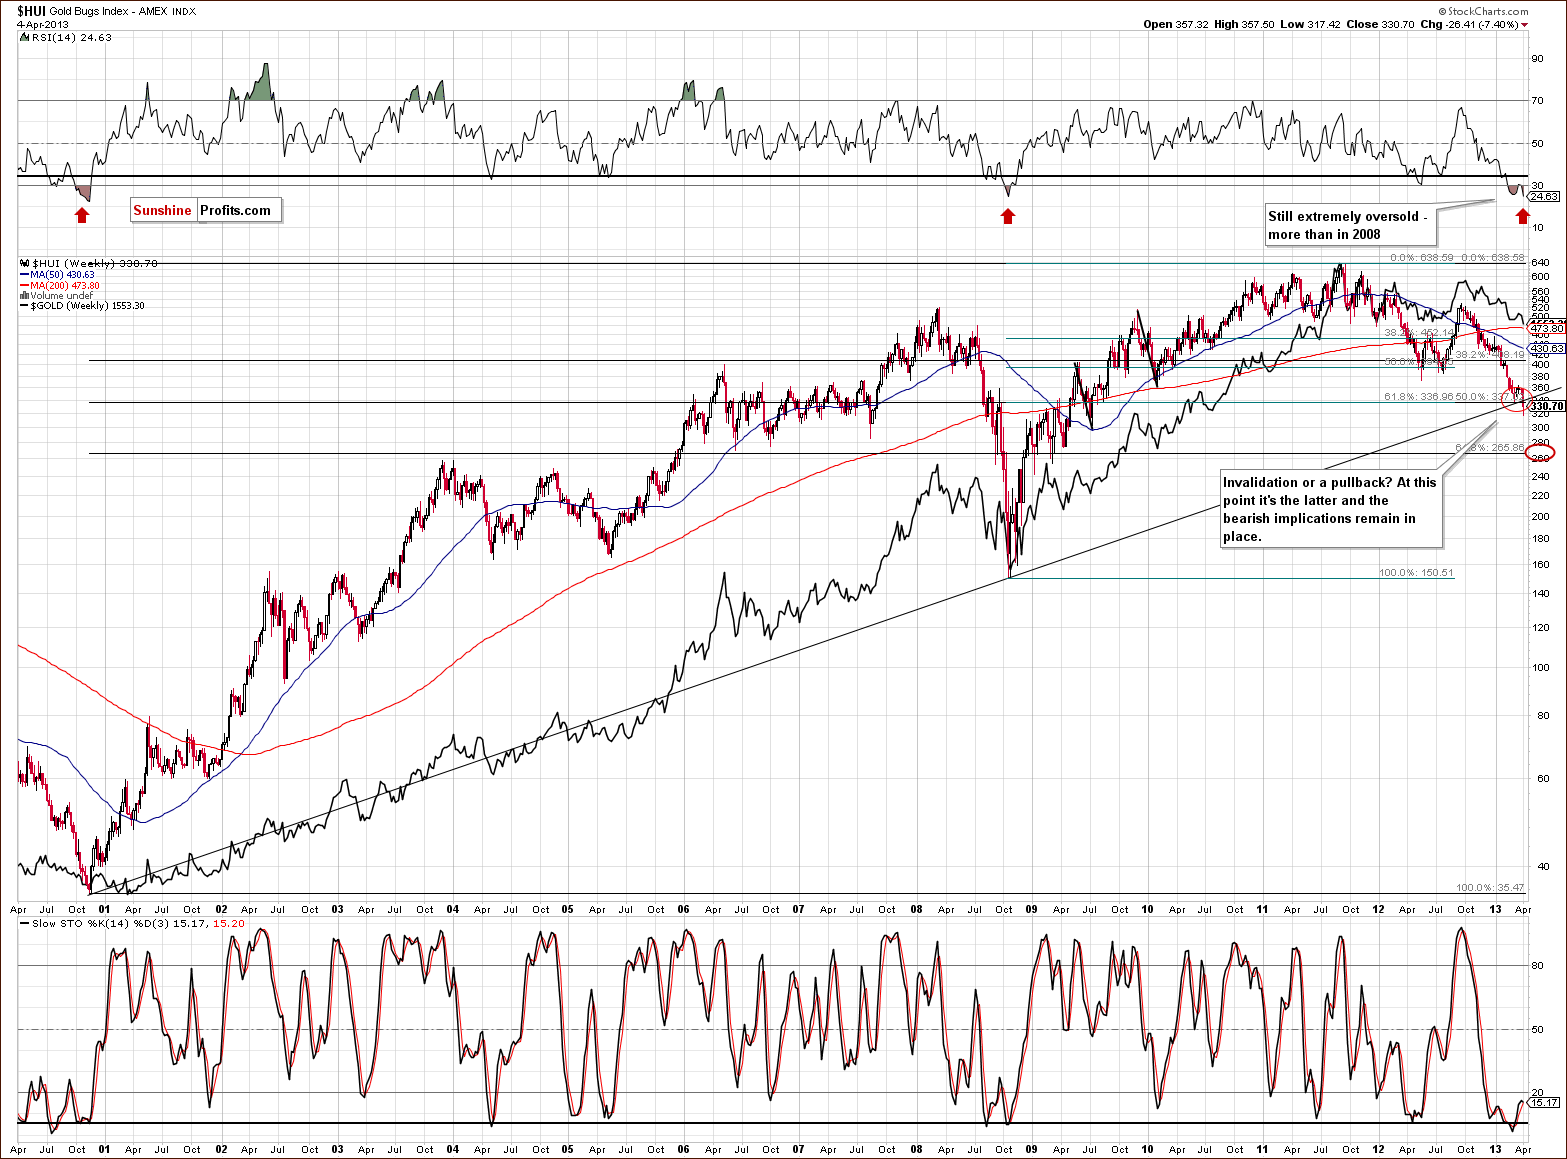
In this week’s very long-term HUI index chart, we see that the situation in gold stocks is currently the biggest threat to a rally in the precious metals sector. The RSI levels are extremely oversold, and the last time this happened was at the very beginning of the bull market. They were actually not as oversold in the 2008 plunge, which is a bullish factor.
More importantly, however, the index has broken below the rising support line and two Fibonacci retracement levels. Both, the 61.8% level based on the 2008 to 2011 rally and the 50% level based on the whole bull market rally have been broken. The HUI Index moved higher on Thursday but did not move back above these levels. This is a quite significant event, because it is visible on the very long-term chart. At this time, the Fibonacci retracement levels suggest 337 as the critical trading level, and this is very close to the previous local bottom.
Friday’s price action will be quite important and if the breakdown is invalidated, it will be a strong buy signal. The breakdown has not yet been invalidated so the situation remains bearish at this time. We realize there has been much back and forth here lately, but at the current market juncture, 10 index points can change the situation dramatically. As always, we will keep you informed.
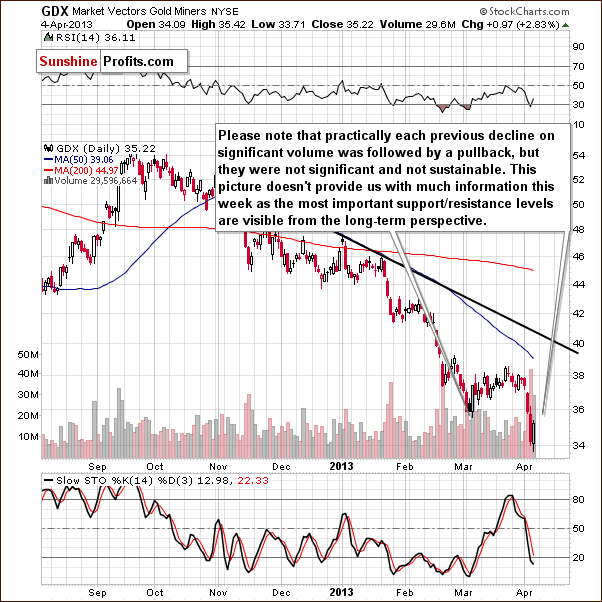
In this week’s short-term GDX ETF chart, we see that Thursday’s pullback has no direct implications as practically all previous declines on significant volume were followed by such and it didn’t result in much higher values in the following weeks. We would need to see more strength to say that the move lower was really invalidated.
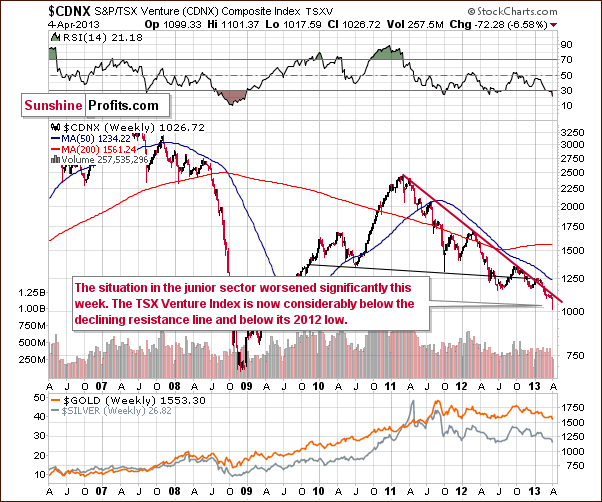
In the Toronto Stock Exchange Venture Index (which is a proxy for the junior miners as so many of them are included in it), significant declines were seen this week. The situation here is negative.
The performance of the juniors is quite concerning for the whole precious metals sector, but at the same time it provides an opportunity. The opportunity to estimate how particular juniors behave during this decline, which will allow us to update our junior rankings. Updating them today would not be as useful as it will be when precious metals do indeed bottom. At that time we will know what to drop and what to hold. Consequently, we will wait with providing the updated junior ranking until that time.
Summing up, the situation in mining stocks is truly critical and could very well determine the next big move in the precious metals sector. If the mining stocks continue to decline, they could drag gold and silver below critical levels and ignite a severe period of decline. If the breakdown is invalidated, however, it could provide a significant buy signal for the sector and indicate that the breakdown risk is relatively low for gold and silver. We will continue to watch this situation closely and report to you as it plays out. The critical level is 337 for the HUI Index.
Letters to the Editor
Most questions that we received recently were either replied to in the Market Alerts or earlier in this update. We just received also one additional question that we will not manage to reply to today as it touches several important points that we would like to elaborate on and at the same time we realize that time is a huge factor given the current market juncture. We don’t want to keep you waiting for this update when we reply to that particular question, so we will provide our reply in one of the next week’s Market Alerts or in the coming Premium Update.
Summary
The USD Index seems ready to move lower as the markets no longer seem to be paying much attention to the situation on Cyprus. We feel that the long-term implications of Cyprus events are positive for gold and will continue to have a positive impact in the coming months.
The medium-term outlook seems at this point to be that declines in the USD Index will likely lead to higher gold prices. If the declines are significant, this will probably hold true though small declines in the dollar have unclear implications at this time.
Overall, the general stock market has done very little in the past two weeks. The S&P 500 moved closer to its 2007 high but didn’t reach it. Another attempt seems quite possible and could trigger another move lower for precious metals prices. As long as gold and silver remain above their critical support levels the situation will remain bullish for the metals, however.
The mining stocks’ situation is critical and the miners could either drag gold and silver down or flash a strong buy signal if the HUI Index breakdown is invalidated. We hope to see the gold stocks invalidate their breakdown, but we will have to take whatever the market gives us and act accordingly. In a way decline could be positive as it would allow for re-entering the market at much lower prices.
Trading – PR: No position
Trading – SP Indicators: Long position in gold, silver and mining stocks
Long-term investments: Remain in the market with your gold and silver holdings. Keep only half of your mining stock holdings.
| Portfolio's Part | Position | Stop-loss / Expiry Date |
|---|---|---|
| Trading: Mining stocks | Long (half) | - / Apr 19, 2013 (half) |
| Trading: Gold | Long (half) | - / Apr 18, 2013 (half) |
| Trading: Silver | Long (half) | - / Apr 18 2013 (half) |
| Long-term investments: Gold | Long | $1,496 |
| Long-term investments: Silver | Long | $24.9 |
| Long-term investments: Mining Stocks | Long (half) | 315 |
This completes this week’s Premium Update. Our next Premium Update is scheduled for April 12, 2013, however we will continue to send out Market Alerts at least daily (unless a Premium Update is scheduled for a given day) at least until the end of April, 2013.
Thank you for using the Premium Service. Have a profitable week, and a great weekend!
Sincerely,
Przemyslaw Radomski, CFA

