
- Euro & USD Indices
- General Stock Market
- Crude Oil
- Correlation Matrix
- Gold
- Silver
- Platinum
- Mining Stocks
- SP Indicators
- Letters from Subscribers
- S&P 500 and PM stocks outlook
- Important support/resistance lines
- The new tool, which can distinguish small movements from bigger sell-offs/rallies
- Will the Wall Street equities soar for the remainder of 2013 and gold will do very poorly?
- Additional information
- Summary
The Dow Jones Industrial Average climbed a steep wall of worry and Tuesday returned to its all-time high from late 2007. The Dow finished at 14253.77, topping the previous record set in October 2007 and is already up 8.8% for the year. The Fed’s expansive monetary policy to prop up the economy has kept stocks climbing higher despite a less than glowing global economy. By pumping trillions into the financial system, the Fed has convinced investors it will provide a safety net for future shocks. In addition, by keeping interest rates extremely low, the Fed is forcing investors to seek higher returns in the stock market.
The financial press is hailing it a historic day.
But we suggest stopping a moment before chilling the champagne. Despite reaching its all-time high, the stock market has provided investors with zip, zilch, zero return over the last five and one-half years. The Dow has just gotten back to where it was in October 2007 and many investors are still struggling to make up their losses after the credit crisis that erased $37 trillion from global equity values. When the housing bubble burst in 2008 the DOW plunged 34 percent in 2008 for the worst performance in 77 years.
The Dow may be reaching new highs but many American households are still struggling. About 14 million homeowners are still underwater on their mortgages. Jobs and wages have not regained their pre-crisis highs. Home prices are still nearly 26 percent below their level when the Dow last peaked and the job market has recovered only 5.5 million of the 8.7 million jobs lost during the recession.
During the five and a half year period since the crisis, gold has provided a return of approximately 119%.
We don’t mean to dump cold water on the celebration. We just want to keep things in prospective. Once we factor in inflation over the past few years, the all-time high looks less convincing. With consumer-price increases removed, the Dow has not been in real record territory in more than 13 years. A Wall Street Journal article contends that the last real, or inflation-adjusted, Dow record was on Jan. 14, 2000. Since then it looks like the Dow has risen 22% if you don’t take inflation into account. But if you do, Tuesday’s high is still more than 10% below that record.
Tuesday's close is just 9256.38 once inflation is removed. That doesn't even match the inflation-adjusted high of 10194.80 hit in 2007 – and we’re only taking the official inflation numbers into account here. And it is far from the real record of 10424.28 hit Jan. 14, 2000, according to calculations by Bespoke Investment Group.
Inflation is definitely something to take into account when investing to meet future needs. Central bankers can print all the fiat currency they like but they can’t manufacture gold. Its supply is more or less fixed (discoveries are made, but you can’t suddenly increase gold production by 500% and you can do that in case of fiat currencies). It cannot be inflated by central banks, which is why it is considered an inflation hedge and the ultimate alternative currency (or the only true one). The reason a glass of soda cost a penny in the beginning of the last century and now costs several dollars is not that soda water was cheaper then, but rather that the dollar had more value.
It will be interesting to see what will take place in the stock market in the short run. In the past, new Dow records generated buying frenzies as everyone tried to get on board. The median flow of money into stock funds usually triples in the six months after the record, according to a report on WSJ.com Tuesday. Read: New Dow highs usually spur more buying.
Denmark’s OMX Copenhagen 20 Index has also attained its pre-crisis high. Other indexes haven’t fared as well. Among the 45 stock markets tracked by Bloomberg, eight were less than half way from where their peaks were. Not surprisingly, Greece lagged the most with the Athens Stock Exchange General Index trading 85 percent below its September 1999 high. Europe accounted for seven of the 10 stock markets trading furthest away from their peaks. Japan’s Nikkei 225 Stock Average trailed its 1989 peak by 70 percent as the economy shrank due to an aging population and declining exports. Even China’s Shanghai Composite was 62 percent below its 2007 record.
Some of the big hedge funds still are betting on the price of gold, even though a large number have sold most in the last quarter of 2012 (who knows that happened in the past few weeks when volume was so high…), if not all, their shares in SPDR Gold Trust ETF (GLD -0.09%). Hedge fund manager John Paulson and his firm, Paulson & Co., remain solidly in the gold camp. Paulson continues to hold the largest position in GLD with nearly 22 million shares, worth an astonishing $3.344 billion.
Let’s see what’s next. We’ll start the technical part of today’s update with the analysis of the USD Index (charts courtesy by http://stockcharts.com.)
USD Index
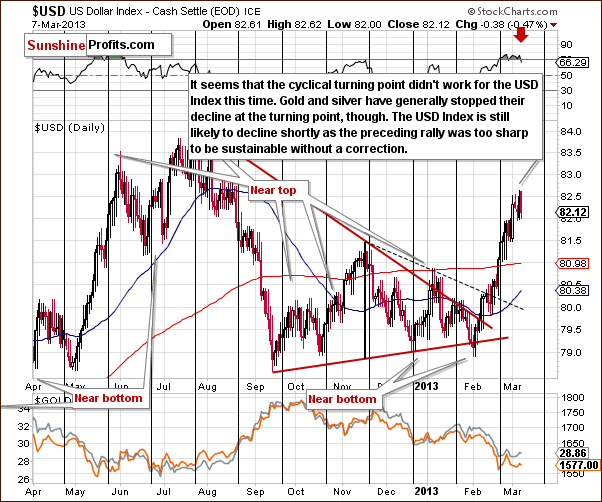
We begin this week with our USD Index charts. In the short-term chart, we see that not much happened to the USD Index around the cyclical turning point, but it seems to have worked for precious metals prices. Gold and silver’s price declines stopped, and it seems that the USD Index values are still likely to decline due to the type of rally seen from February to early March. It was simply too sharp to be sustainable, and the RSI confirms this. It’s likely that gold and silver will react positively to the weakness in the dollar as we move through the month of March.
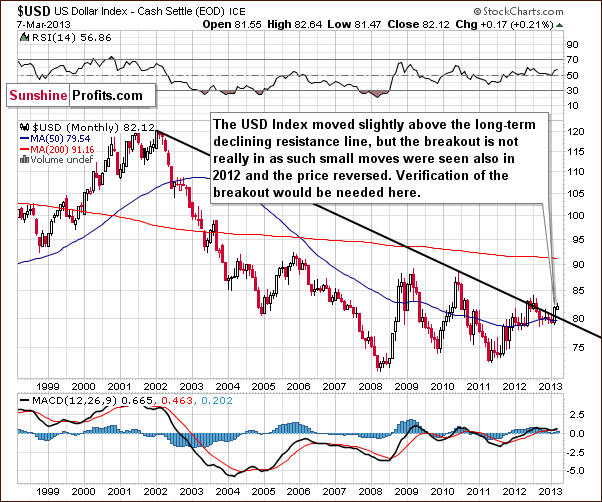
In the long-term USD Index chart, comments made in last week’s Premium Update remain up-to-date:
…we [saw] a move ..… above the declining long-term resistance line which normally would be a big deal. However, in the middle of last year when this happened, it was followed by an invalidation of the breakout and a subsequent decline. We expect to see the same thing here once again. Keep in mind that we have not seen a weekly close above this resistance line and really need to see several before stating that the breakout is truly confirmed.
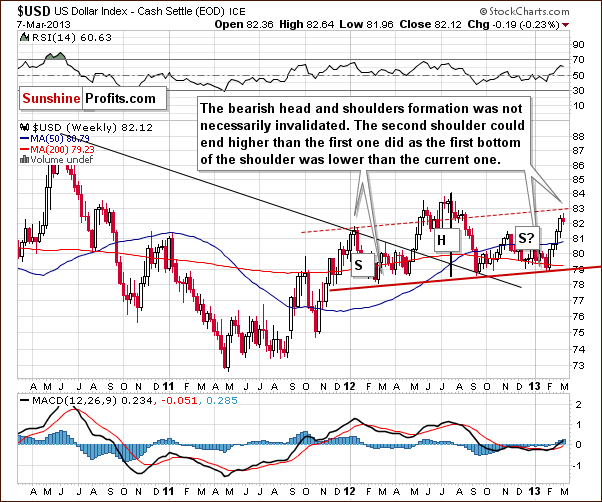
In the medium-term USD Index chart, the important thing to discuss here is the head-and-shoulders formation. This trading pattern has bearish implications for the USD Index and the question now is whether the formation is still present given the recent rally. We feel the answer is “yes”, because even though the index is now higher than the level of the left shoulder, the full formation is simply a bit skewed.
Local bottoms have been a bit higher each time so it is perhaps quite natural for the second shoulder to be above the first shoulder. Consequently, the formation could still be completed - though not yet - the other should has yet to form. Declines in the index are needed for this to happen, and we feel this could still be seen.
Summing up, although the cyclical turning point has passed, it still seems as though the index will soon reverse and move to the downside. Several signals indicate this as being likely and bullish signs are generally lacking this week for the greenback (except for the unconfirmed breakout above the very long-term resistance line). Interestingly, the cyclical turning point seems to have stopped metals’ decline in February.
General Stock Market
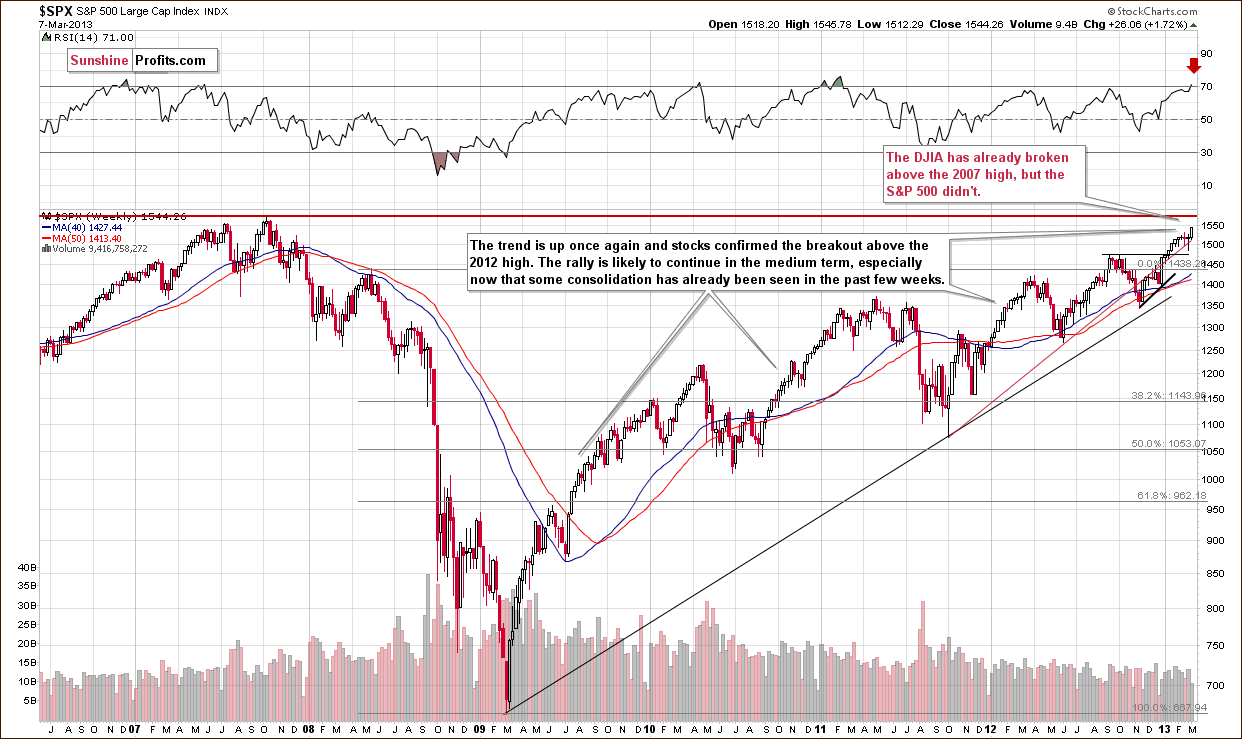
In the long-term S&P 500 Index chart, we see that the broad market has yet to break out above its 2007 high. The Dow Jones Industrials did so, but the S&P 500 have not, so there is no confirmation of a breakout here. This creates a particularly interesting situation.
It seems that the S&P 500 could rally further as their major resistance line has not yet been reached. The Dow Industrials could also rally further since they have already broken out above the resistance level of the 2007 highs. A pause, however, would be likely once the S&P 500 reached their 2007 high.
Our best guess at this time is that the S&P 500 will likely consolidate below the 2007 top, and the Dow Industrials’ consolidation will probably take the form of a post-breakout breather. The RSI suggests an overbought situation, so some consolidation is expected at this time. We expect the rally to continue after a few weeks of consolidation. We will be more certain of a medium-term rally after the breakout is also seen in the S&P 500. Such a development appears quite likely at the moment.
Crude Oil
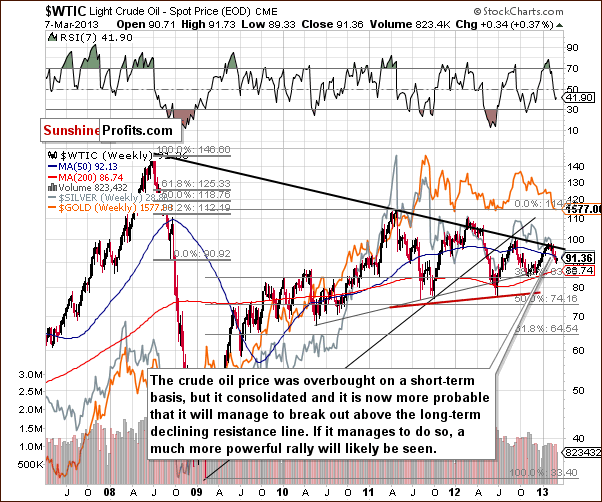
We now turn to the crude oil price chart where last week’s Premium Update comments are still accurate:
With some consolidation having been seen here, the odds for a breakout are much higher (60% or so) than they were a few weeks ago (40% or so). With higher stock prices and lower USD Index values, we expect the breakout in oil prices to materialize soon. Such a development could take other commodities as well as the precious metals to higher price levels.
The RSI indicator is actually below the 50 level – a bigger move could definitely be seen here.
Gold and Silver Correlations
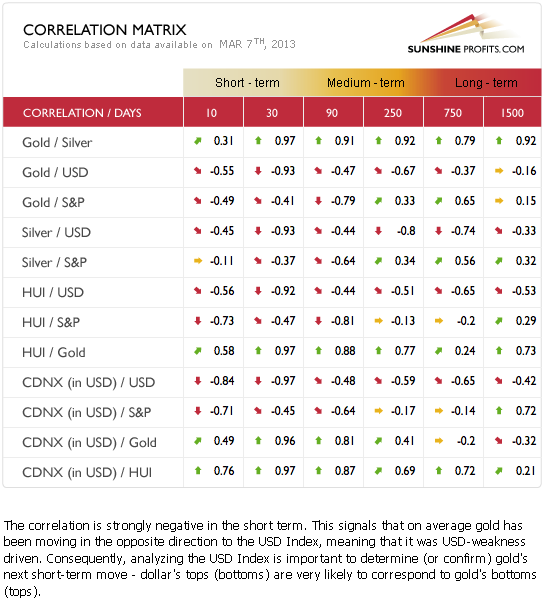
The Correlation Matrix is a tool which we have developed to analyze the impact of the currency markets and the general stock market upon the precious metals sector, (namely: gold and silver correlations). The precious metals and the USD Index show a strong, negative correlation for the past 30 days. In the last several days however, gold prices did not continue their decline, that is, did not respond to the USD Index strength. This is a bullish combination and provides an indication that gold prices will rally if the dollar declines significantly (!). It also suggests that additional small (!) daily rally in the USD Index may not really hurt the price of gold.
Gold
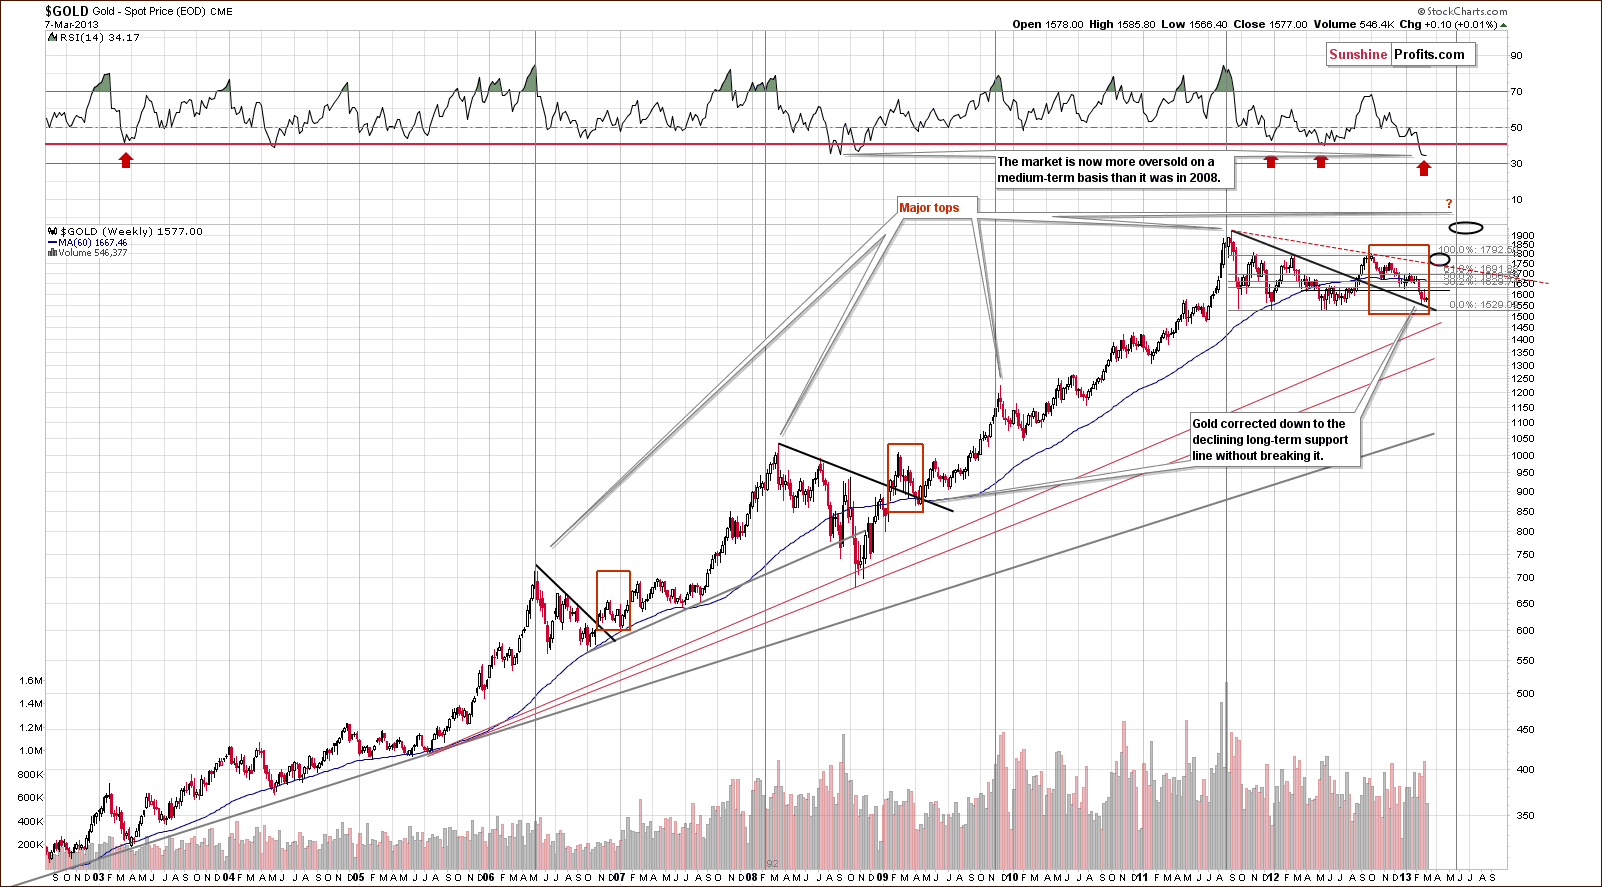
In this week’s very long-term gold chart, very little change was seen. Gold’s price moved $0.10 higher this week, an increase of 0.01%, basically flat. With USD Index values moving up a bit this week, the situation isn't all that bad here. It seems that gold prices bottomed in late February by correcting to the declining support line seen on the above chart.
RSI levels continue to describe the situation as very similar to 2008 when a major bottom formed. Back then, it took just a few months for gold to rally from about $700 an ounce to $1,000 an ounce. If a similar percentage increase is seen this year, gold could rally to $2,250 in just a few months (that’s not our official target, though). This appears possible based on the long-term cycles still present here as indicated by the vertical lines in our chart.
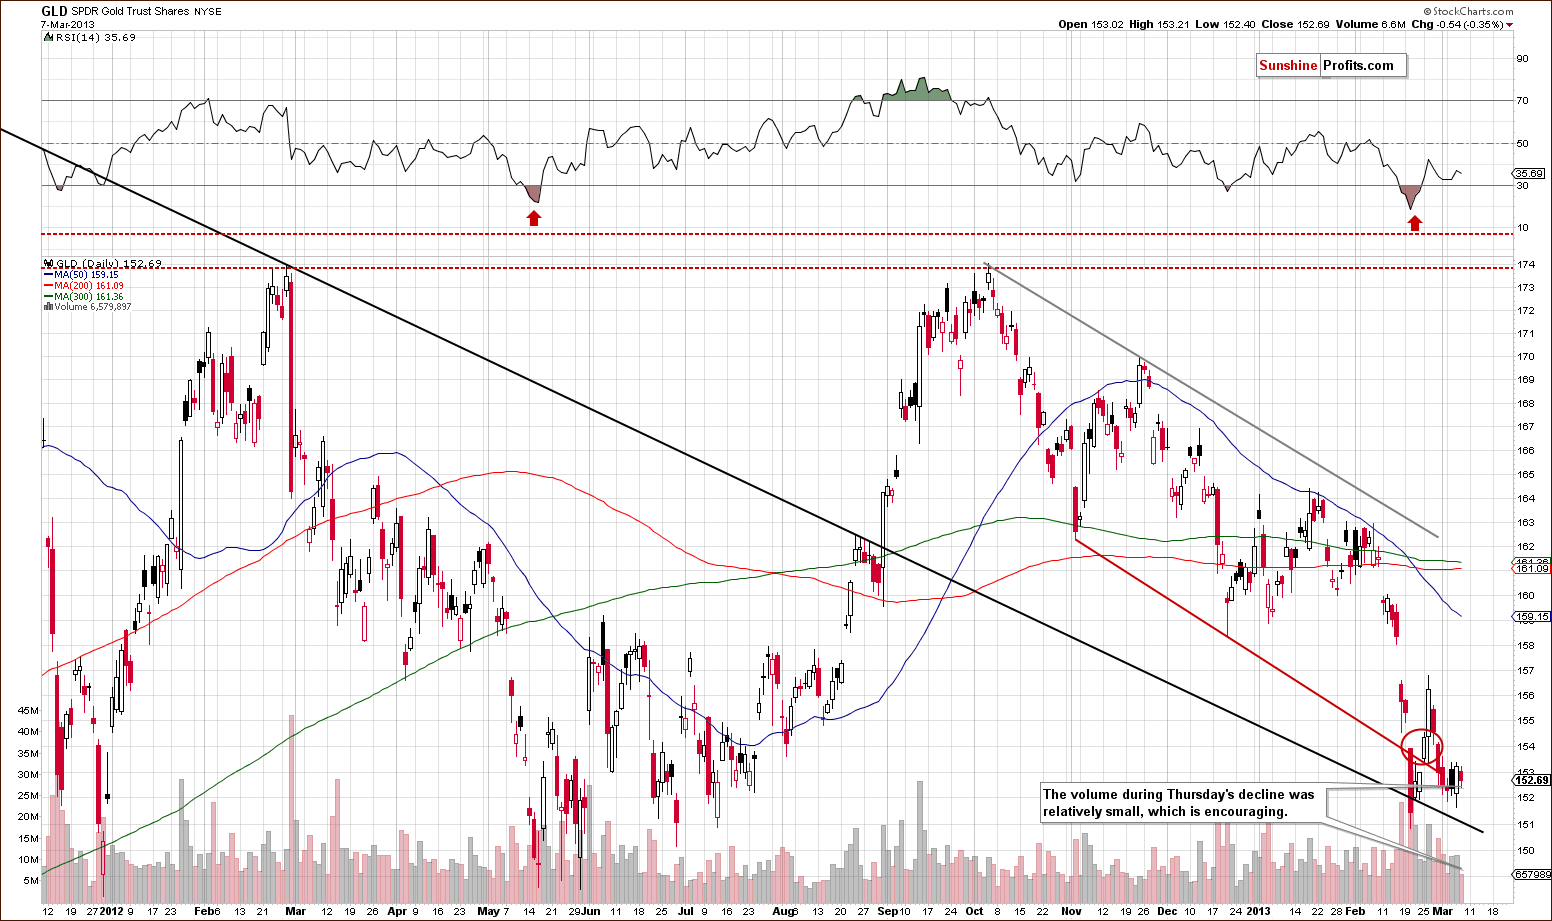
In the short-term GLD ETF chart, we see that gold prices have not gone to new lows for several weeks here. We also see the volume on Thursday was quite limited as was the decline. This appears to be a pause after a rally, which is a positive very short-term indicator. It has no impact on the medium term or even next week but for Friday and maybe a couple of more days, the indications here are bullish.
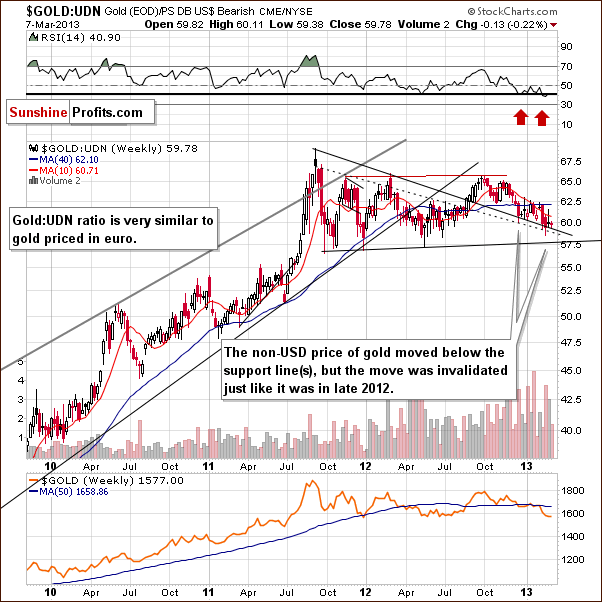
In this week’s chart of gold from the non-USD perspective, comments made in last week’s Premium Update are still up-to-date:
…the breakdown [had been previously] invalidated. Prices did pull back and rally [last] week, but overall, on average, the price in non-USD currencies is now clearly above the medium-term declining support line. The breakdown has been invalidated and the picture remains bullish.
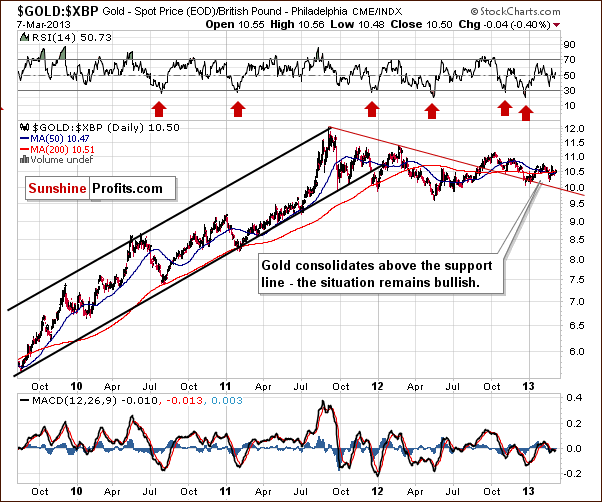
In this week’s chart of gold from the British pound perspective, we see no change in what we discussed last week. Indicators remain the same here and our comments from last week’s Premium Update are still valid:
The consolidation has continued, and prices are clearly above the declining resistance line. The consolidation began last October, and the situation remains bullish; prices are expected to move to the upside. It’s good to remember the saying that, “the longer the base, the stronger the move”. The consolidation lasted for a long time so the coming rally will likely be significant. The consolidation is exceptionally visible.
The reason a lengthy consolidation often leads to a significant rally is that many investors stay on the sidelines or continue to leave the market while the consolidation plays out. This keeps the consolidation in place to some extent until something finally triggers a move to the upside to signal that the consolidation is about to end. Then an influx of capital from the sidelines quickly drives the price even higher. With longer consolidations, more investors, and thus capital, is waiting on the sidelines and can fuel following move.
This is what we have on the precious metals market now – combined with discouragement. Since the fundamentals are on our side, this creates a significant potential, just waiting to be triggered.
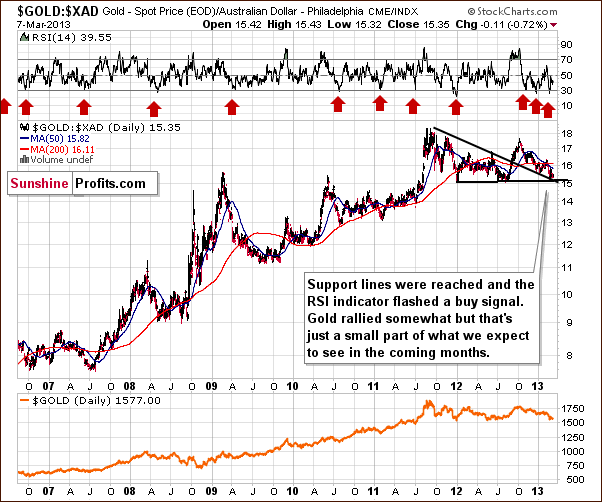
In this week’s chart of gold from the Australian dollar perspective, there has been little change since last week as gold’s price moved just $.10 XAD to the downside here. The medium-term support line is still in place, and it seems likely that the next move here will be to the upside.
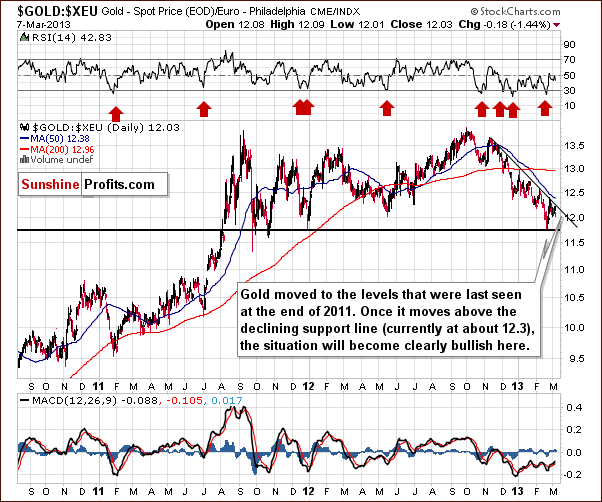
In this week’s chart of gold from the euro perspective, we see another attempt to move above the declining resistance line. It seems that we are getting closer to seeing these attempts finally succeed and it appears that the next attempt will likely move beyond the resistance and finally result in a breakout.

In this week’s chart of gold from the Japanese yen perspective, we clearly see a move above the 2011 high. With the success of this breakout and continuation of the rally here, this chart is the most bullish gold chart we have this week.
The Japanese bank has long favored weakening it currency and Japanese stocks have higher nominal prices because of this. The same holds true for other assets, for when the yen is losing value, everything else priced in yen goes up. Similar developments will likely be seen in other currencies having both an immediate and long-term impact. With the quantitative easing in the US, gold’s price will most likely move higher as well though this has yet to be seen.
Summing up, gold appears poised to move to the upside but the exact timing of such a move is still not crystal clear. Some indicators point to higher prices quite soon, there’s a possibility of a very sharp rally over the next few months, and it’s also possible that nothing major will happen for a week or two. We will continue to monitor this market and interpret new signals as they appear. For now we continue to think that being long gold is a good idea when you take all of these scenarios into account.
Silver
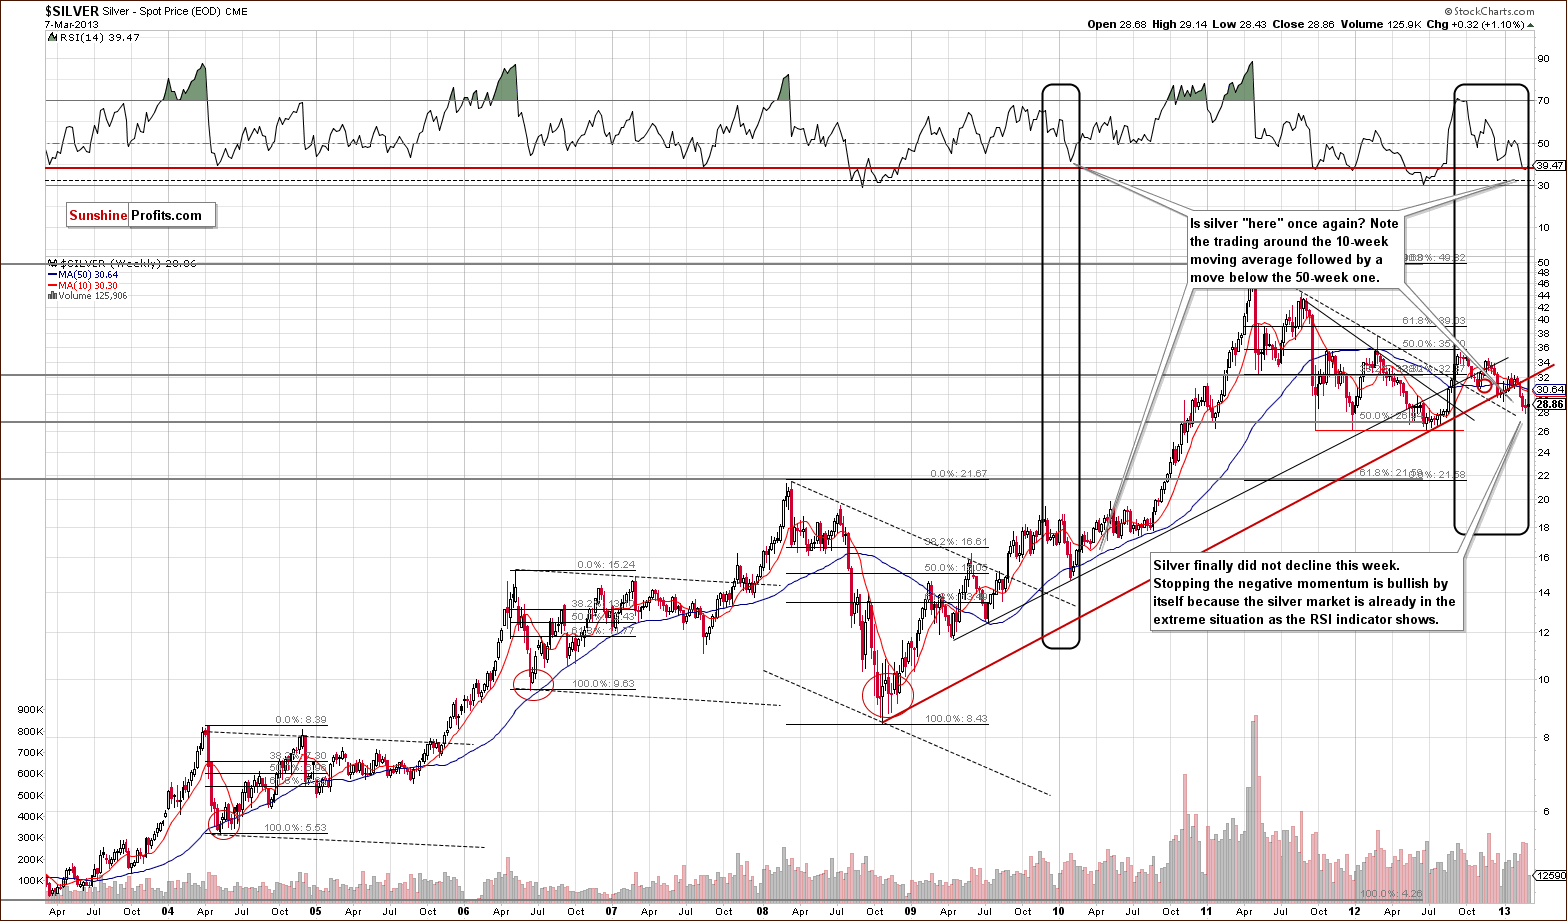
In this week’s very long-term silver chart, it’s interesting that for the first time in four weeks, silver’s price did not decline. This is normally not a big deal, but with the RSI level at the horizontal red line, the situation becomes quite different. A stop in the declines quite likely means a bottom has been marked, something which confirms what we see in RSI levels as well.
The point is that with the RSI indicator being where it is, we are expecting to see a bottom. In this environment even a slightly bullish factor becomes a significant one as the oversold status amplifies it.
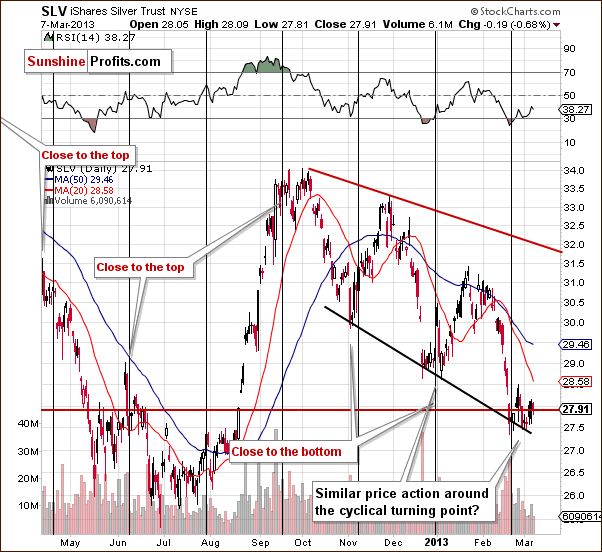
In the medium-term SLV ETF chart, we still see back and forth price movements and it’s somewhat in tune with what happened at a past cyclical turning point, where a rally eventually followed (see preceding to two cases). We continue to expect to see a rally as the next big move in silver prices.
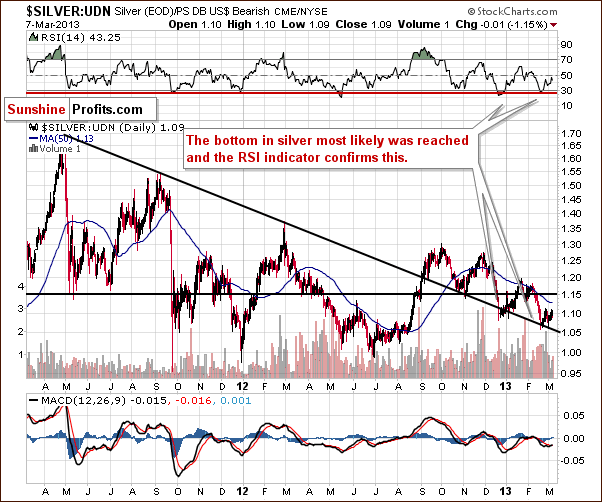
In this week’s chart of silver from the non-USD perspective, last week’s Premium Update comments are still current:
(…) we see that the bottom is in and silver’s price is now [close to] the declining long-term support line. When this was last seen, late in 2012 (RSI levels were oversold then as well), prices soon rallied sharply and rose 10% in just a few weeks. With similar trading patterns and RSI levels seen in recent days, there appears to be a good possibility that a sharp move to the upside may be just around the corner here.
Summing up, silver’s recent price declines appear to have ended and it’s likely that the next move will be to the upside. Indications this week are that silver will begin another rally sometime in the coming weeks, perhaps right away. Either way, it seems that being long silver is justified from the risk/reward point of view.
Platinum
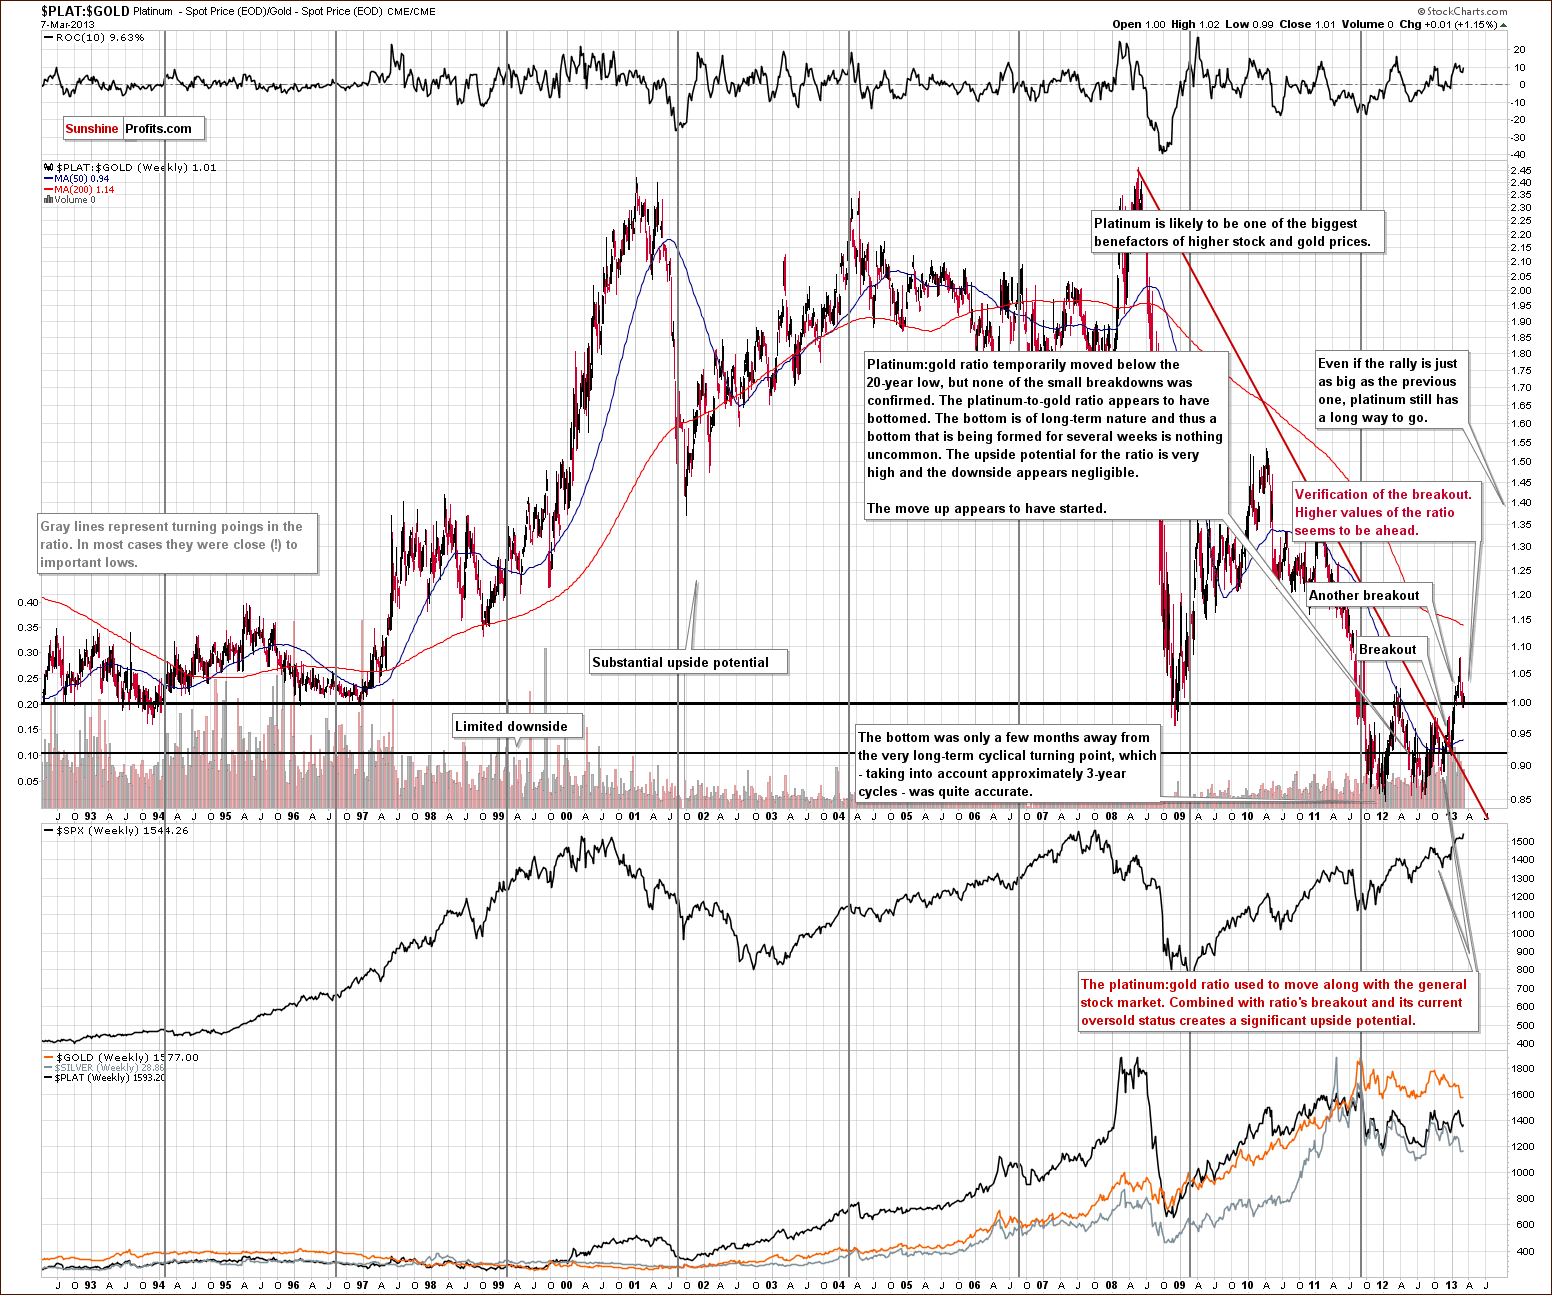
In this week’s very long-term platinum to gold ratio chart, we see that the ratio corrected and has broken out above an important resistance line (1.00 level). We expect a rally to be seen once again and if it continues we’ll likely suggests platinum for speculative purposes. Its long-term outlook remains bullish and we expect platinum to outperform gold in the coming months.
Gold and Silver Mining Stocks
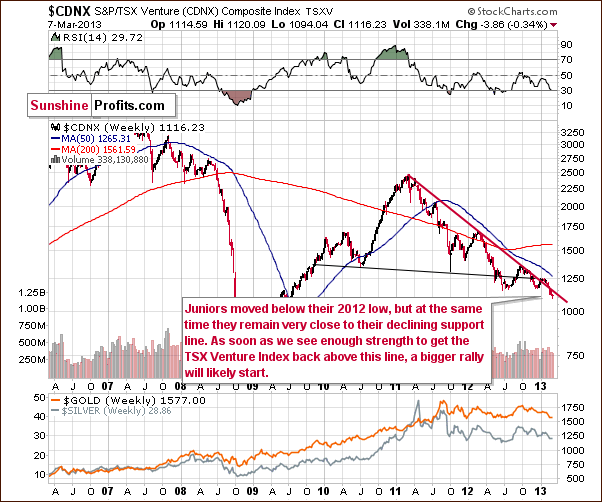
In the Toronto Stock Exchange Venture Index (which is a proxy for the junior miners as so many of them are included in it), we see a move below the 2012 low this week but prices are still close to this level. Since juniors are so close to the declining resistance line, once a bit of strength is seen here, a significant rally is likely to begin. As the saying goes, “the longer the base, the stronger the move”, and the base period here is about 6 months so the rally could indeed be powerful.
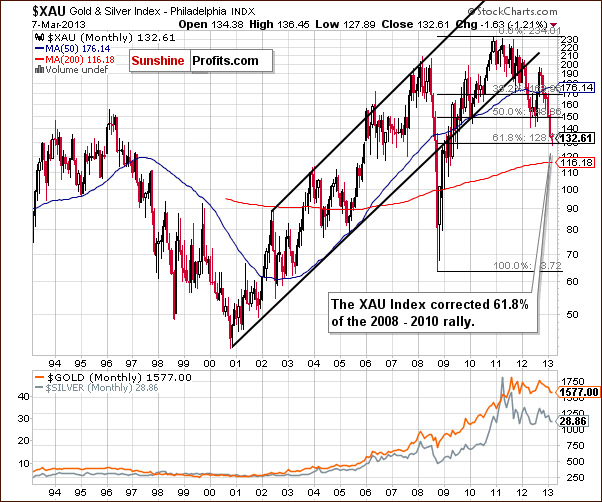
As we wrote in the March 6 Market Alert, and as you can see on the above chart featuring the XAU gold and silver mining stocks index, the value of the index has corrected to the 61.8% Fibonacci retracement level of the 2008 to 2010 rally. This is an important level which has been reached after a significant decline, so at least a few-week-long pullback is likely based on this chart alone.

In this week’s very long-term HUI index chart, which covers the whole current bull market for gold stocks, we can see that the support line created by the bottoms of 2000 and 2008 has almost been reached. It is not the only major support line in play, however. The 50% Fibonacci retracement level of the 2000 to 2011 rally, where actually ½ of the whole bull market has been retraced. At the same time, we see the 61.8% retracement level of the 2008 to 2011 rally, similar to our XAU Index chart. Since these retracement levels were reached, the bottom could very well be in and the HUI Index may not move lower.
Please look at the indicators, at the top and bottom of the chart. The RSI has only been this oversold in 2008 and 2000 both at major bottoms. The stochastic indicator at the bottom was only this oversold back in 2000. The situation now is in a way more extreme than 2008. A major bottom is likely in or very close to being in.

In this week’s GDX ETF index chart, we see that Wednesday’s rally was significant in volume and in price. Such a rally, especially after a move lower early in the session has bullish implications. It seems this market is finally showing strength.
Please recall what we wrote in yesterday’s Market Alert – the above provides a graphical illustration to these comments:
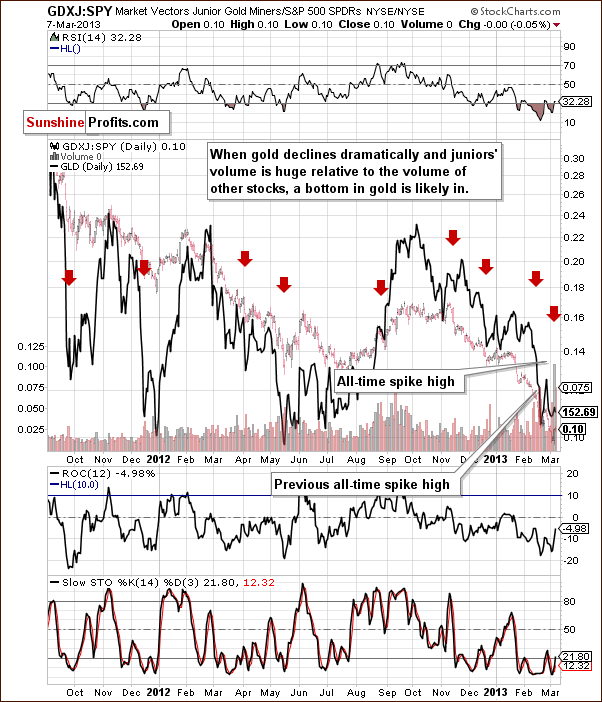
"In Friday's Premium Update, we featured the GDXJ:SPY ratio (junior-mining-stocks to the general stock market ratio) and wrote that a spike high had been seen shortly before in the ratio of volumes between these ETFs. These spike highs in the ratio of volumes heralded local bottoms many times in the past."
(…)
The reason we mention all this is that yesterday the all-time high was exceeded by about 30%. That's a very important and bullish signal - it would be significant at any time but since we see it after a big decline and among negative sentiment, it's very bullish.
Consequently,we think that going long mining stocks with your speculative capital is a good idea right now.
Moreover, if we see an additional sign of strength, we will consider doubling the size of speculative long positions in the precious metals sector.
The implications are clearly bullish here.
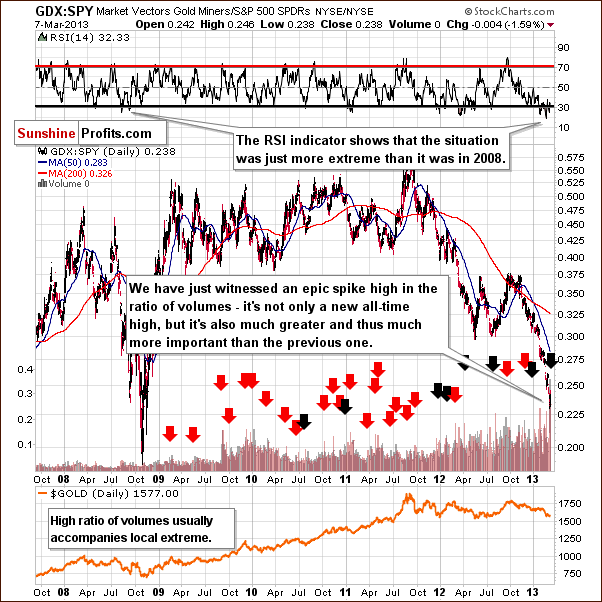
In this week’s GDX:SPY ratio chart, we see a huge spike in the ratio volumes, actually much higher than ever seen before. A high ratio of volumes usually accompanies local extremes and we are surely close to a local bottom here, not a top. Clearly this could mark the end of the corrections in the entire precious metals sector not only the mining stocks.
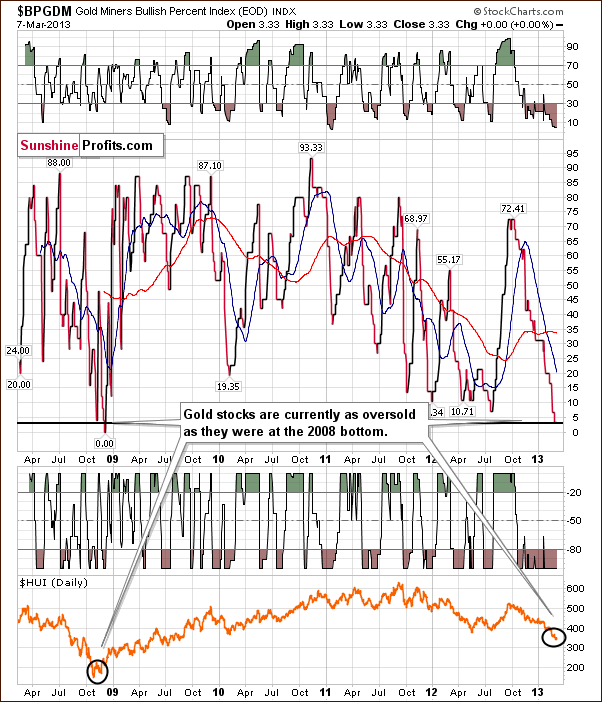
In this week’s Gold Miners Bullish Percent Index chart, comments made in last week’s Premium Update remain up-to date:
The interesting thing about gold stocks is that the Gold Miners Bullish Percent Index just dropped below 5. The only 2 times that has been the case (ever - since this index' inception in 2008) were in early Nov 2008 and early Dec 2008 - after both parts of the major double-bottom pattern. Naturally, the implications are bullish as this is yet another signal that the sentiment is now extremely negative for the whole sector.
This chart confirms that the situation is critical.When it has been as oversold in the past, the major bottom had already been seen and higher prices quickly followed. The implications here are clearly bullish for gold prices in the weeks ahead.
Summing up, the outlook for the mining stocks is becoming more bullish with each passing week. Numerous signals this week point to a turnaround on the horizon and it appears that the miners will once again begin a period of rally. The exact timing of its start is still a bit unclear though it does not seem to be far off. We will continue to watch for developments which allow us to put a timeline together on what to expect here and inform you accordingly.
Sunshine Profits Indicators
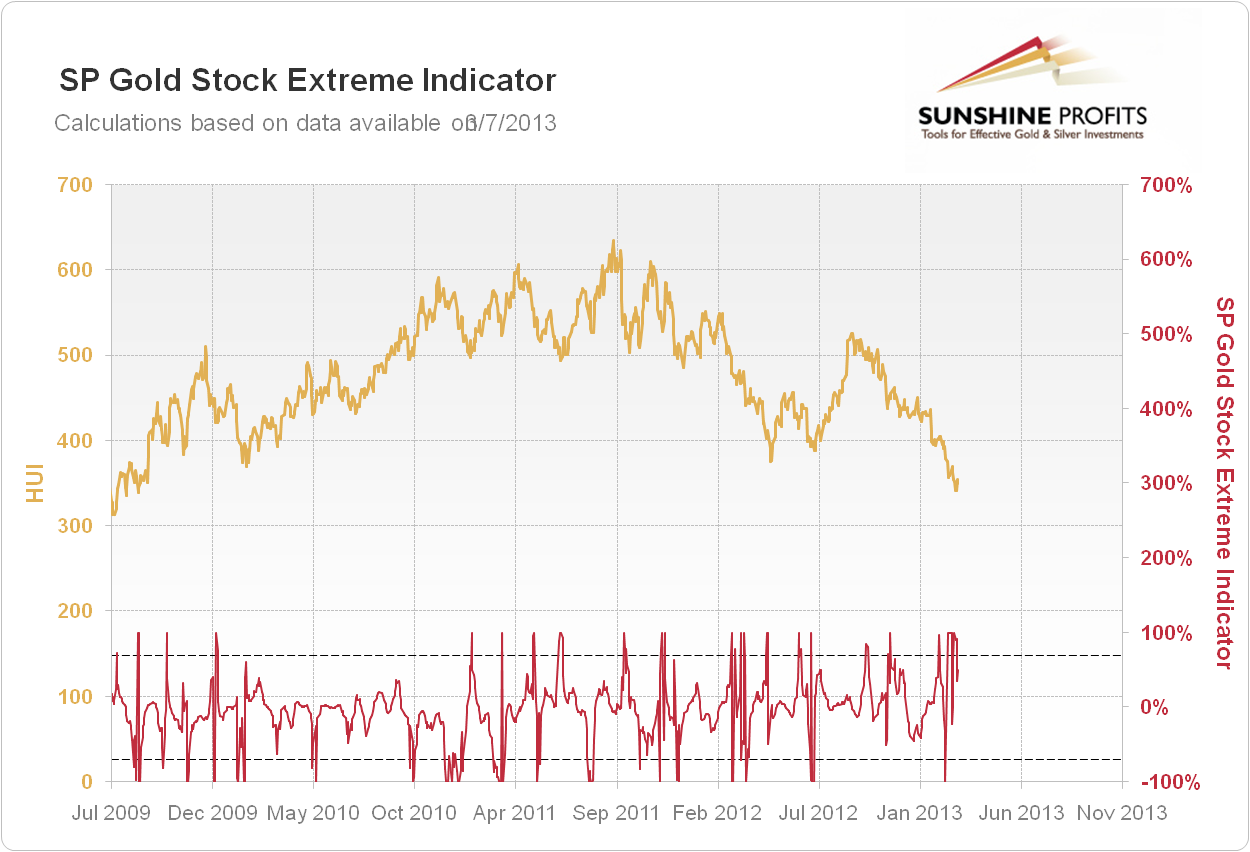
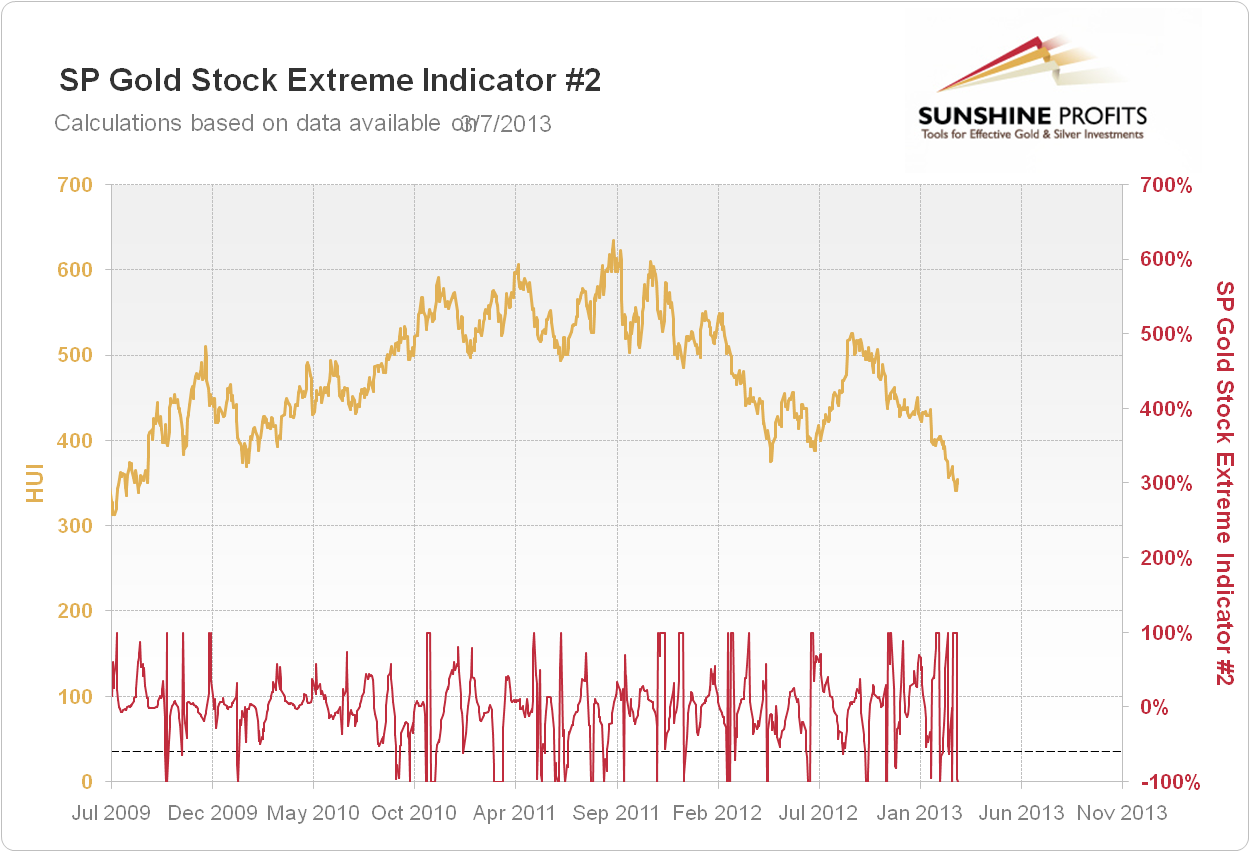
We just saw two additional extreme readings in our SP Extreme indicators (both of them) and these are buy signal for gold, silver, and mining stocks. Please note that these indicators were already suggesting being long, so at this time the signal simply prolongs the duration of the signal. We have updated the table on in the summary section accordingly.
Letters from Subscribers
Q: Could you comment on this article? Do you have a similar outlook for the S&P 500 and PM stocks?
A: As far as the general stock market is concerned, we think that making long-term price projections at this time based mainly on the broadening consolidation pattern is not a good idea. The bearish thing about the formation in our view is the resistance line that comes from connecting the 2000 and 2007 tops. If stocks break out above these highs, the medium-term outlook will actually become very bullish. The important thing here is that this chart features long-term price changes and the fundamental situation has changed a lot in the meantime, because of the QE programs. The more long-term the move is, the bigger the role played by the fundamentals in determining where the market will move next. With the Fed pushing prices higher (not only stocks but also other goods and commodities which will sooner or later result in inflation) we think higher nominal stock values are more likely than not in the coming months.
Q: Also here the author draws 2 very strong and likewise important support/resistance lines at $1500-$1550 and $1780-$1800. Do you think it's worth selling the now open speculative positions around $1780 and reopening them again after a decisive confirmed breakout above $1800?
A: It depends on how we get to these levels. If we see a rally followed by a consolidation, and then a continuation of the rally, and then gold approaches the $1,780 - $1,800 range without being overbought, then we will probably not suggest getting out of the speculative long positions. If the rally to these levels is sharp (and this seems likely) then we will indeed consider closing the long positions in this range. However, we might then suggest reopening them at lower prices, not necessarily after the breakout. It all depends on what signals we will see at that time.
Q: The new tool - I hope it will be as reliable as you say - does it distinguish between small sideways up/down movements and bigger sell-offs/rallies? This would make it a powerful tool.
A: Yes, it has 3 modes (and this will be the case for most of the upcoming tools): very short term (7-day projection), short term (30-day projection) and medium term (90-day price projection). We're still making final tests - things are a bit more difficult in testing it, because this and the previous year were the odd ones - gold and the rest of the sector consolidated instead of making more decisive moves. Making a test for this and the previous year takes a bit less than a day for a given mode for one asset (you can imagine the complexity of the algorithm). Meanwhile we're also working on speeding up the testing procedure. Either way, we will first make sure that the tool is ready to use, then we will release it. We want to sleep well at night knowing that we provide only what has been thoroughly tested.
Q: Thank you for your hard work on precious metals. I am afraid that when gold reached $1,900 in 2011 it was too much and too fast and we are making a big mistake thinking that gold will go higher. I expect that Wall Street equities will soar for the remainder of 2013 and gold will do very poorly. There are many good stocks now and one can do very well by investing in these stocks.
However, my record for predictions of this sort is bad. I am hoping that this time my record will be horrible. If so, gold may go to $3,500/ounce.
A: Actually, our whole update is a reply to this comment. We remain bullish, but we wanted to publish it because it shows how negative the sentiment is. Actually, this is how your editor "feels" as well. I can't say that I'm happy about the gold market and its performance at this point. Acting against such strong "feelings" historically proved to be profitable. We're buying when there's blood in the streets.
Additional Information
We would like to repeat what we wrote in yesterday’s Market Alert, as we would like be sure everyone reads it (in case you don’t read alerts regularly but visit the website for Premium Updates each week).
(…) our Twitter and Facebook accounts are much more alive than they used to. In the previous months not much happened there, but that changed this week and we will continue to post content on both pages (and on our Google+ profile as well). If you're using these services or considering using them, we encourage you to stay in touch with us. One of the reasons to follow us on Twitter is that it often features information about our actions on the Internet outside of our website and it does so instantly. For example, your editor started using the Quora.com service which basically is a free global Q&A Panel where professionals share their insights on various topics. At this point we want to be clear that your questions will continue to be our priority and will be answered on SunshineProfits.com. In fact we continuously reply to almost all questions we receive from you - the exceptions are for instance individual questions or general comments that don't require our reply in public. On Quora.com we will reply to some questions that we get interested in and those asking them will have a much smaller chance of getting a reply from us than you will. We will also reply to some general questions - for instance yesterday we replied to a question about communism - why it is considered evil and someone actually appreciated the reply by calling it "the simplest, sanest, answer yet". All of this will go through our Twitter account, so by following it, you will stay up-to-date with these kind of replies too, if you are interested. Of course, we will continue to send out Market Alerts and write Premium Updates.
Summary
The outlook for the USD Index is currently bearish in our view. The short term is heavily overbought and for the medium term, declines will become much more likely as well once the index gets back below the long-term declining support line.
The general stock market is likely to consolidate though not necessarily immediately. It may be seen after the S&P 500 reaches the level of its 2007 top. After the consolidation, we expect stocks to rally once again.
The situation for the gold and silver mining stocks has been extremely oversold for a few weeks now. This week we saw several important and very strong buy signals as well as a few smaller ones. It does not seem that we have long to wait for another significant rally to begin for the miners.
Gold and silver both appear poised to move to the upside sooner rather than later and the long positions seem justified from the risk/reward point of view.
Trading – PR: Long position in gold, silver and mining stocks.
Trading – SP Indicators: Long position in gold, silver and mining stocks
Long-term investments: Remain in the market with your precious metals holdings
| Portfolio's Part | Position | Stop-loss / Expiry Date |
|---|---|---|
| Trading: Mining stocks | Long (full) | 328 (HUI) / Mar 21, 2013 (half) |
| Trading: Gold | Long (full) | $1,544 / Mar 21, 2013 (half) |
| Trading: Silver | Long (full) | $28.80 / Mar 21 2013 (half) |
| Long-term investments | Long | - |
This completes this week’s Premium Update. Our next Premium Update is scheduled for March 15, 2013.
As always, we'll keep you updated should our views on the market change. We will continue to send out Market Alerts as the market situations dictate and each day at least until the end of March, 2013 even if our views on the market don’t change.
Thank you for using the Premium Service. Have a profitable week, a great weekend!
Sincerely,
Przemyslaw Radomski, CFA

