
On this week's news roster we had a hurricane and the Republican National Convention (which scared some Democrats more than the hurricane), but all eyes are on a small town in the state of Wyoming, Jackson Hole, whose claim to fame is majestic Rocky Mountain scenery and the annual meeting of the Kansas City Federal Reserve. At the end of every August, central bankers and economists converge here to take in the views and discuss the latest economic issues. But mostly, along with everyone else on the planet, they wait to see what the Fed Chairman Ben Bernanke will say at 10 a.m. Eastern this morning.
It seems like there are too many people expecting too much from this speech. Gold investors are hoping that he will at least hint today that the Fed is ready to launch another round of bond purchases in order to lower long-term U.S. interest rates and stimulate more borrowing and spending. The Fed signaled last week it's ready to take further steps to spur the economic recovery, according to minutes released Aug. 22 of the central bank's most recent meeting, on July 31-Aug 1. There are still sweet memories of gold's price action when two years ago Bernanke's remarks at Jackson Hole triggered a stock-market rally and an upsurge in the price of gold. Bernanke hinted then that the Fed might begin a second round of quantitative easing and the Fed did indeed start buying bonds three months later. The central bank bought $2.3 trillion of debt from 2008 to 2011 in two rounds of what's become known as quantitative easing. And QE3 isn't the Fed's only option. It already plans to keep short-term interest rates near zero through late 2014 unless the economy improves. Also, the so-called "Operation Twist" is still in process. This is where the Fed sells short-term Treasuries and buys longer-term Treasuries. The program has been extended through the end of 2012.
We sent out a Market Alert this Wednesday saying that the situation is critical since gold and the USD Index are right at their key resistance and support lines and that – despite Fed's monetary actions - the medium-term trend in gold remains down. Gold fell to end at $1,663 on Wednesday as better-than-expected U.S. economic growth triggered profit-taking in the precious metal after its recent rally on speculation of new stimulus from the Federal Reserve.
The U.S. economy is again struggling to grow. It expanded at a tepid 1.7 percent annual rate in the April-June quarter, the government estimated Wednesday. The crisis that has been causing havoc in the past two years has not gone away. This September Greece will be in the news again. The Greek parliament needs to approve an additional 11.5 billion euros in spending cuts for 2013-14. It's a situation of “damned if you do and damned if you don't.” If it does approve spending cuts, Greeks will likely take to the streets again in an angry rampage. If it doesn't, Greece won't get the money needed to keep the economy afloat.
Undoubtedly the strong countries, Germany and France wish that they could rewrite history and not have allowed the weaker countries into their economic union. But for now, they are all stuck together. The option of a break up is too scary to contemplate. This fall eyes will be on Mario Draghi, president of the European Central Bank to see what actions he will take. Draghi chose not to attend the Jackson Hole meeting due to a heavy work load. At least he won't come out with some feeble statement that will dampen the markets. However, he could, for example, buy up the sovereign debt of the countries that are teetering on the edge. But Germany, with its historic fear of inflation, is against. There is worry that the euro zone could face a financial panic with runs on the banks. One wonders how many American banks are invested in these European banks. It is likely that this fall the European nations will again come up with short-term agreements that delay facing the tough decisions. The biggest risk is that investors will no longer trust Europe and unload its bonds. The European Central Bank will have to come up with an effective plan to tackle the high borrowing costs facing struggling euro zone nations such as Spain.
As we publish this latest issue of the Premium Update we still don't have the results of Bernanke's much-anticipated speech, so we will provide you with an update after it takes place. Meanwhile to get a better idea of what is expected for the precious metals, we now turn to the technical portion of the Update. Let's begin this week's technical part with the analysis of the US Dollar Index. We will start with the long-term chart (charts courtesy by http://stockcharts.com.)
USD and Euro Indices
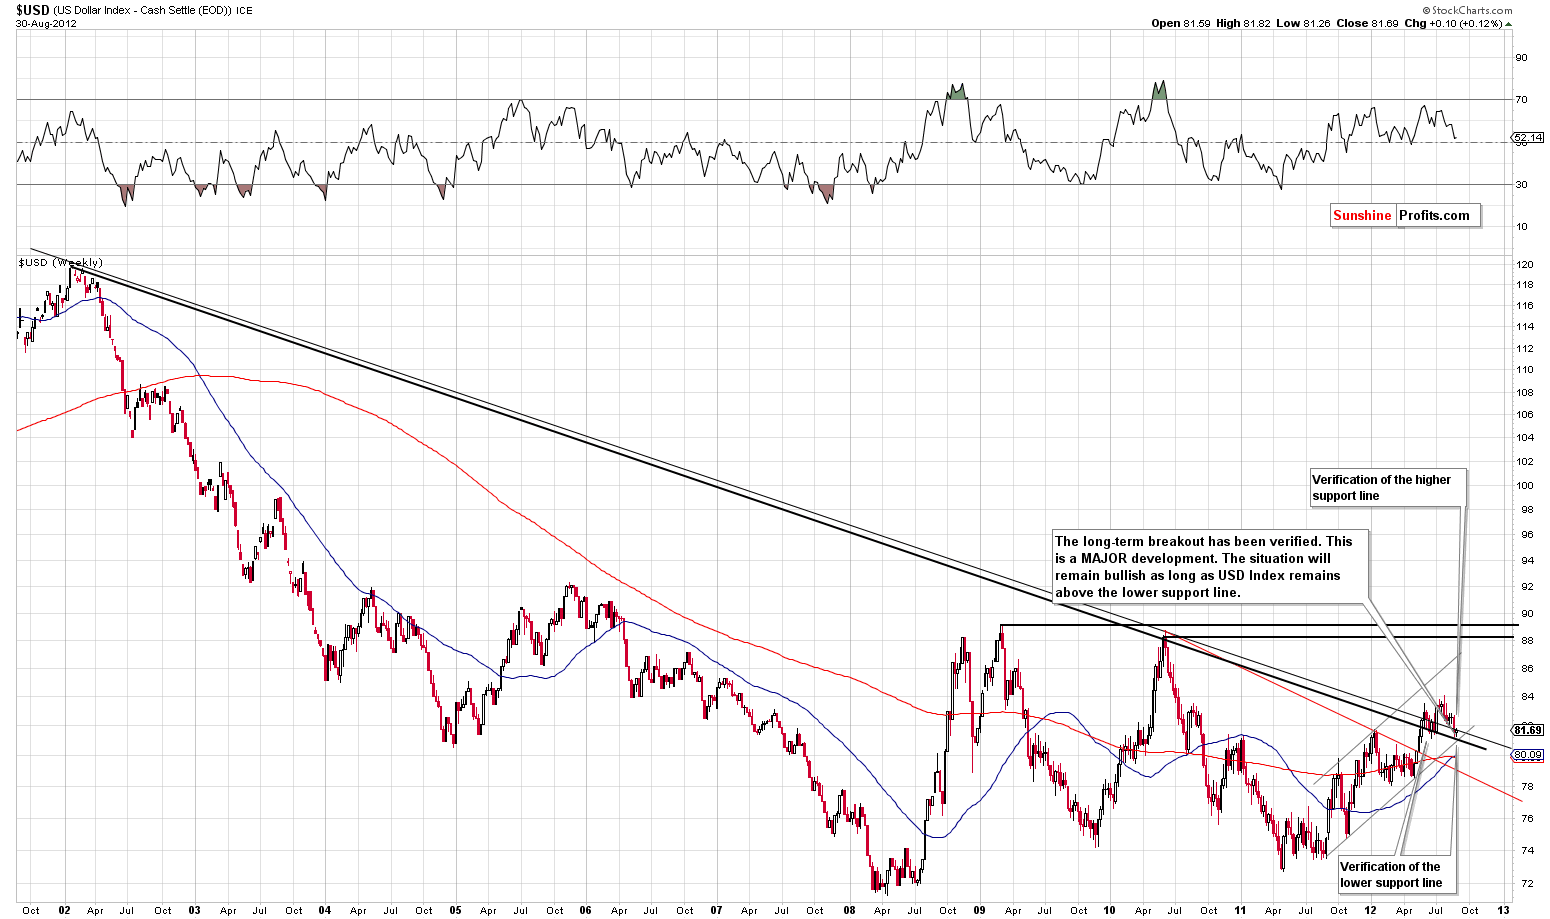
We begin this week with a look at the long-term USD Index chart (please click the above chart to enlarge). There was very little change this week as the index once again moved to the intersection of two major support lines and then higher soon after.
Recall that in last week's Premium Update we stated that the USD Index was “very close to the lower border of the rising medium-term trend channel. Therefore, the medium-term outlook for the USD Index remains bullish.” This week we see that support levels have been verified one more time. Since the medium-term trend remains to the upside and we are after a breakout above the long-term resistance line, the trend going forward is bullish.
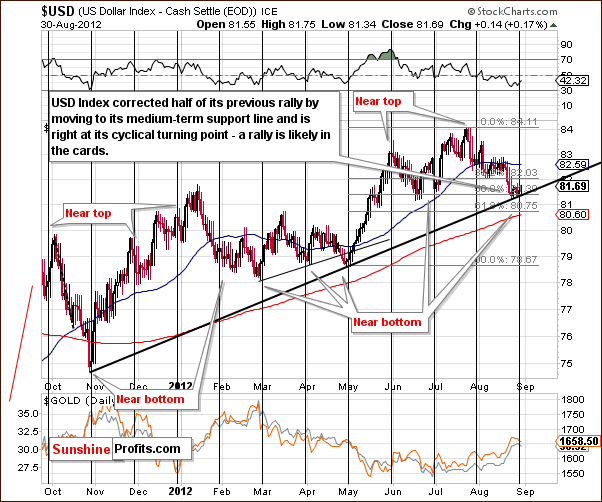
In the short-term USD Index chart, the question this week is whether the short-term trend is likely to reverse to the upside. The answer is probably yes since the USD Index is now right at a cyclical turning point. This is likely to mark a local bottom since declines have been seen on average for about a month. A rally is likely here, and the implications are bearish across the entire precious metals sector.
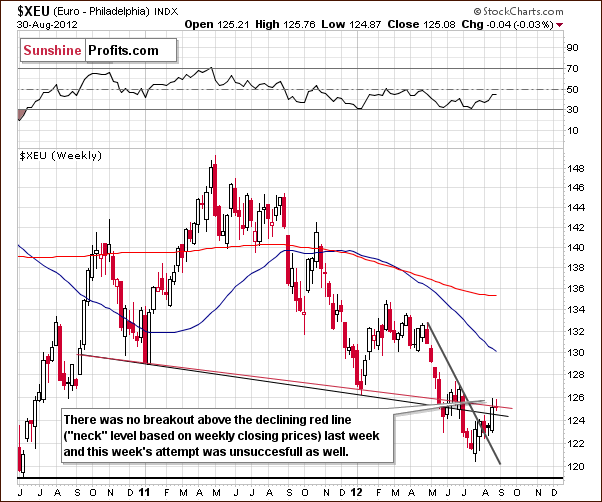
In the long-term Euro Index chart this week, we see an attempt to move above the neck level of the head-and-shoulders pattern. This move was unsuccessful however as the index closed below the declining red resistance line last week and is now trading in the same price range. No breakout has been seen here.
Summing up, the outlook for USD Index remains bullish for the medium term based on the current uptrend, strong support lines which are in place, and a cyclical turning point which has now been reached.
General Stock Market
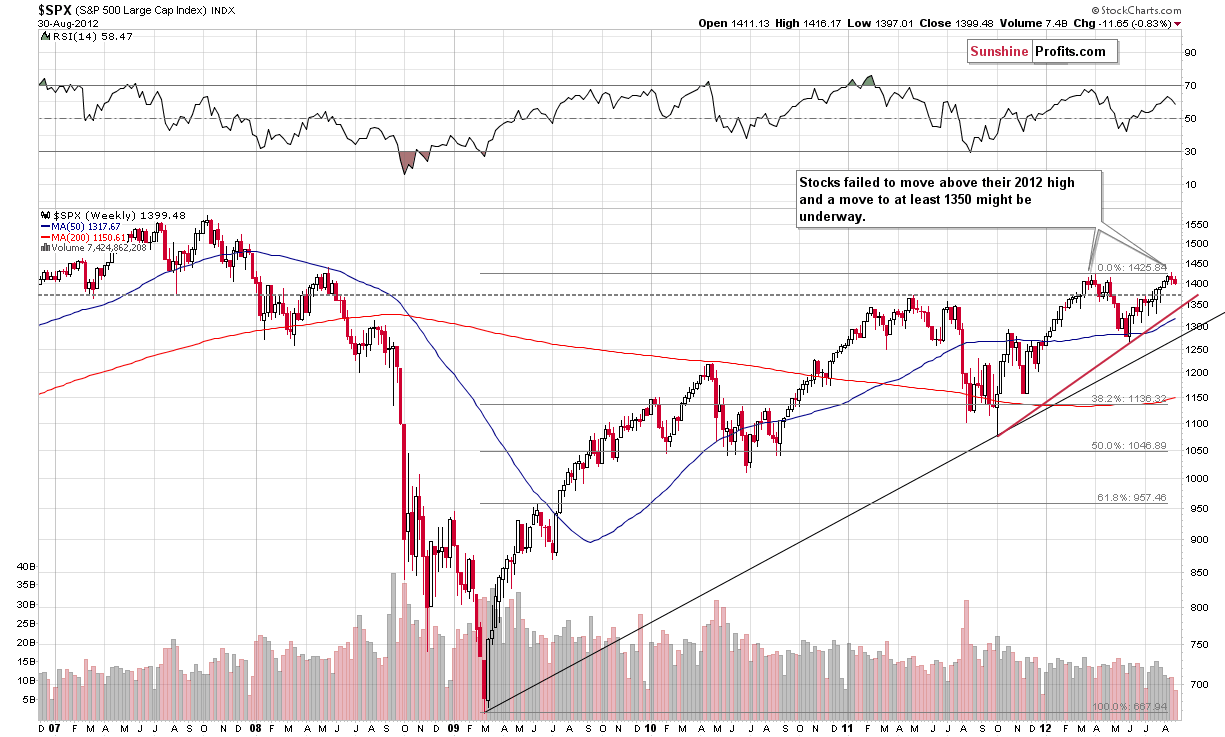
In the long-term S&P 500 Index chart (please click the above chart to enlarge), we see an invalidation of a breakout and the trend now appears to have reversed. The closest significant support level is around $1,350 and a decline to this level could very well be seen. Overall, there is no real change in the outlook for stocks in general and what we stated in our Premium Update last week was really quite accurate and seems to still be up-to-date today:
The outlook now appears quite bearish as stocks failed in their attempt to break out above the 2012 highs... This suggests that a period of decline is likely now with a 1350 or lower downside target level for the S&P 500.
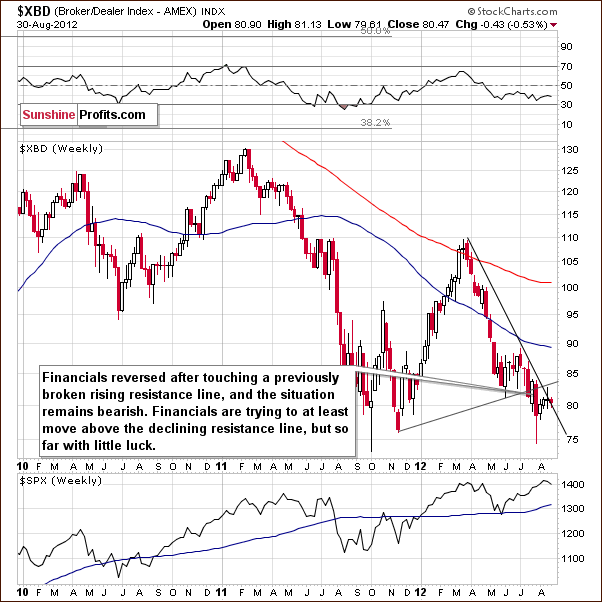
In the Broker Dealer Index chart (a proxy for the financial sector) price levels are about the same, actually a bit lower than last week. The breakout above the steep declining resistance line has not been seen. Price levels are basically right at this level once again as has been the case four times since about the beginning of July.
Summing up, the short-term outlook for stocks is now bearish though not overly so, perhaps simply more bearish than not. The implications for precious metals are also bearish as they generally have a positive correlation with stocks meaning the two generally move in the same direction.
Precious Metals' Correlations
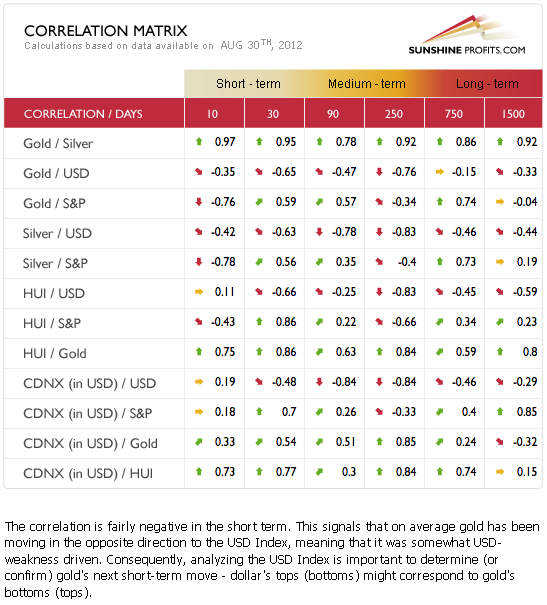
The Correlation Matrix is a tool which we have developed to analyze the impact of the currency markets and the general stock market upon the precious metals sector. The implications for precious metals are once again bearish as the coefficients for the short term and medium term are quite classic once again. This means that the relationship between the USD Index and the precious metals is negatively correlated, whereas stocks generally move in the same direction of the metals and are therefore positively correlated. Up to this point, in this week's Premium Update, we have seen consistent bearish implications across the board (bullish case for USD and bearish for stocks) for gold, silver and the precious metals mining stocks.
Gold
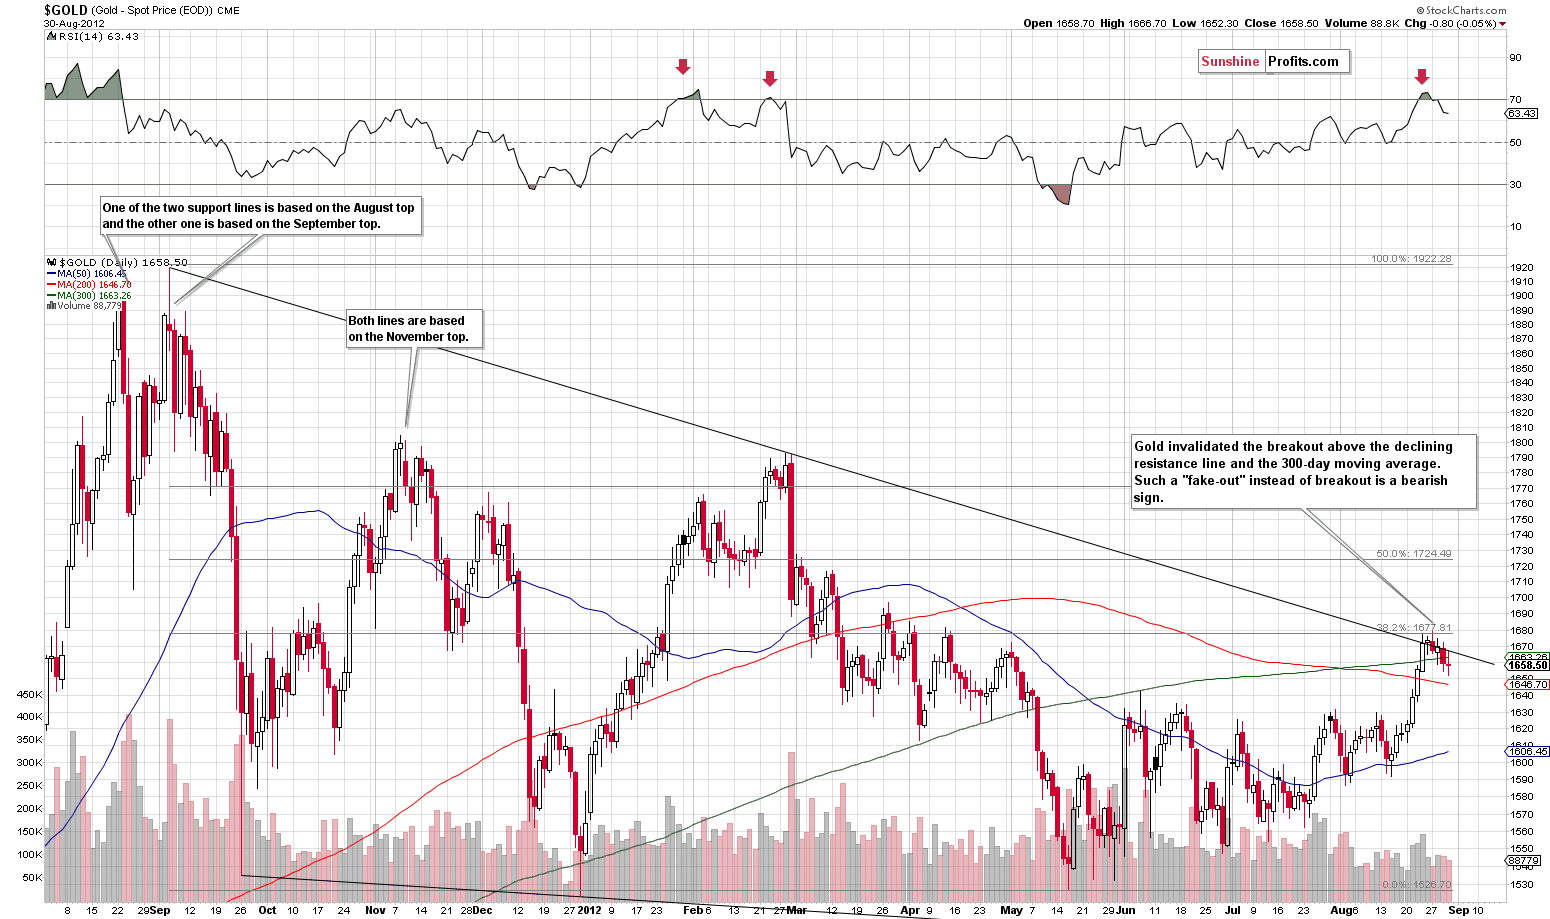
We have omitted gold's long-term picture this week because what was important for the yellow metal on it, can be seen (in greater detail) on the above chart as well. In gold's short-term chart (please click the above chart to enlarge), we see two major support-resistance levels are in play and gold has attempted to break above these levels both last week and this week.
The breakout above the major declining, medium-term resistance line has never been confirmed. Only one close was seen slightly above it (on Friday) and this immediately followed by a decline (on Monday). The price of gold is now visibly below this line and, for two days, gold has closed below the 300-day moving average as well. It seems likely that the breakout above the 300-day moving average is being invalidated as well.
The implications are quite bearish unless a strong move higher is seen to invalidate this view. This is not expected, however, based on the strength of the resistance lines and the bullish situation in the USD Index. In addition, RSI levels appear to confirm that a local top has emerged as well, similarly to what was seen in February.
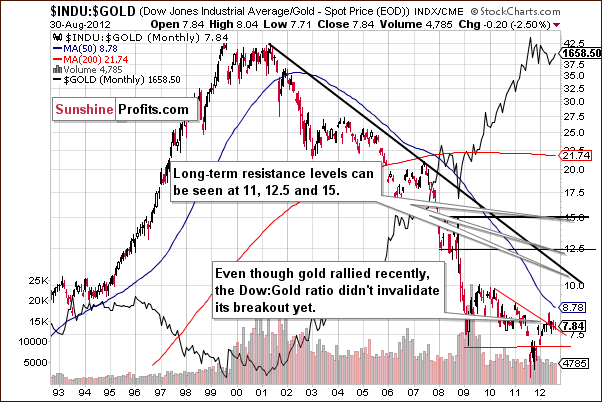
In the Dow to gold ratio chart, no change is seen this week and the breakout above the declining resistance line is still in. The implications remain bearish for gold here.
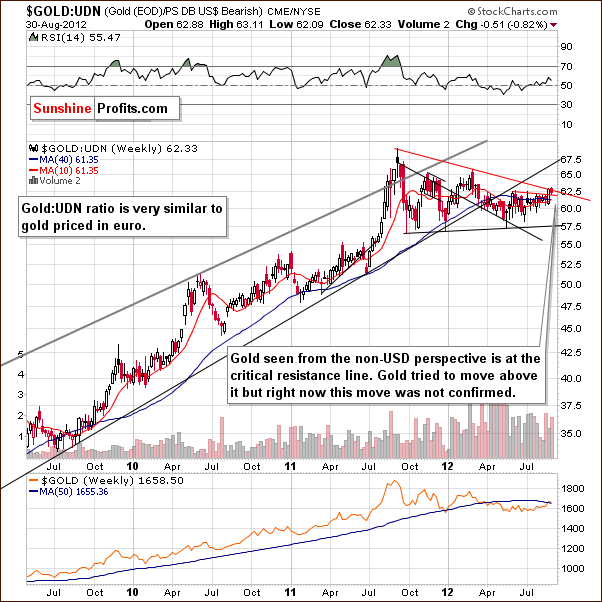
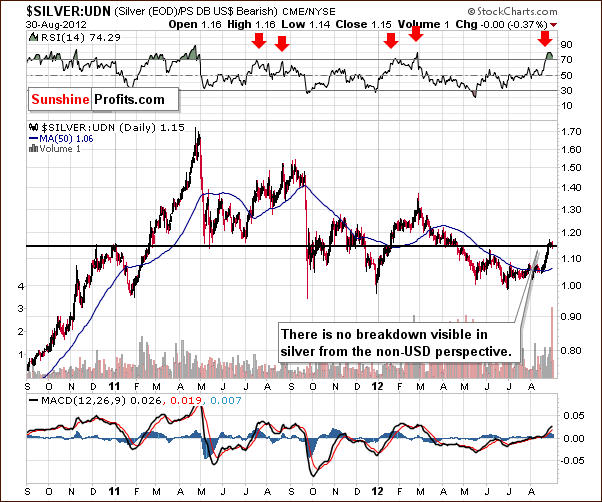
In this week's chart of gold from the non-USD perspective, the outlook is quite similar to what we saw from the USD perspective. The declining resistance line has been hit here but not broken. The implications are bearish and the trend from a non-USD perspective also remains down in the medium term.
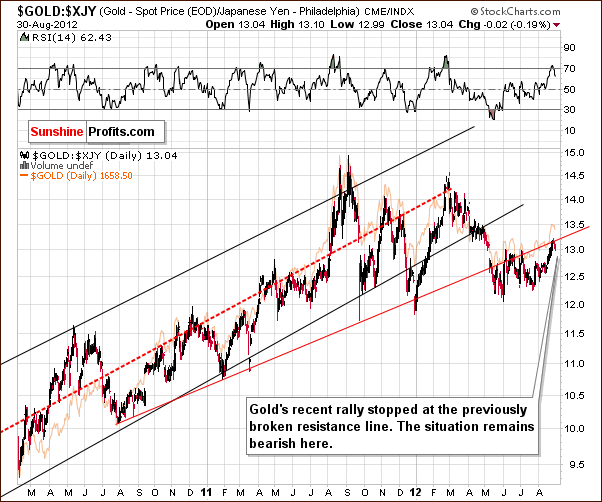
In this week's chart of gold from the Japanese yen perspective, the same holds true and the implications are bearish here as well. The RSI level moved to 70 and then declined which in the past has coincided with local tops, most recently in late February and also in August a year ago.

In the gold to bonds ratio chart, we also see gold's price at a critical level but no breakout has been seen. Since the medium-term trend remains down, one should remain bearish towards the precious metals sector for the medium term.
Summing up, the situation in the precious metals sector has deteriorated this week. Gold has declined to two important resistance levels: the declining resistance line based on recent local tops and the 300-day moving average. The implications are bearish here, based mainly on the current situation and the outlook in the USD index.
Silver
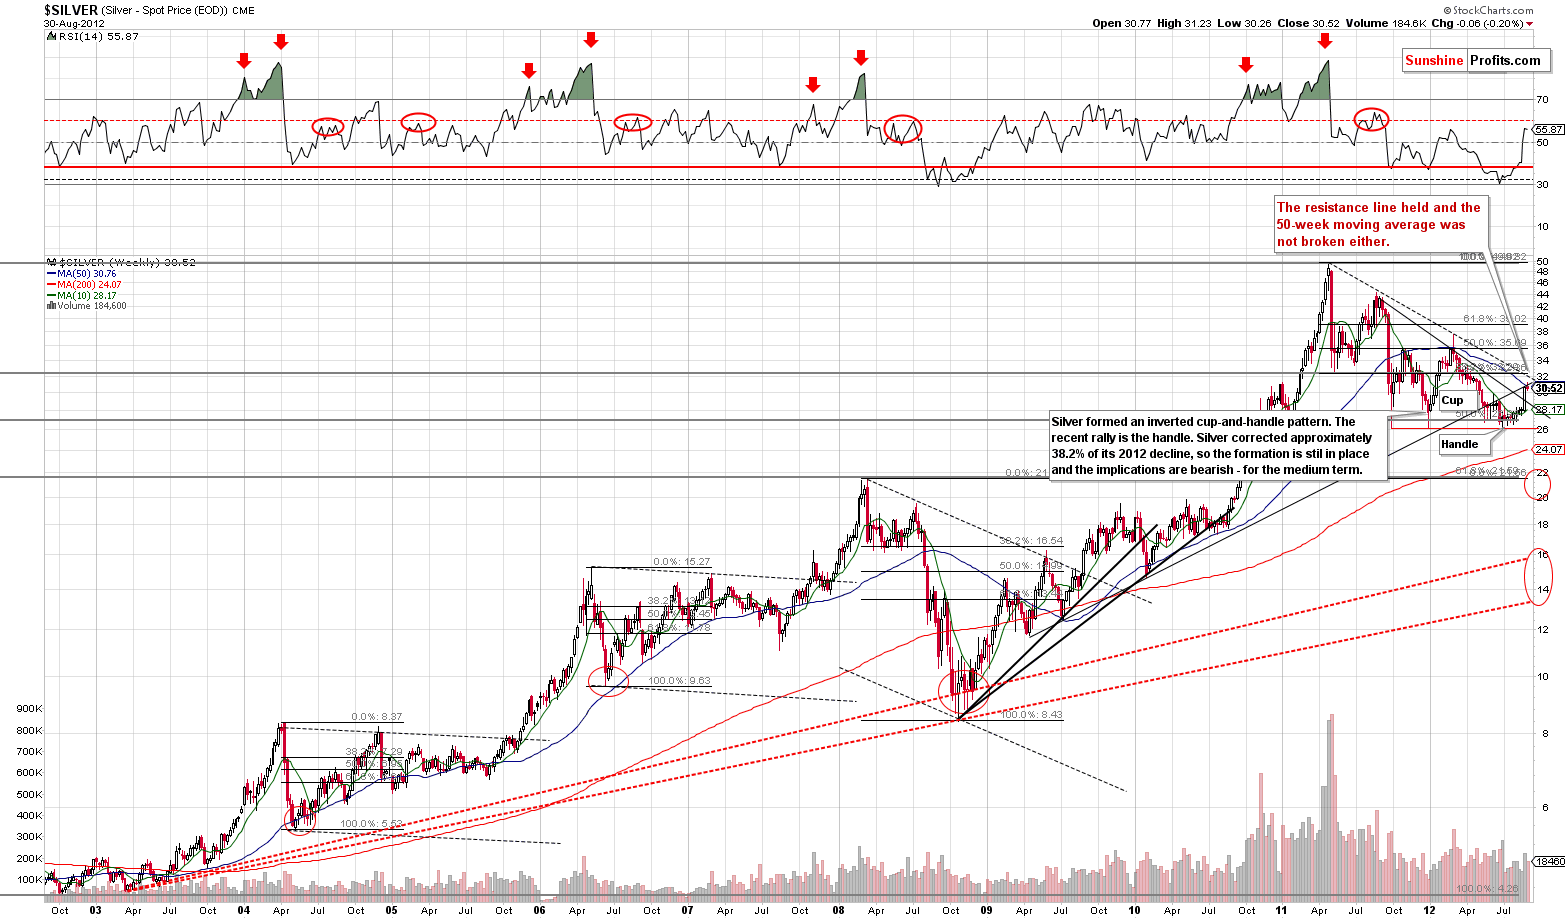
In the long-term chart for silver (please click the above chart to enlarge), we see that a resistance level is being reached. If silver's price declines from here, the bearish head-and-shoulders formation would take shape as seen from the long-term perspective. The inverted cup-and-handle would become head and the right shoulder of the formation. This would also provide a downside target level in the $20-$22 range as we have mentioned a number of times in the past.
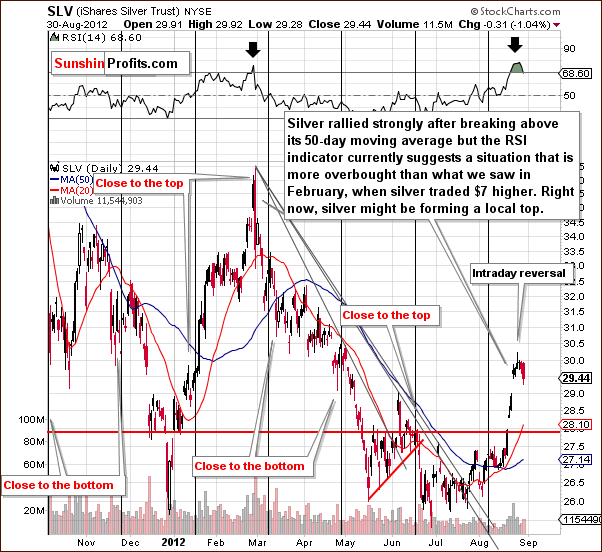
In the short-term SLV ETF chart, a small decline is seen on Thursday and it seems that additional declines are likely to be seen. Small parts of the previous rally have been corrected, but with RSI levels still close to 70, the correction is likely not complete. At this time, an early indication in the short-term chart is that the RSI level is still very close to overbought status. More important factors are seen, however, in the price actions of gold and the USD Index.
In this week's chart of silver from the non-USD perspective, there is not much new to discuss. In the past week, silver did not move above the resistance level based on previous support and resistance levels in the 1.15 trading range and close right at the level on Thursday. The RSI based on silver in this perspective is extremely overbought suggesting that a correction or decline is due.
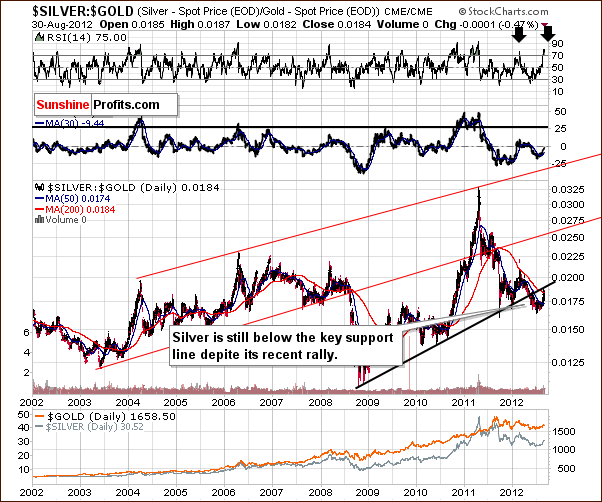
In the silver to gold ratio chart, we see a move to the previously broken support line which is now a resistance line. The breakdown is still verified and the short-term trend is still to the downside, especially when considering the current overbought RSI level.
Summing up, the white metal has not declined significantly so far. Based on its own resistance levels in the long-term chart and the situation with gold and the USD Index, it appears that declines are quite likely to be seen here in the weeks ahead.
Mining Stocks
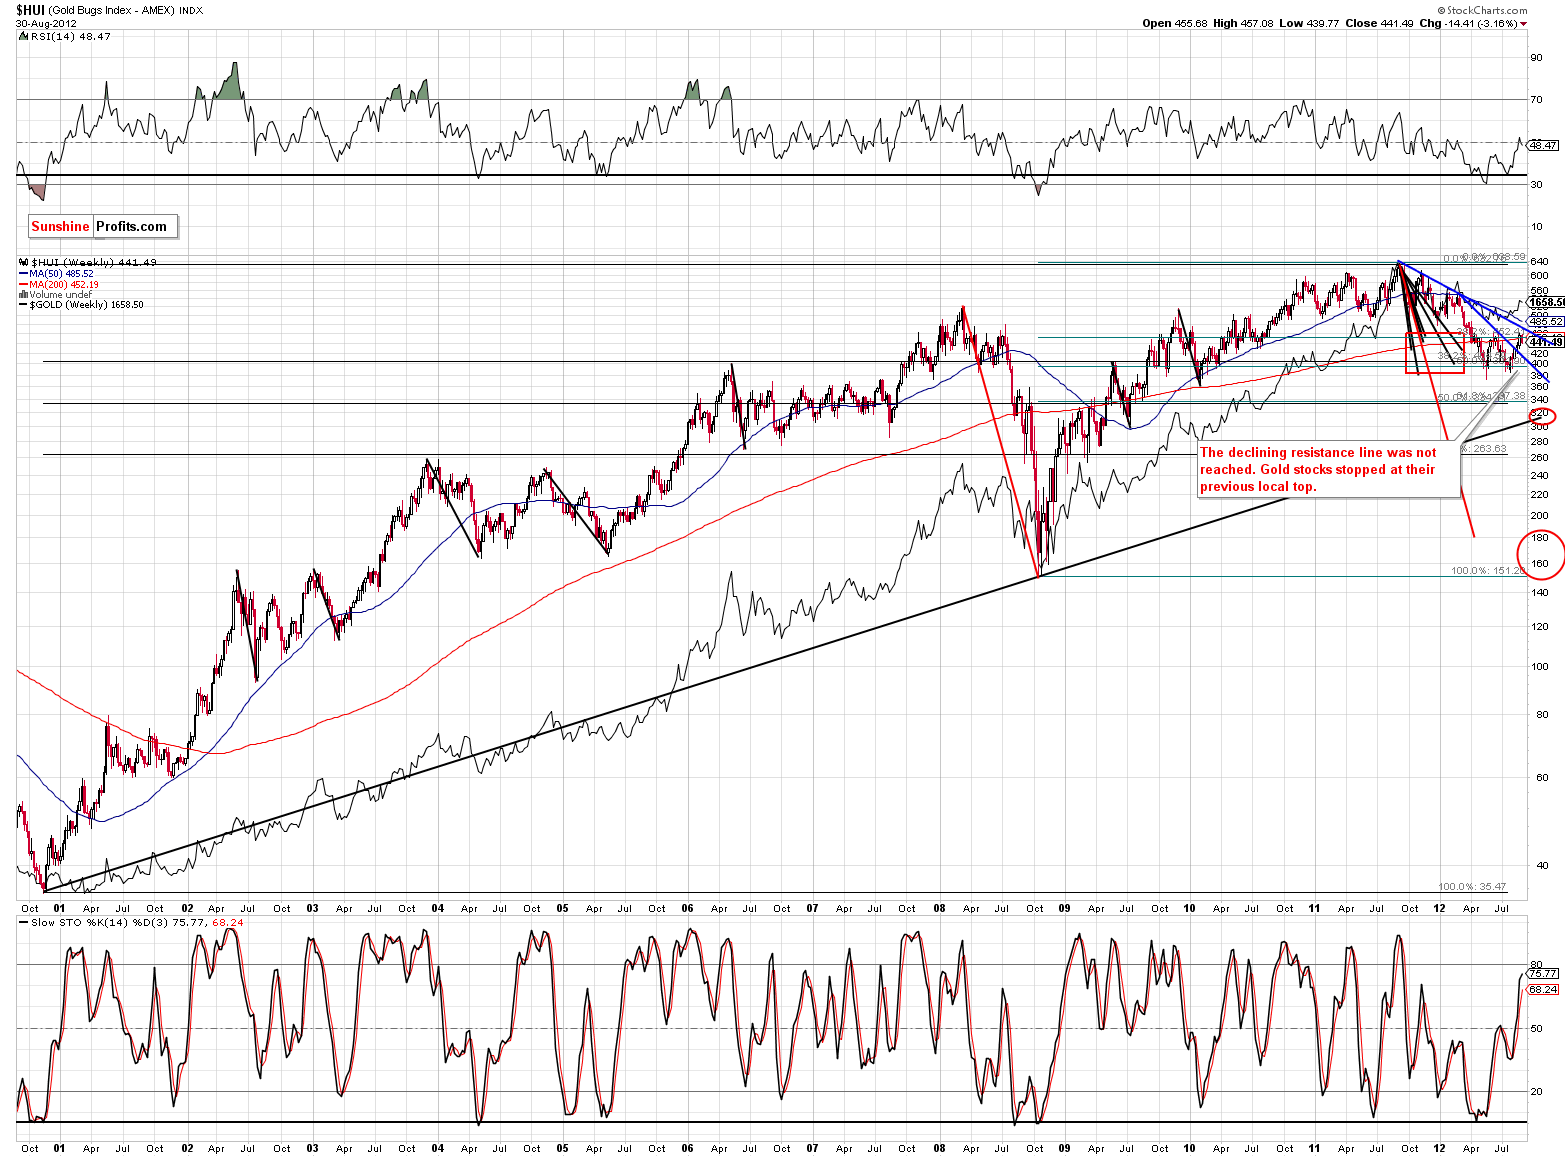
In this week's long-term HUI Index chart (please click the above chart to enlarge), there's not really much new to talk about. Whereas gold prices from the long-term USD and non-USD perspectives reached their declining resistance lines, the miners did not. The suggestion here is that the gold mining stocks are particularly vulnerable if precious metals prices decline.
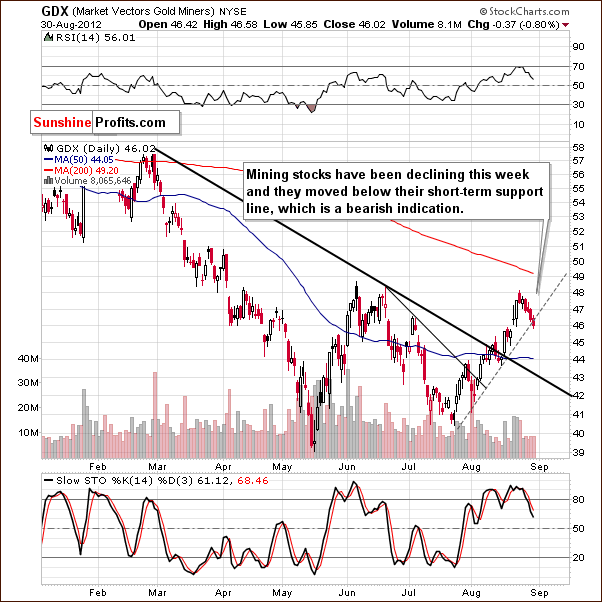
In the GDX ETF short-term chart, we see a breakdown below the rising short-term support line. This is a bearish indicator for the short term; the breakdown is not yet confirmed so it is only slightly bearish right now. Another bearish sign visible here (though indirectly) is that the recent declines seen in the miners are clearly more visible than the recent declines in gold prices. Let’s take a look at the GDX:GLD ratio for more details.
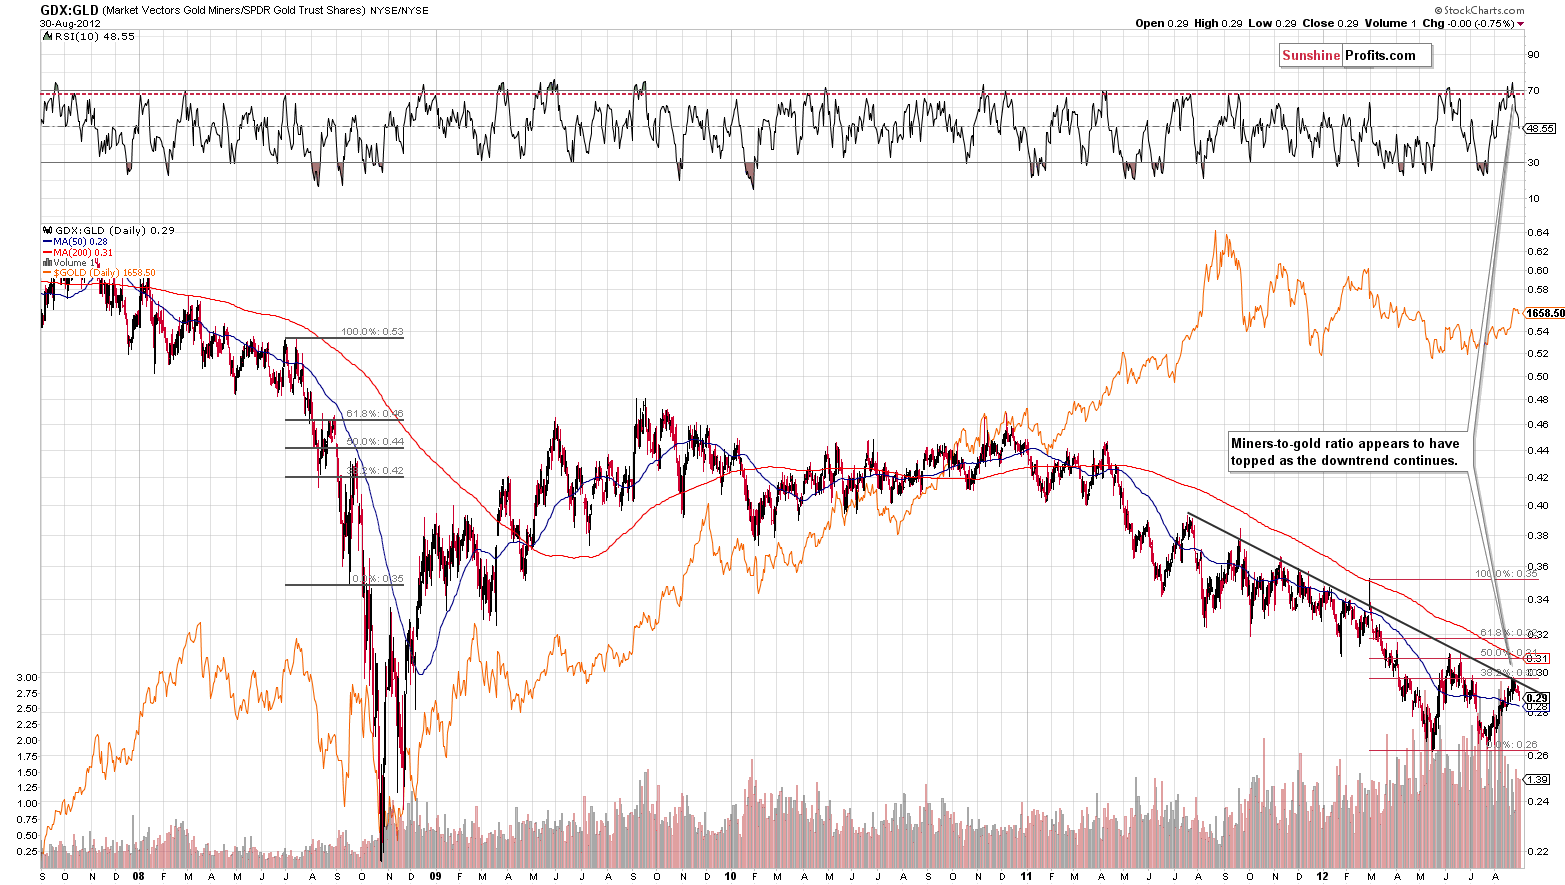
In the miners to gold ratio chart (please click the above chart to enlarge), we do indeed see that declines in miners are bigger than the ones seen in gold – the ratio topped and moved lower. In last week's Premium Update, we stated the following:
The medium-term trend is down and the recent rally here does not change the overall outlook. A short-term overbought status has actually been created, a situation not seen since previous local tops and the final top of 2011 which followed a big rally. The implications are bearish, the trend is likely to reverse, and the miners are likely to underperform the underlying metals in the coming weeks.
This analysis remains accurate and up-to-date this week as well.
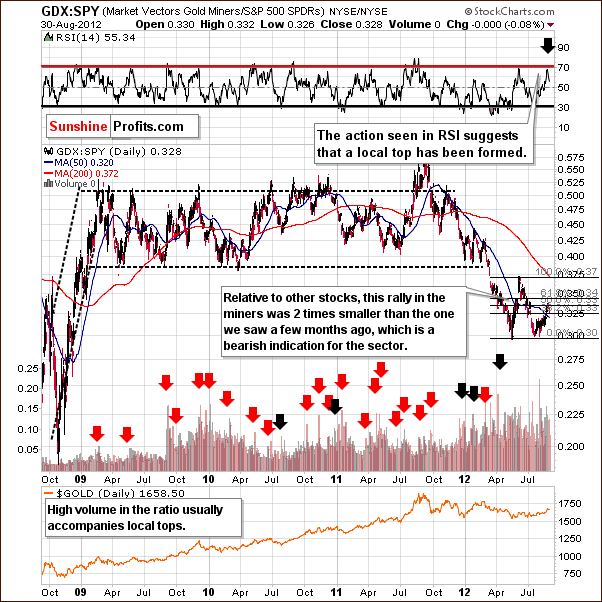
In the miners to other stocks ratio chart, we see a reversal after the RSI level based on this ratio reached the 70 level. This has also been seen multiple times in the past. In fact, we may have already seen the local top here.
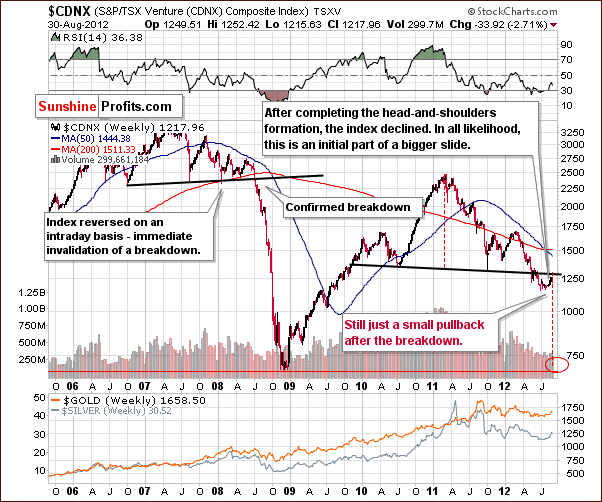
In the Toronto Stock Exchange Venture Index (which is a proxy for the junior miners as so many of them are included in it), we see a correction after a breakdown below the neck of the head and shoulders formation. Please note that the index declined this week – almost 3%. It seems that the downtrend has resumed here and the big declines we have discussed for several weeks could now be underway.
Summing up, the situation is still bearish for the mining stocks in the medium term and odds are for the short run as well. The latter is primarily based on the situation discussed regarding the GDX ETF and the former is based on the situation in gold, USD Index, miners-to-gold ratio and the TSX Venture Index.
Letters from Subscribers
Q&A: We would like to take this opportunity to quote a letter that we received recently - about the long-term potential of the silver market. Please note that it does not confirm nor invalidate the bearish medium-term case for silver and it doesn't relate to silver's short-term performance at all. It simply implies that silver will likely be much higher than it is right now in a few years - with which we agree.
I traded silver during 1979-80 and know too well that silver was initially manipulated by the Hunt brothers, who initially purchased contracts in silver clandestinely. The brothers didn't purchase all their contracts from the same source in an effort to not alert the market of their objective, which was to corner the silver market. When word got out about what the Hunt brothers were up, silver began to soar.
Not only did the large mines sore at that time, but the small mines as well.It was the small mining stocks that evaporated when silver later tumbled.
The hype among precious metal investors at that time was screaming, for lack of a better word.The hype today is nowhere near what it was in 1979-80. When you compare the amount of speculation in gold and silver now to what it was in 1979-80, one has to draw some kind of a parallel between the two time periods. With this in mind, I am forced to draw the conclusion that silver is underpriced at this time.It was the Carter Administration, with a gigantic margin increase, that brought on the demise of both the silver and gold prices and the Hunt brothers.
If you now take into consideration the value of the dollar, the increase in labor costs, gasoline, transportation, financing, the increased industrial applications of silver and the touchy situation of labor unrest in the countries that are the major producers of silver, just to name a few, I strongly feel silver is underpriced at this time. There are still some major players in silver that are still short in big terms that are keeping this market suppressed.
Q: Could you please comment on the article from Zeal about the COT report? I would find your views on this most interesting:
http://www.321gold.com/editorials/hamilton/hamilton082412.html
Thanks.
A: We agree that the COT report indicates that the gold market is oversold from the long-term perspective. However, we currently view this as no different than an indication from a really long-term RSI indicator or another momentum indicator based on a long-term chart. This type of analysis works very well as a confirmation of an ongoing trend. The "problem" right now with this type of analysis is that gold has actually broken below its long-term support line at the end of 2011 and is now in a medium-term downtrend. It has also broken below its 300-day moving average. This implies that while the situation is oversold, it may become much more oversold in the following weeks. The positions visible in the COT report may become more prominent and the situation more extreme - which would accompany gold below $1,500.
Q: A couple of questions:
(1) I was obviously very interested to read the comments from your reader Roger regarding the Correlation Matrixes. Where do I find these and are there instructions as to how to use them? We would all like to pick up ‘a quick $300,000’!
(2) I am not a day trader – more of a weekly trader if there is such a thing. I certainly rely very heavily on your advice before I commit. I try to trade both gold and silver. The latter not as much as it is so volatile and has hurt me a number of times now. However, the issue for me is this: you are definitely a gold and silver bear right now and have been for a few weeks. I have been waiting for the fall in both gold and silver. Nothing yet and I am frustrated. Gold on August 20th was trading around $1613 and a week later trading on the 27th at $1672 and even now as I write is around $1667. Similarly with silver - $2790 on August 20th, and $3116 on August 27th, and this morning sitting at $3073. I have obviously missed a very good week of profitable trading. I just do not understand why the gold and silver markets have performed so bullishly at the time your readings are clearly bearish. Maybe when you say long-term capital should be on ‘hold’, a reader like me should not expect you to advise on short-term capital, which I continue to have on ‘hold’?
Please understand I am nowhere near the same intellectual league as you – your technical charts and your readings are in a class of their own and you and your team are highly skilled and brilliant people in your chosen fields. I am not, which is why I rely on your advice to the extent that I do and I really do need to understand the Correlation Matrixes and I really do need to understand your short-term analysis of the gold and silver markets. From the 20th to 27th of August big money could have been made and I was just a very frustrated spectator, with no clue right now what to do.
A: Let's start with the second point. We understand and agree that the situation in the precious metals market is disturbing. It has not been doing anything from a long-term perspective in many months and from a short-term perspective it has been driven by the USD Index that recently declined against its main medium-term trend. Unfortunately, such declines are very tricky. One of the Wall Street's sayings is that “the trend is your friend,” meaning that one should bet along with the current trend. Well, in this case, the trend in the USD Index is up, and this makes the case bearish for gold. Unfortunately, the Dollar Index declined in the past few weeks - even though the trend remained up. Betting against this trend (meaning betting on higher metals prices) was risky. Metals rallied, true. The market doesn't always do what one wants especially immediately. Unfortunately, we put too little weight to our effective SP Extreme indicator when it signaled a local bottom several weeks ago.
We know that there were many articles on the Internet that said that gold will go up – it's practically always the case that most precious metals analysts say that the sector will move higher. Currently, this might make us look bad because of our reluctance to move back to the very bullish camp (note: we are bullish in the long term). Please note that those who say that gold and silver can never decline significantly will most likely not be able to warn you when that time does indeed come. You might doubt if they say that gold is at a top if a major top is formed. We simply don't hesitate to call things exactly as we see them and this time we see the medium-term in precious metals as down - because it has not been invalidated so far. And the opposite is the case for the USD Index.
The important point going forward is that the trend in the USD Index remains up in the medium-term and the critical support levels held.
As far as long-term capital and speculative capital are concerned, we view them as separate parts of one's portfolio. The former is the part that you invest for the long run (and keep invested for many months) and the latter is something that is used as a base for your trades - you use only a part of this capital for each (weekly, in this case) trade. We are currently working on a big essay that will deal with portfolio structuring. It should make this much clearer.
As far as the first point is concerned, you will find more information about the Correlation Matrix on our website and the tool itself is easily accessible from the main menu under the Tools -> Correlation Matrix.
You can also hover your cursor over any part of the matrix and read the description below it. It is updated automatically each day based on changes in the numbers in the matrix.
The Correlation Matrix is a great concept, but it does not provide direct buy and sell signals, and it is not always easy to use because one needs to combine it with an analysis of either the USD Index or the general stock market.
At this point we need to digress a bit as we're so excited about what's in the pipeline! Soon after the release of the new website we'll start rolling out new tools that provide direct buy and sell signals, and don't require a degree in Finance to use. There will be instructional videos as well. During the testing stage, we've been amazed by the results they deliver. The final tests are being conducted right now - we want to be absolutely sure that they provide stable, high-quality signals. I can't tell you more at the moment, but you'll see a whole bunch of great stuff coming in sooner than you may think.
Summary
The situation in the precious metals markets remains bearish. The most important factor is the situation in the USD Index, which is in a medium-term uptrend. The key support lines are right below the current value of the USD Index and cyclical turning point suggests that a rally is about to begin. This is a very bullish combination and there is a high probability of a rally in the USD Index in the coming weeks. If it does indeed develop, it will likely put bearish pressure on the whole precious metals sector.
Both the Toronto Stock Exchange Venture Index and the ratio of mining stocks to gold indicate that the mining stocks may actually be affected to a greater degree than any part of the precious metals sector. We continue to believe that betting on lower mining stock prices with speculative capital is a good idea and being partly out of precious metals with long-term capital also appears to be justified at this time.
Thank you for using the Premium Service. Have a profitable week and a great weekend!
This completes this week's Premium Update. Your editor will be on vacation next week, so our next Premium Update is scheduled for Friday, September 14, 2012. A Market Alert / Message will be sent and published no later than on Monday, September 3rd, to update you on the market conditions and to present preferred ways of reacting to the possible scenarios for the days to follow. Similarly, we will send out and publish a Market Alert / Message as soon as possible in the following week – most likely on Wednesday.
While I (PR) will be diving in the waters of Egypt, it seems that precious metals prices are quite likely to be doing the same. I will strive to obtain the Internet access and check what's going on on a daily basis, but I can't guarantee that I will be able to send out a Market Alert between this and the next Tuesday. However, since I will provide you with a list of preferred actions to various situations that might take place during that time, you will how to react whatever happens next week. Meanwhile, the rest of the SP Team will be working normally (actually more than normally as we are finalizing preparations for new website's launch).
Przemyslaw Radomski

