

Yesterday, there was a massive U.S. economic data dump. What does the release of several reports imply for the gold market?
Yesterday morning was full of U.S. economic reports. First of all, retail sales declined 0.3 percent in August. It was the first negative reading since March. The drop was larger than expected and it was driven mainly by disappointing sales of motor vehicles. However, hardly any retail segments did well last month. On an annual basis, retail sales increased 1.9 percent, while retail sales excluding motor vehicles rose 2 percent. As one can see in the chart below, the annual pace of growth of retail sales slowed down from April.
Chart 1: Retail and food services sales (blue line) and retail and food services excluding motor vehicles and parts dealers (red line) as percent change from year ago, from August 2011 to August 2016.
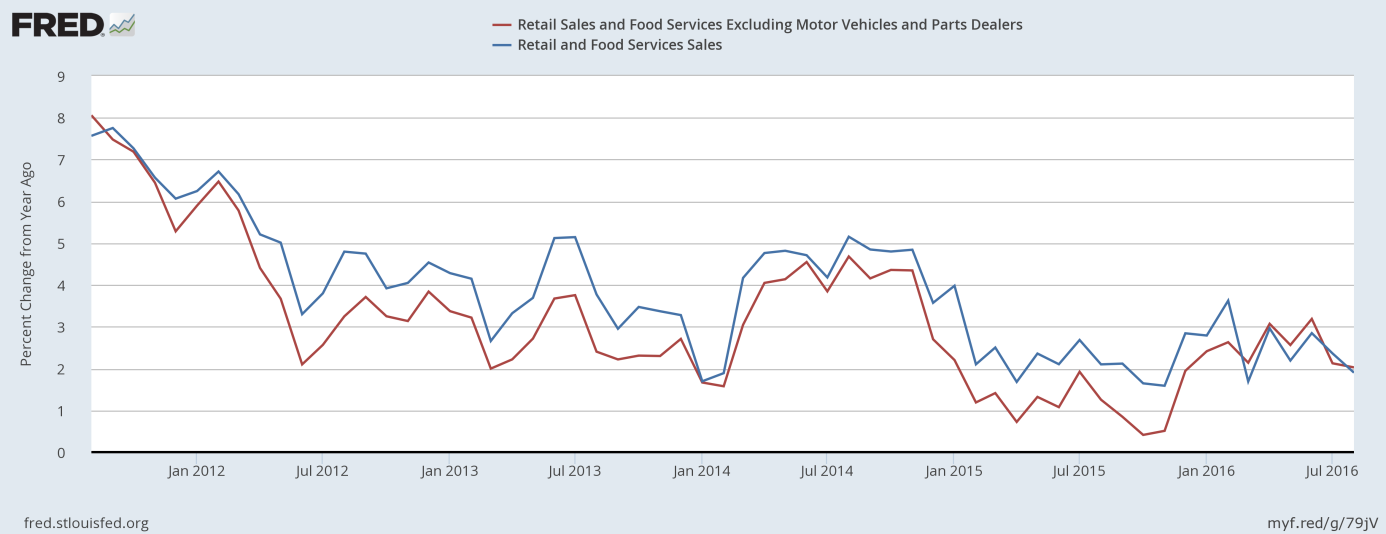
The report is a sign that economic growth in the third quarter might not be as strong as previously estimated. Indeed, the GDPNow model forecast for real GDP growth in the third quarter of 2016 declined to 3.0 percent from 3.3 percent after the retail sales report. Therefore, it should strengthen the doves’ case for not hiking interest rates this month. Indeed, the probability of a September rise declined to 12 percent from 15 percent the day before, according to the CME Group FedWatch.
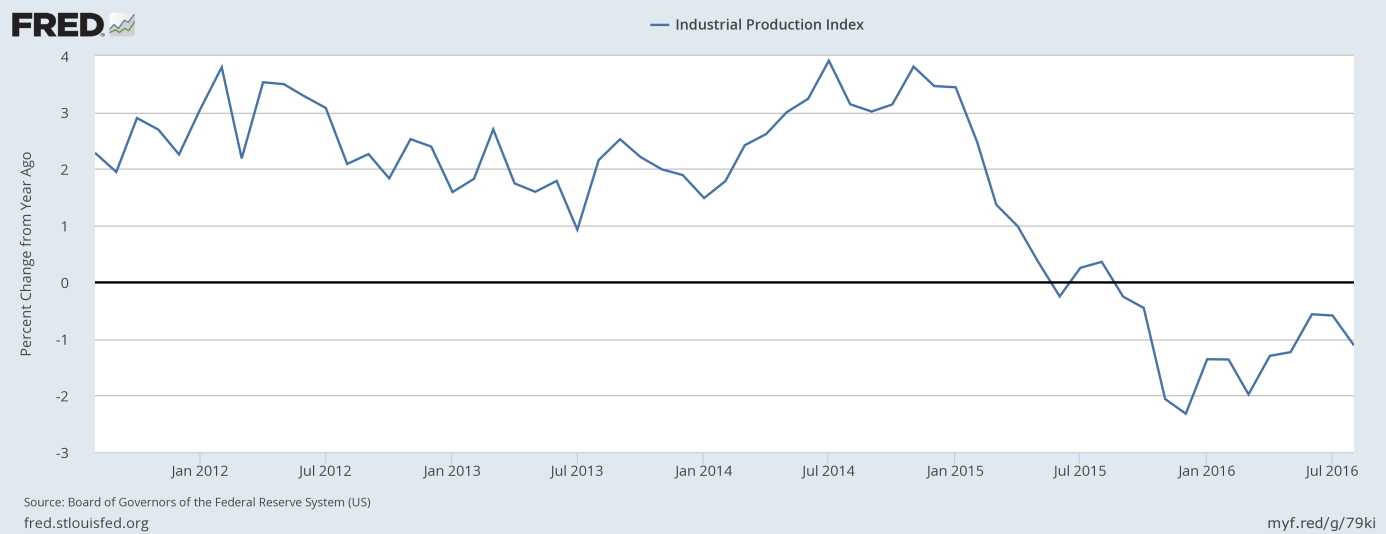
Weak retail sales were not the only negative economic data released yesterday. Industrial production fell 0.4 percent in August, according to the Fed. It was the largest decline since March. On an annual basis, the U.S. factory sector contracted 1.1 percent, as one can see in the chart below. It implies that the American industry still faces strong headwinds.
Chart 2: Industrial production (as percent change from year ago) from September 2011 to September 2016.
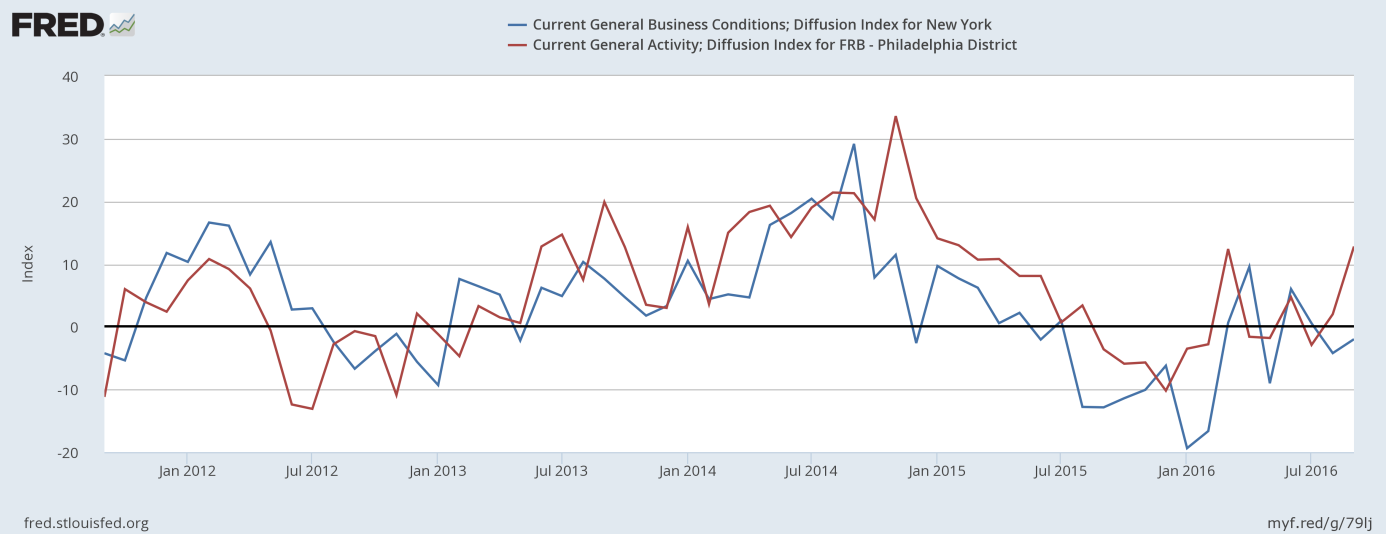
Moreover, the Empire State Manufacturing Index, which measures conditions in the New York area, remained in negative territory, but inched up from a negative 4.2 in August to a negative 2 in September. The reading was lower than expected.
Despite all of these negative pieces of news, the price of gold declined initially after the releases. It may suggest some weakness in the gold market, as the shiny metal has recently seemed to be unable to react to positive news. However, the selling pressure in the gold market yesterday morning could be explained by the investors’ focus on the Philadelphia Fed’s Manufacturing Index (it measures conditions in the Philadelphia region), which jumped to 12.8. The index surprisingly surged 10.8 points, as one can see in the chart below. The report may strengthen the camp of U.S. monetary policy hawks, who want to see an interest rate hike sooner rather than later.
Chart 3: The General Business Conditions Index in the New York area (blue line) and the Current General Activity for the Philadelphia District (red line) from September 2011 to September 2016.
To sum up, yesterday’s U.S. economic data was rather negative, as retail sales and industrial production declined, while the Empire State Manufacturing Index remained in negative territory. However, the marketplace appeared to focus on the Philadelphia Fed Index which showed a surprising improvement in September from August. Consequently, the price of gold declined in mid-morning to about $1,310 from about $1,326. For us, it is a bit surprising, since the disappointing retail sales lowered the forecast for GDP growth and the market odds of the rate hike in September. Therefore, we cannot exclude some rebound in the near future. If it does not happen, it will indicate a weakness in the gold market.
If you enjoyed the above analysis, we invite you to check out our other services. We focus on fundamental analysis in our monthly Market Overview reports and we provide daily Gold & Silver Trading Alerts with clear buy and sell signals. If you’re not ready to subscribe yet and are not on our mailing list yet, we urge you to join our gold newsletter today. It’s free and if you don’t like it, you can easily unsubscribe.
Disclaimer: Please note that the aim of the above analysis is to discuss the likely long-term impact of the featured phenomenon on the price of gold and this analysis does not indicate (nor does it aim to do so) whether gold is likely to move higher or lower in the short- or medium term. In order to determine the latter, many additional factors need to be considered (i.e. sentiment, chart patterns, cycles, indicators, ratios, self-similar patterns and more) and we are taking them into account (and discussing the short- and medium-term outlook) in our trading alerts.
Thank you.
Arkadiusz Sieron
Sunshine Profits‘ Gold News Monitor and Market Overview Editor
Gold News Monitor
Gold Trading Alerts
Gold Market Overview

