

-
Gold Daily News: Monday, May 11
May 11, 2020, 9:57 AMThe gold futures contract lost 0.69% on Friday as it continued to fluctuate along $1,700 price level. Gold is still trading within a flat correction following April's advance. On April 14 it was the highest since November of 2012 and the high was at $1,788.80. Since then we've seen some profit-taking action and a potential downward reversal.
-
Will the Great Fundamental Disconnect Make Gold Shine?
April 28, 2020, 4:58 AMThe economic data are depressing, yet the stock market seems unmoved. Will gold take the incoming news in its grace?
Will We Win This War With Coronavirus?
Yes, of course, we will win! People are smart and creative beings. The number of scientific articles on COVID-19 is increasing all the time, while the scope of cooperation between scientists from around the world is unprecedented.
However, our triumph may occur later than the markets think. On Thursday, the stocks market fell on the Chinese remdesivir trial report that Gilead Science's experimental antiviral drug did not improve patients' condition or reduce the pathogen's presence in the bloodstream. The drop in equities clearly shows that investors become delusional and that the recent rally in the stock market is based on hopes that the pandemic is a very temporary shock after which we will see a V-shaped recovery.
As we explained several times, such hopes are unlikely to materialize. Why? First, our knowledge about the coronavirus is still limited. And there are important downside risks. For example, Japan and Singapore face now the second wave of infections. Meanwhile, the recent study shows that coronavirus' ability to mutate has been vastly underestimated. The really frightening point is that the most aggressive strains of the coronavirus could generate 270 times as much viral load as the least potent type, which could explain the death toll in the New York. The virus' ability to mutate is a real obstacle to develop a successful vaccine.
Second, although the US epidemiological curve has flattened somewhat, it remains steeper than for other countries - and the epidemic is far from over. As the chart below shows, although the country could pass the peak in daily deaths, the total number of confirmed cases still shows exponential dynamics.
Chart 1: Total confirmed cases and deaths from COVID-19 in the US from January 22 to April 23, 2020
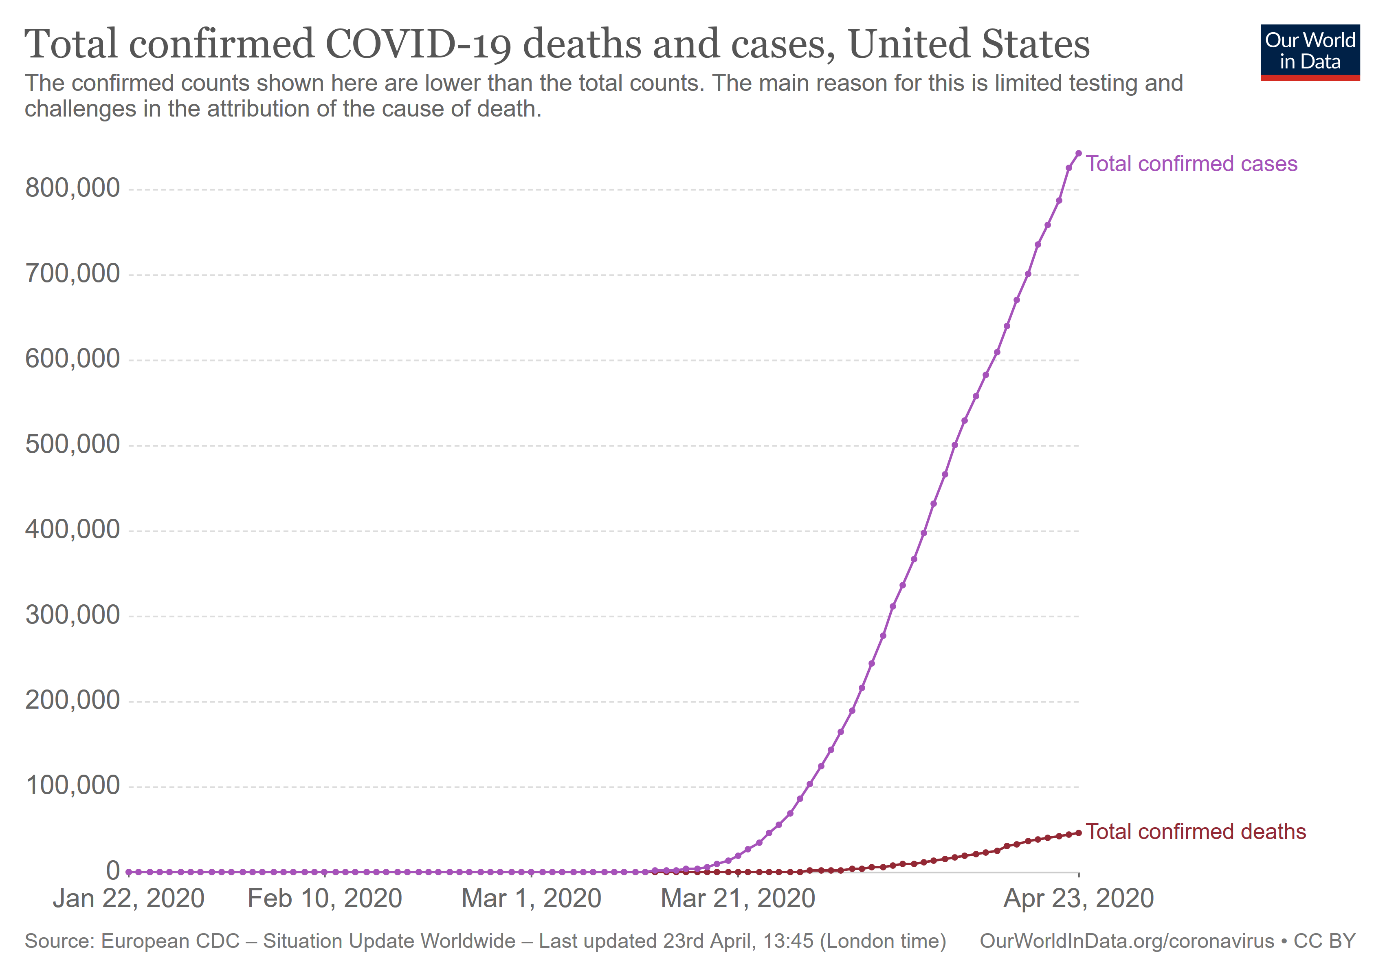
As one can see, the total number is more than 840,000, while the total confirmed deaths are almost 47,000, which means that the simple case fatality rate is above 5 percent! It does not look like a seasonal flu, does it? Of course, the time lag (the virus incubation period is assumed to be up to 14 days) increases the true mortality rate (as some of the current patients will die later), but on the other hand the unconfirmed cases decreases the true mortality rate. What is the true number nobody knows, so for simplicity I decided to keep with the widely cited CFR.
What is more, The Economist shows that the official covid-19 death tolls still underestimates the true number of fatalities, as they exclude anybody who did not die in hospital or who did not test positive, or who were killed by other conditions that could not be treated successfully because of the overwhelmed hospitals.
The Great Fundamental Disconnect
Moreover, the corporate earnings are only expected to decline by 10 percent in the Q2 2020, although we experience the most severe recession since the Great Depression. Surely, the stock market is not an economy and the stock market does not care what people believe it should do, but the fundamental disconnect is puzzling. Yes, the stock market is forward-looking, but it does not mean that its expectations are always correct - after all, in early February, it did not expect the global pandemic and lockdown. JP Morgan has recently warned that given the expected decline in GDP by about 10 percent in Q2, corporate profits could decline as much as 70 percent. The Fed supports the Wall Street, but gold investors should be prepared that declines in stock prices are possible. We could see then some selloff in the gold market, but the safe-haven demand for gold should strengthen.
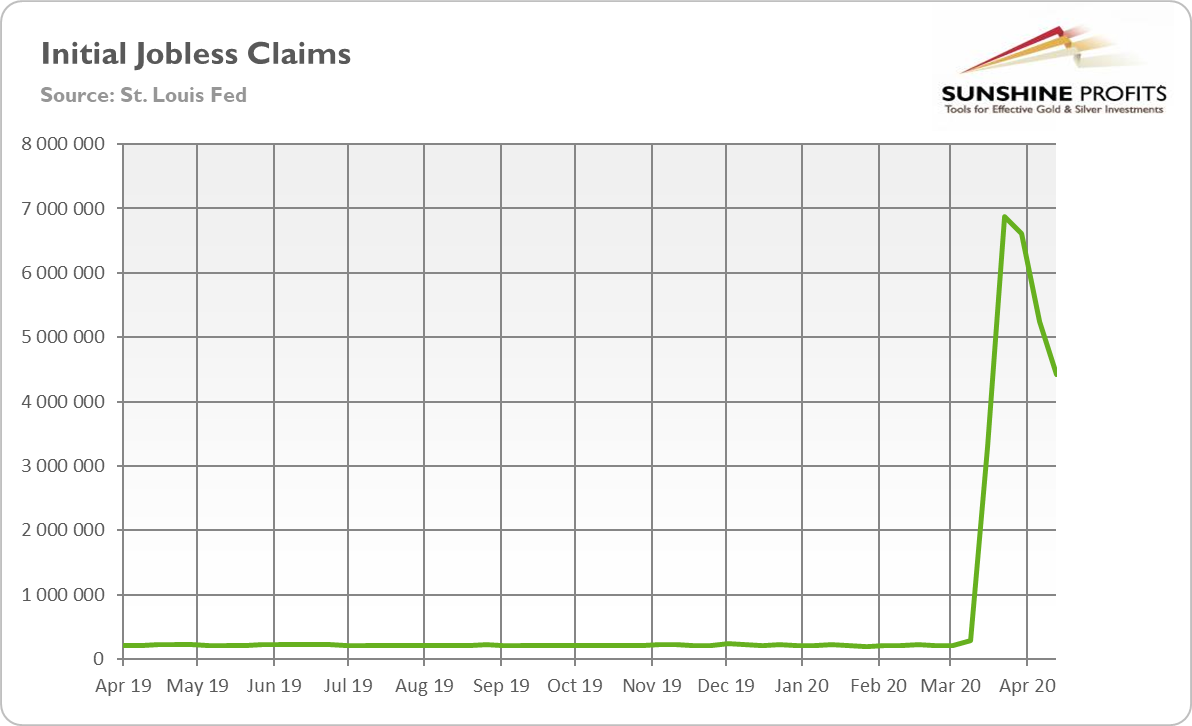
The disconnect is really intriguing. Please look at the chart below, which shows the updated numbers of the jobless claims. As one can see, between April 11 and April 18, 4.4 million of Americans lost their jobs. It seems that since the beginning of the crisis, 26.5 million of people filed for the unemployment benefits. Assuming that no one dropped out from the labor market, the implied unemployment rate is about 24 percent, the level seen last time during the Great Depression. So, isn't the recent stock market rally a bit suspicious?
Chart 2: Initial jobless claims in the US from April 6, 2019 to April 18, 2020
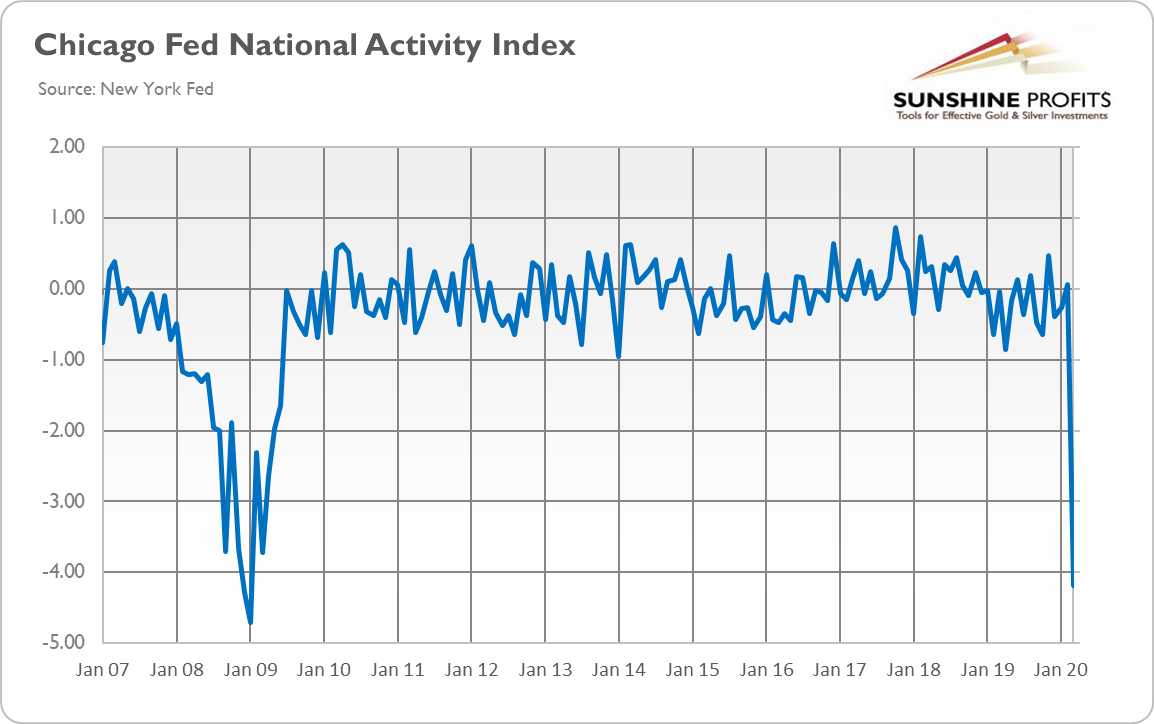
Moreover, the US flash services PMI fell from 39.8 in March to 27, a record low, while the manufacturing PMI declined from 48.5 to 36.9, the lowest level in 11 years, as the Great Lockdown crashed business activity. Last but not least, as the chart below shows, Chicago Fed National Activity Index declined to -4.19 in March, the lowest level since January 2009. And April will be even worse!
Chart 3: Chicago Fed National Activity Index from January 2007 to March 2020
Implications for Gold
What does it all mean for the gold market? The current economic data are really depressing. At the same time, the stock markets seemed unmoved. However, we think that there could be a correction in the equity valuations. If this happens, gold may initially be hit, but it should eventually emerge as a great beneficiary from this turmoil.
Anyway, even without the further declines in the stock market (upside risks also exist after all - we listen to both sides of the story at Stock Trading Alerts), gold should shine this year due to the recession, high indebtedness and dovish central banks. By the way, on Wednesday, the FOMC will publish its newest monetary policy statement, while Powell will hold the press conference - both events could affect the markets. Given the circumstances, the Fed is likely to please the Wall Street and deliver the dovish message, which should benefit the gold prices.
If you enjoyed today's free gold report, we invite you to check out our premium services. We provide much more detailed fundamental analyses of the gold market in our monthly Gold Market Overview reports and we provide daily Gold & Silver Trading Alerts with clear buy and sell signals. In order to enjoy our gold analyses in their full scope, we invite you to subscribe today. If you're not ready to subscribe yet though and are not on our gold mailing list yet, we urge you to sign up. It's free and if you don't like it, you can easily unsubscribe. Sign up today!
Arkadiusz Sieron, PhDSunshine Profits - Effective Investments Through Diligence and Care
Gold News
Delivered To Your Inbox
Free Of Charge
Bonus: A week of free access to Gold & Silver Trading Alerts
Gold Alerts
More-
Status
New 2024 Lows in Miners, New Highs in The USD Index
January 17, 2024, 12:19 PM -
Status
Soaring USD is SO Unsurprising – And SO Full of Implications
January 16, 2024, 8:40 AM -
Status
Rare Opportunity in Rare Earth Minerals?
January 15, 2024, 2:06 PM
Dear Sunshine Profits,

