
Based on the January 10th, 2014 Premium Update. Visit our archives for more gold articles.
In our previous article on gold, we examined the situation in the U.S. dollar and the euro as many times in the past they gave us important clues about future precious metals’ moves. At that time we wrote in the summary:
(…) gold's lack of will to really (!) react to positive news, like the dollar's huge intra-day drop, is a bearish piece of information on its own and an indication that gold is likely to move lower in the short run.
On the next trading day, after the essay was posted, gold and silver declined and dropped to their fresh monthly lows. With this downward move gold almost touched the June low. This strong support level encouraged buyers to push the buy button and the yellow metal, which last week saw its best week since October, rebounded to around $1,250. At the same time, silver came back above $20.
Will the recent week’s rally continue? Before we try to answer this question, we’ll examine the long-term charts of gold and silver to see if there’s anything on the horizon that could these precious metals higher or lower in the near future. We’ll start with the long-term chart of gold (charts courtesy by http://stockcharts.com).
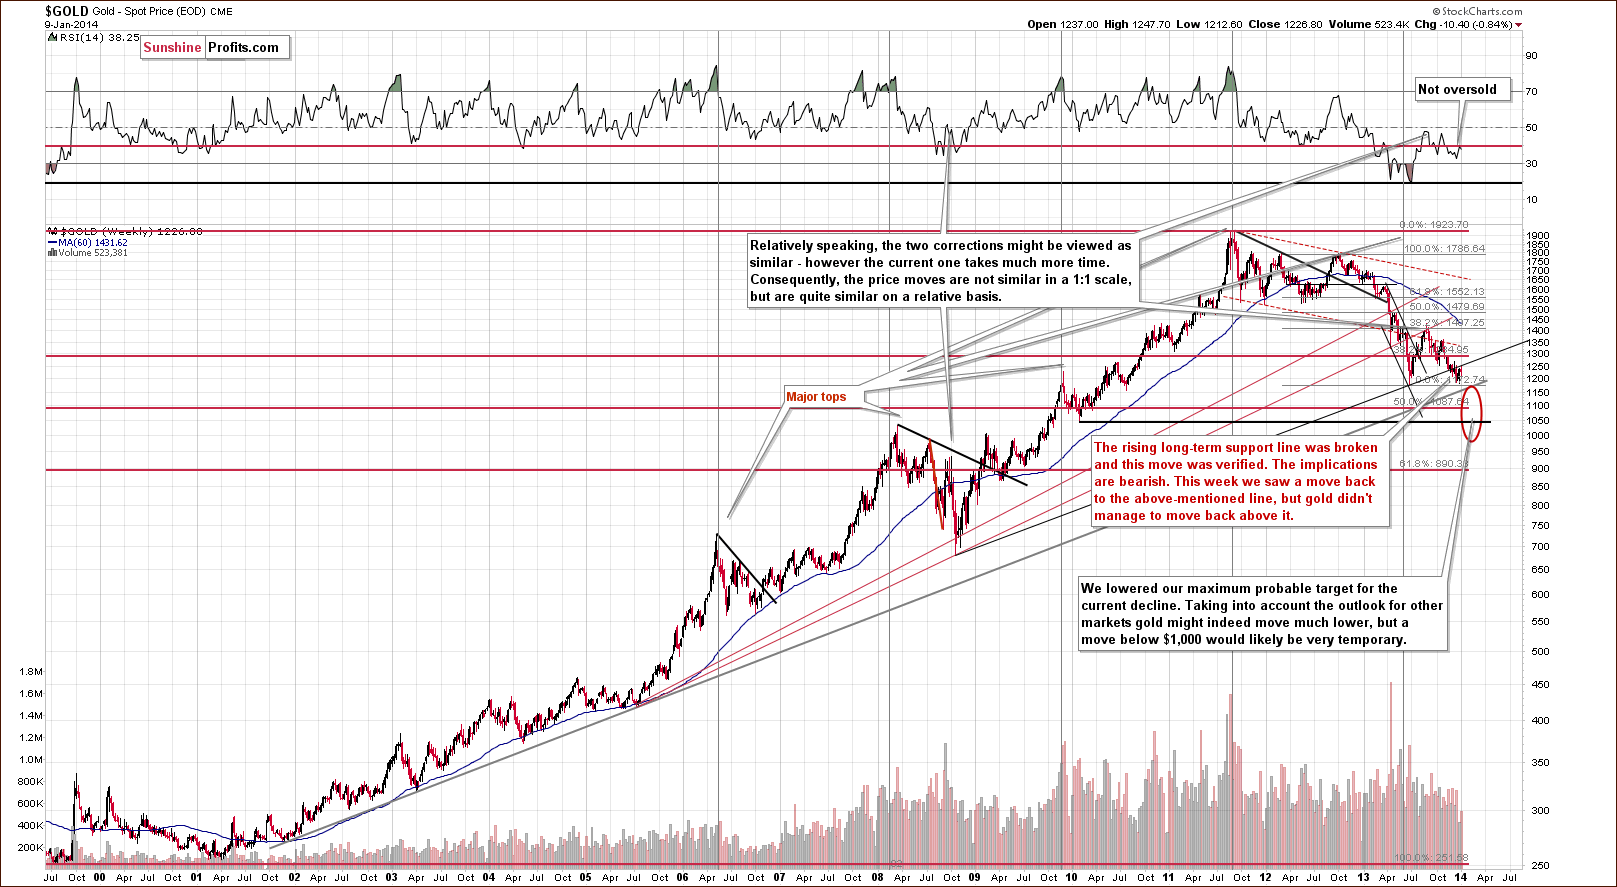
Even though a lot happened last and this week, from the long-term perspective not much changed on the gold market.
We saw a move back to the rising long-term resistance line (currently close to $1,250), but gold only touched it, only to decline once again. At this time the medium-term outlook remains bearish. Any additional rally is not likely to move significantly above this level (from this perspective significantly means not more than $50 above it, which takes significant intra-day volatility into account).
Our previous essay on gold we wrote the following:
Please note that the exact target for gold is quite difficult to provide. In the cases of silver and mining stocks there are respectively: combinations of strong support levels, and a major support in the form of the 2008 low. In the case of gold, there are 4 support levels that could stop the decline and each of them is coincidentally located $50 below the previous one starting at $1,150: $1,150, $1,100, $1,050, and $1,000.
Taking into account the current situation in the yellow metal, the above price targets remain valid.
Let’s take a look at the chart featuring gold’s price from the non-USD perspective.
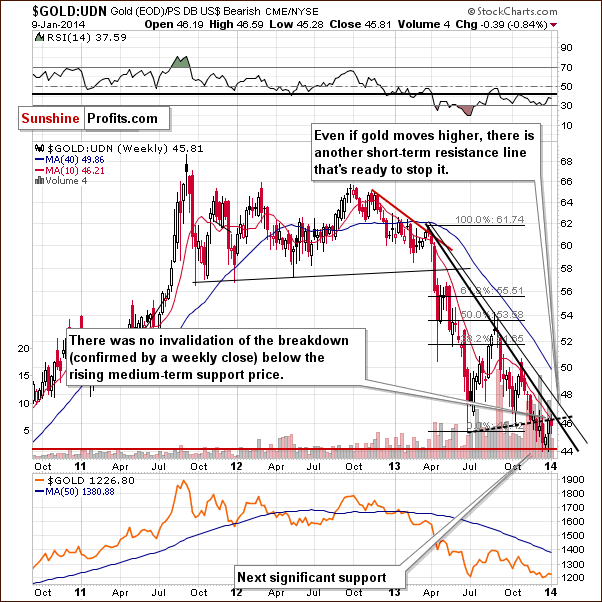
From the non-USD perspective, gold simply moved back to the previously broken support line and verified it as resistance. There was only an intra-week move above it, but the price is already back below the line, and it seems that it will close the week below it as well. Please note that in the final part of 2013 we also saw one intra-week move back above this line and this move was even more significant than what we saw this week. It too didn’t invalidate the breakdown. In fact, it was followed by a significant downswing. We can expect the situation to be quite similar shortly, if gold does indeed rally. The move higher could be temporary, and unless we have a weekly close above the rising support line (dashed line, currently close to 46), we will not have any bullish implications whatsoever.
Even if we see some strength, the ratio would have to move above 48 (where the upper declining resistance line is currently located) in order for the situation to become bullish.
Consequently, some short-term strength is clearly possible, but we don’t think that the medium-term downtrend will be invalidated.
Having discussed the current situation in gold, let’s take a look at the long-term chart of silver.
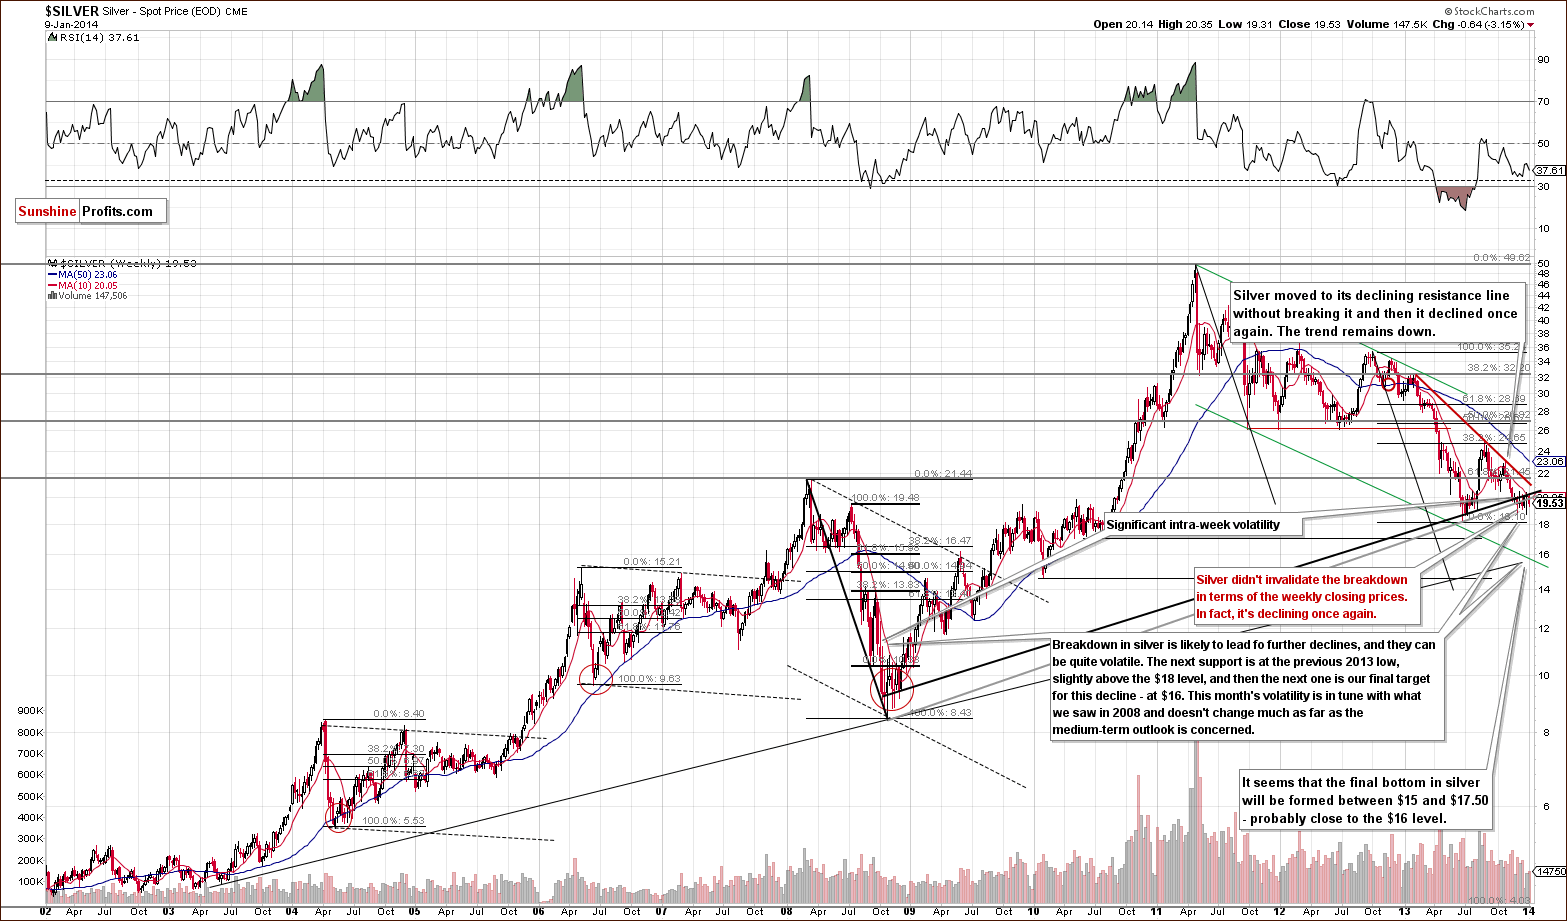
It is often said that history repeats itself (or that it rhymes) and it surely applies when we look at silver’s recent performance.
At the end of December silver moved temporarily back above the rising support/resistance line, but didn’t manage to hold this level. The white metal gave up the gains and dropped below both long-term support/resistance lines, which triggered further deterioration.
This week, the white metal made another attempt to move back above the resistance lines, but failed to move above the upper of them and ultimately the breakdown below these lines was not invalidated.
The next downside target is the previous 2013 low, slightly above the $18 level. Once we see silver below it, the next (and probably final) stop will likely be close to $16. Overall, the trend remains down.
Summing up, looking at the current situation in gold and silver, we see that the medium-term trends remain down and the outlook for both remains bearish. However, on a short-term basis we can expect to see a temporary move higher. In case of gold, it doesn’t seem that the yellow metal will move above $1,250, and even if that happened, it would not be likely to move above $1,285 and change the medium-term trend. In the case of silver, given the white metal’s back-and-forth performance in the recent weeks, we also can’t rule out another move higher before the next big move down materializes.
Thank you for reading. Have a great weekend and profitable week!
Przemyslaw Radomski, CFA
Back