

We have already said that negative GOFO means backwardation in gold. What causes the backwardation and what does it imply for the gold market? Before we answer these questions, let’s get a better grasp of the subject.
Backwardation in gold is a situation in which futures prices are lower than spot price of the same good (or futures prices are lower in succeeding delivery months). It is the opposite of contango in gold, which is a normal situation for non-perishable commodities which have a cost of carry. This is because people are eager to pay more for a commodity at some point in the future than the actual expected price of the commodity to avoid paying the costs of storage and carry costs of buying the commodity today. This contrasts with backwardation which means that people are willing to pay more for immediate delivery than in the future. This is the case with perishable commodities: for example, it is definitely worth paying more for immediate delivery of fresh eggs rather than waiting 3 months for them. Backwardation is also logical for commodities produced seasonally, like agricultural products. For example, it makes perfect sense that a bushel of wheat is more expensive in the middle of winter as opposed to late summer, after the harvest when product is abundant. In other words, backwardation suggests supply shortages in the spot market.
However, such a situation should not occur in the gold market, given the large above-ground stock of the shiny metal ready to meet demand. The available inventory of gold is so large that the idea of supply shortages in the gold market seems ridiculous. What does explain the backwardation in gold, then? Well, some analysts say the gold outflows into China, so there is a shortage in the Comex or London gold market. Other argue that gold backwardation means the lack of trust in future delivery (i.e. investors do not believe that gold futures will be honored by delivery of gold), which signals a financial crisis. What is the truth? First, let’s analyze the history of gold backwardation.
Chart 1: The 1-month GOFO (red line, in %) and 12-months GOFO (orange line, in %) from July 1989 to 2009.
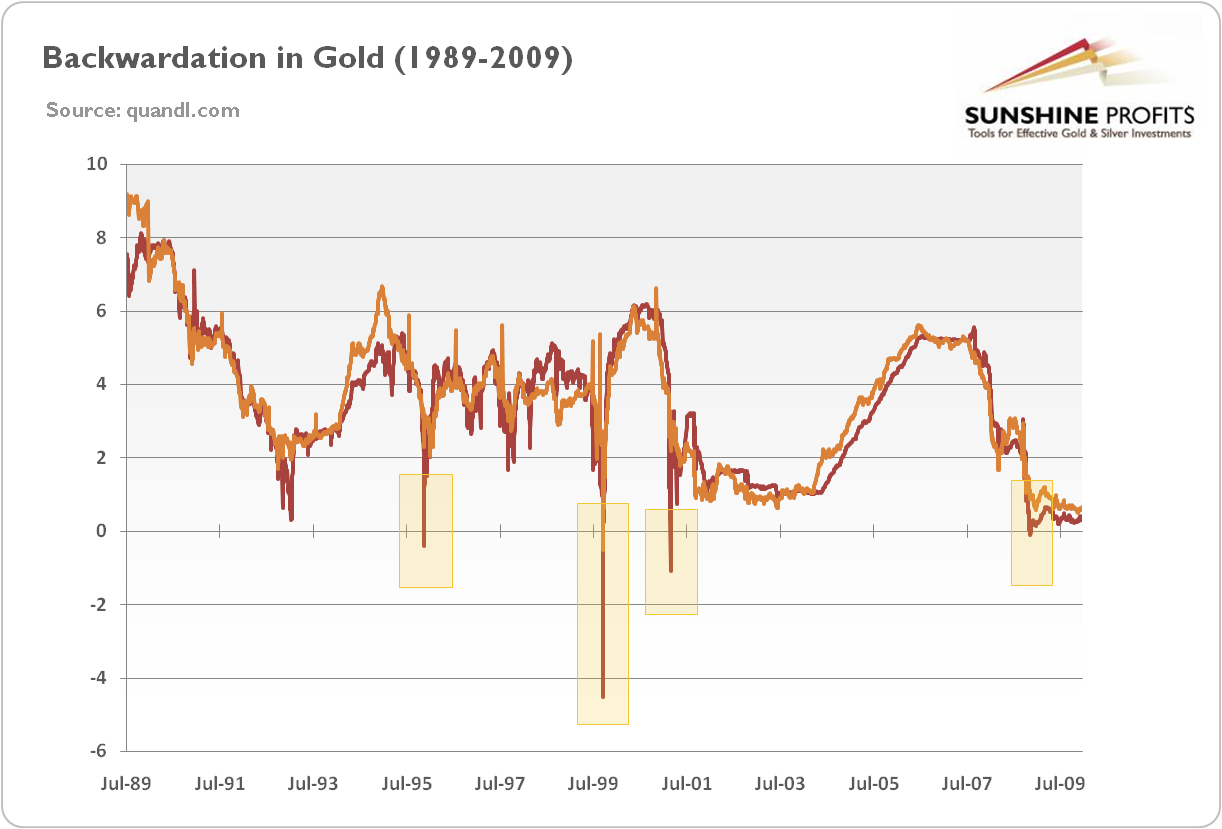
As one can see in the chart above, between July 1989 and 2009 the gold backwardation (reflected by negative GOFO) was very rare. Additionally, within that period it was very small (and with exception of 1999 limited to 1-month GOFO) and short-lived. It first occurred on November 29th, 1995, lasted a day, and was probably caused by a hedge buy-back by Barrick Gold. The next, 2-day backwardation in the gold market took place in September 29-30, 1999. It probably resulted from the Washington Agreement on Gold -its announcement led to a price surge and a mad rush for physical gold to cover short positions. For the third time it bracketed a weekend in March 9-12, 2001, when the end of the previous month’s bear market caused a short-term gold bullion shortage. The last GOFO happened in November 2008 (and continued for three days), probably due to the flight to gold during the global financial crisis.
Chart 2: The 1-month GOFO (red line, in %) and 12-months GOFO (orange line, in %) from 2008 to January 2015.
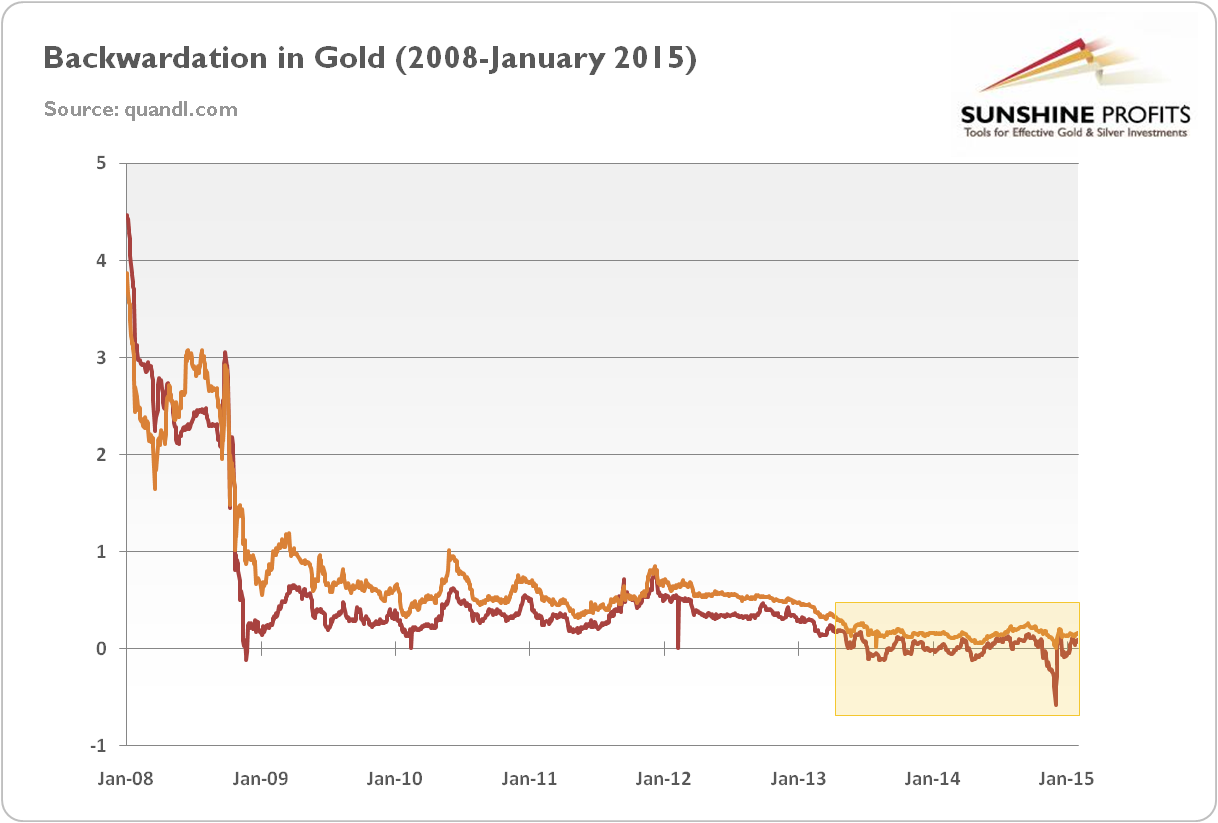
After the 2008 financial crisis the cases of backwardation in gold reiterated. Starting 2009, the GOFO rates were lowering and often flirted with negative values. Since 2013, backwardation has become a new norm in the gold market. Until 2009, gold was in backwardation just for a total of eight days, while in 2013 and 2014 it persisted for weeks and months. What has changed?
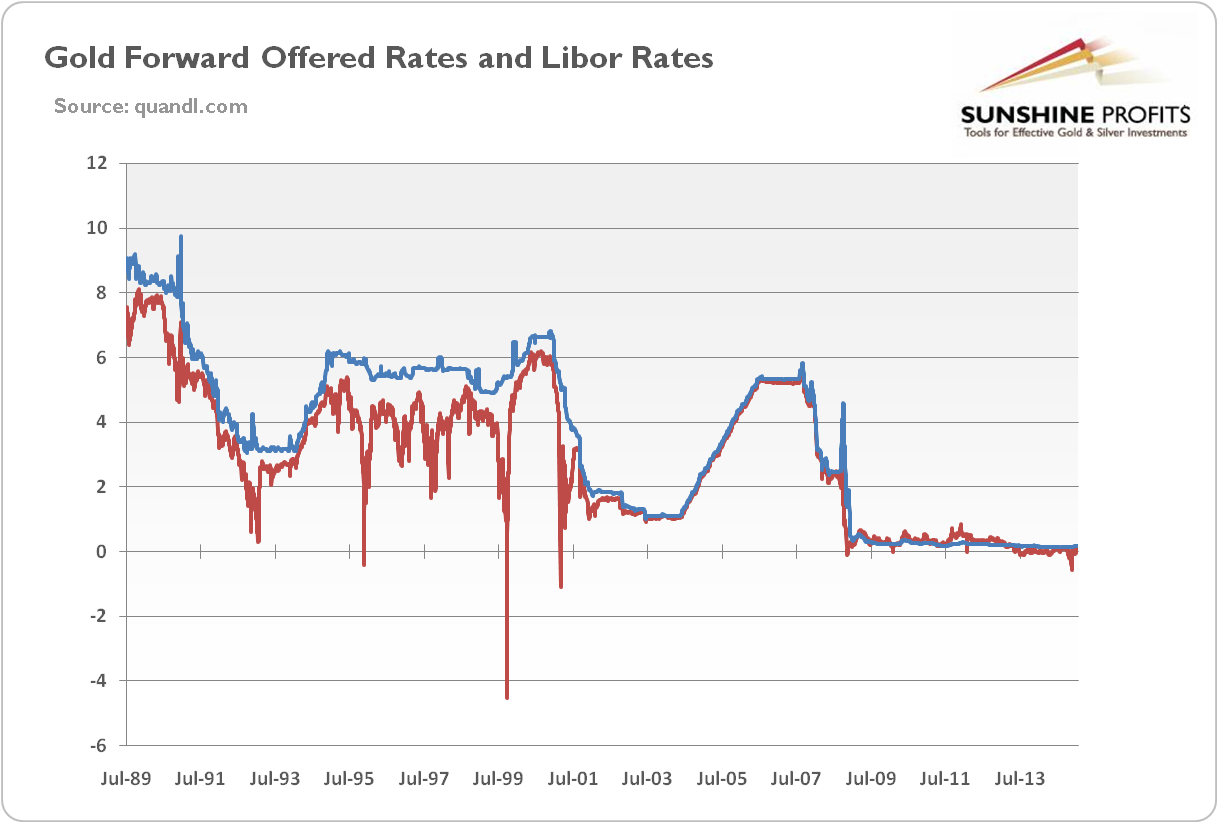
Well, the answer lies in the Fed’s zero interest rate policies. As one can see in the chart below, the GOFO generally tracks the LIBOR (which makes sense since the GOFO is the swap rate for a gold-to-U.S. dollar exchange, while the LIBOR is dollar’s interest rate. Therefore, when the Fed’s ZIRP pushed down LIBOR near zero in late 2008, the GOFO followed.
Chart 3: The 1-month GOFO (red line, in %) and the 1-month LIBOR (blue line, in %) from July 1989 to January 2015.
The bottom line is that during the backwardation in gold the gold futures prices are lower than the spot price. Normally, when the interest rates were significantly higher than zero, backwardation in the gold market was an unusual situation reflecting the short-lived imbalance between supply and demand. However, with LIBOR near zero, the negative GOFO are not strange or meaningful. Therefore, the backwardation in the gold market does not reflect the imminent default of the Western paper gold market and the supply shortage due to bullion outflows to Asia, but it is all about an all-time-low LIBOR. Thus, in the zero interest rate environment, gold investors should not consider a backwardation in gold as a bullish indicator of supply shortage, at least not without looking at the LIBOR.
If you enjoyed the above analysis and would you like to know more about the gold lending and swap market, we invite you to read the May Market Overview report. If you’re interested in the detailed price analysis and price projections with targets, we invite you to sign up for our Gold & Silver Trading Alerts. If you’re not ready to subscribe at this time, we invite you to sign up for our gold newsletter and stay up-to-date with our latest free articles. It's free and you can unsubscribe anytime.
Thank you.
Arkadiusz Sieron
Sunshine Profits‘ Gold News Monitor and Market Overview Editor
Gold News Monitor
Gold Trading Alerts
Gold Market Overview
