

Stock Trading Alert originally sent to subscribers on November 17, 2016, 6:51 AM.
Briefly: In our opinion, speculative short positions are favored (with stop-loss at 2,240, and profit target at 2,060, S&P 500 index).
Our intraday outlook is bearish, and our short-term outlook is bearish. Our medium-term outlook remains neutral, following S&P 500 index breakout above last year's all-time high:
Intraday outlook (next 24 hours): bearish
Short-term outlook (next 1-2 weeks): bearish
Medium-term outlook (next 1-3 months): neutral
Long-term outlook (next year): neutral
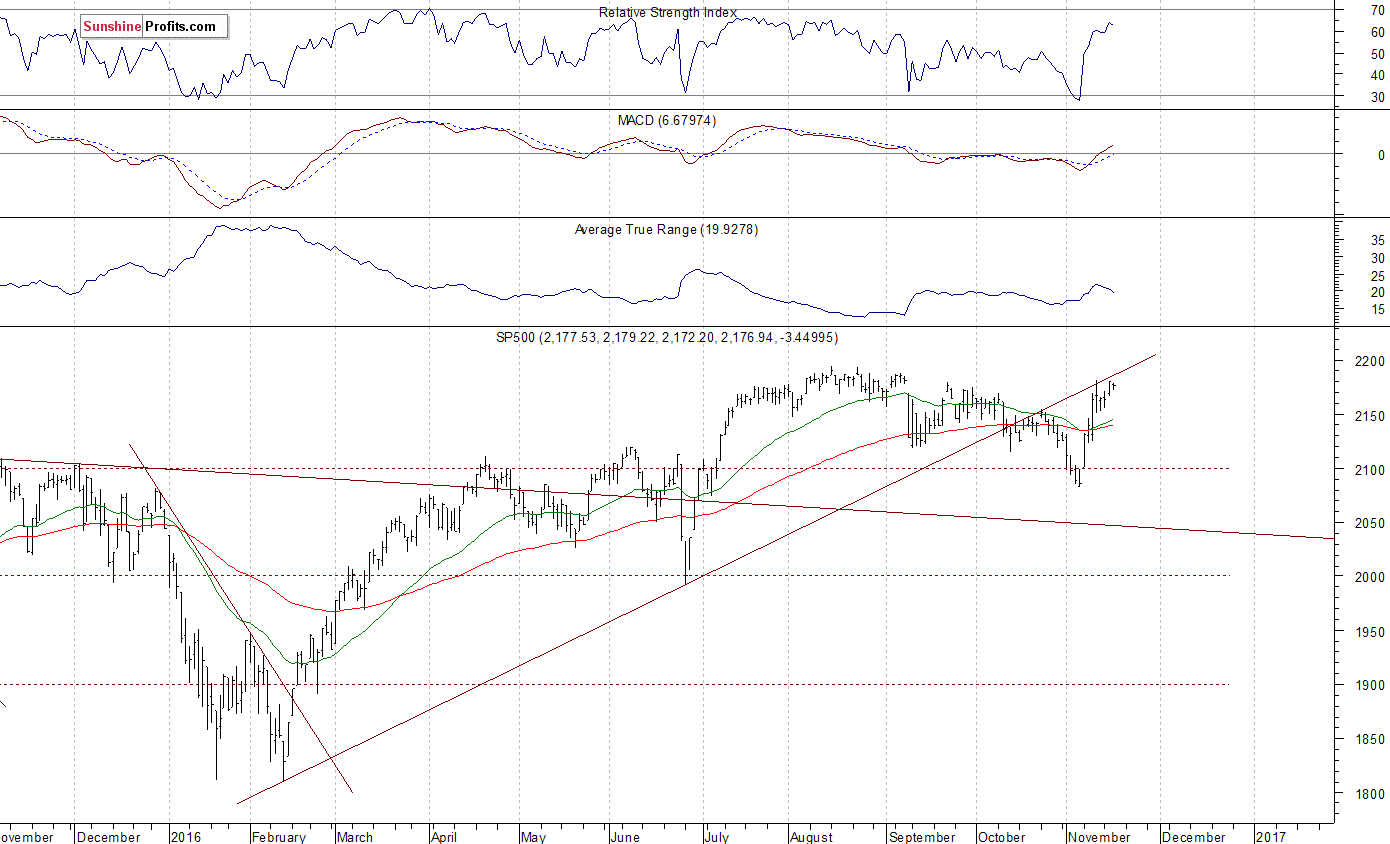
The U.S. stock market indexes were mixed between -0.3% and +0.6% on Wednesday, as investors hesitated following recent move up, economic data releases. The S&P 500 index broke above the resistance level of 2,150-2,160 recently. The next resistance level is at 2,180-2,200, marked by record high. On the other hand, support level is at 2,100-2,120, marked by previous resistance level. The next important level of support remains at around 2,080, marked by recent local lows, as we can see on the daily chart:
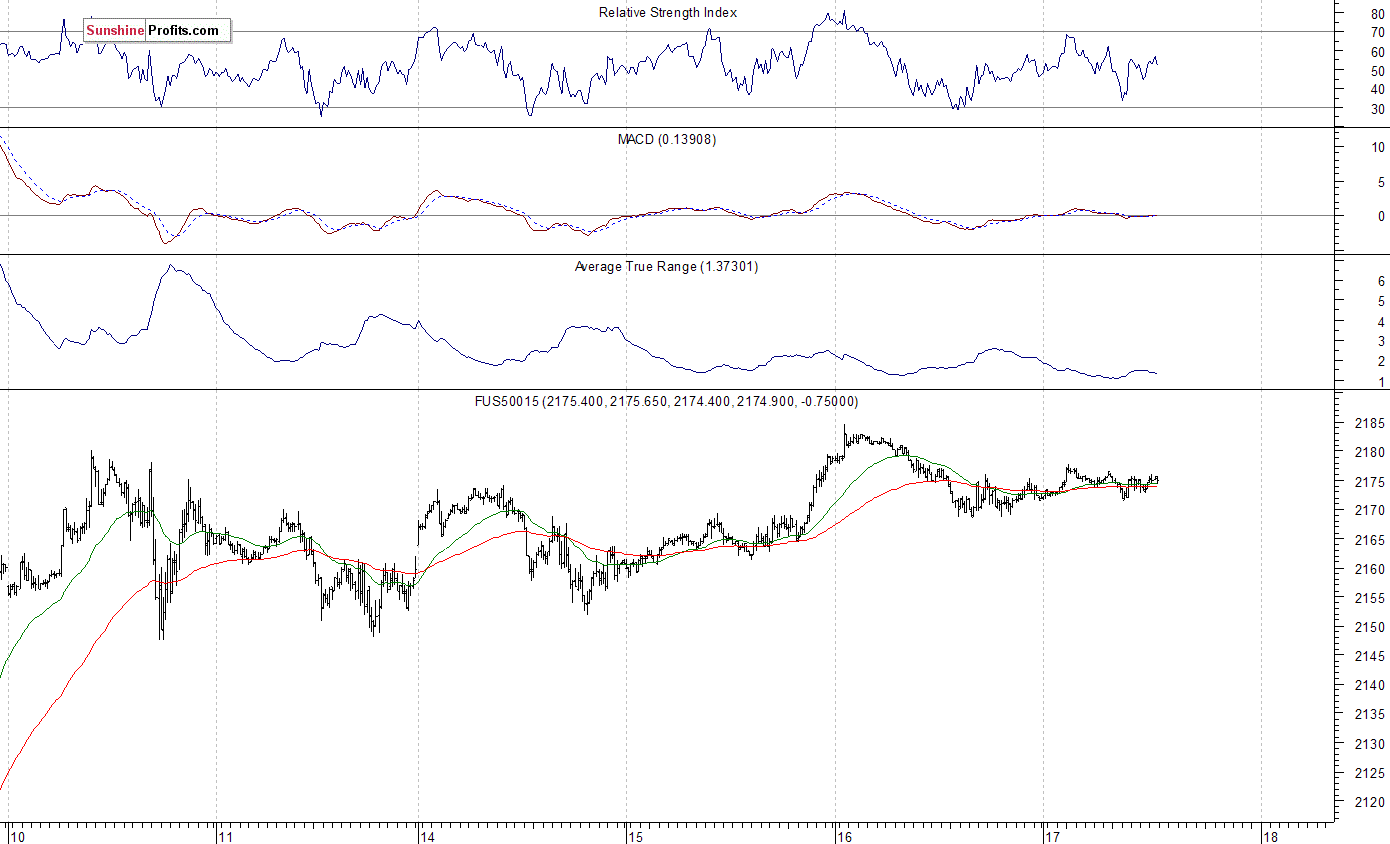
Expectations before the opening of today's trading session are slightly positive, with index futures currently up 0.1-0.2%. The European stock market indexes have been mixed so far. Investors will now wait for series of economic data announcements: Consumer Price Index, Housing Starts, Building Permits, Initial Claims, Philadelphia Fed at 8:30 a.m. The S&P 500 futures contract trades within an intraday consolidation, as it fluctuates along the level of 2,175. The nearest important level of resistance is at around 2,180-2,185, marked by short-term local highs. On the other hand, support level is at 2,160-2,170, among others:
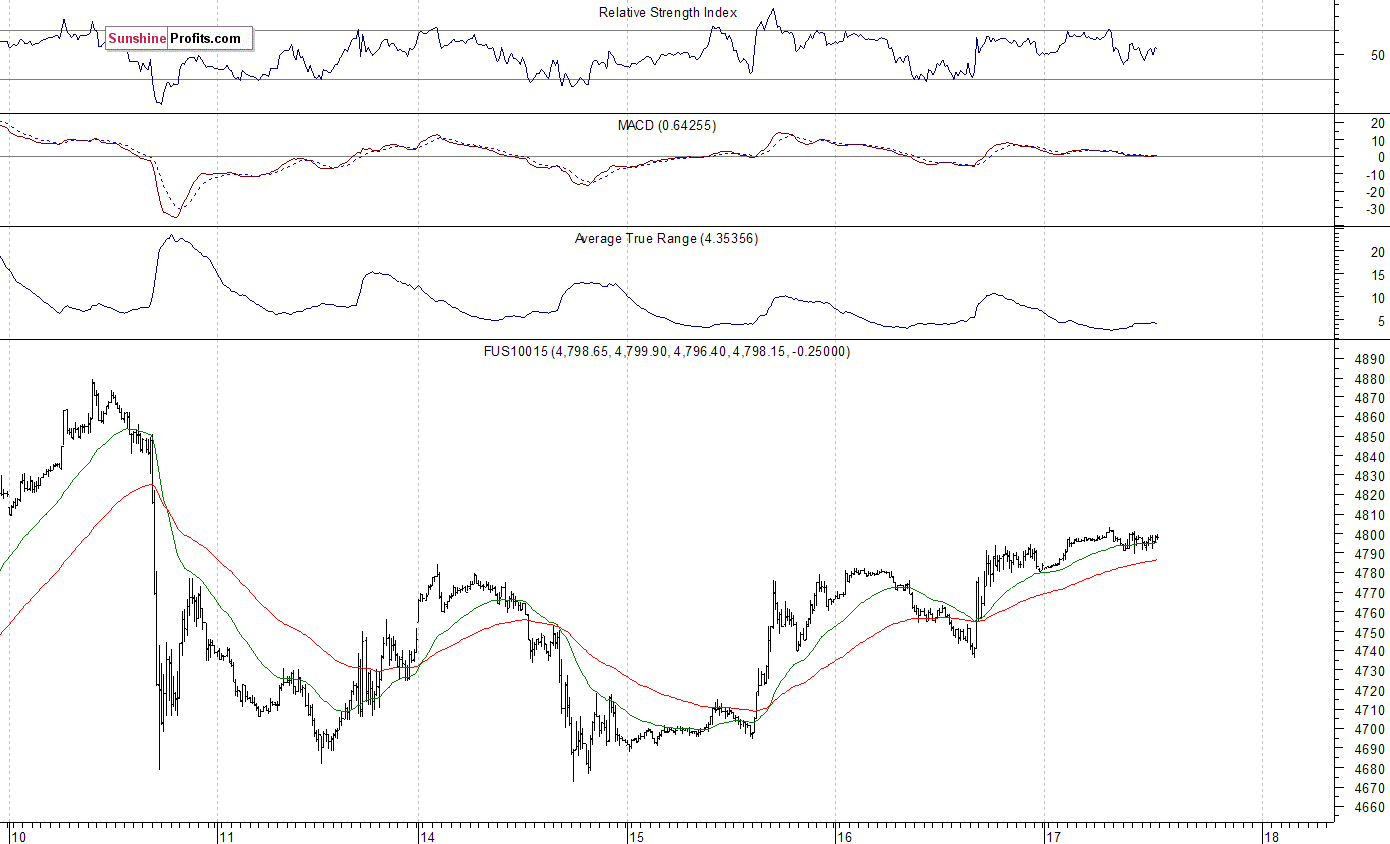
The technology Nasdaq 100 futures follows a similar path, as it currently fluctuates along the resistance level of 4,800. The market has retraced most of its recent sell-off. The nearest important level of support remains at 4,700-4,750, marked by some recent local lows, as the 15-minute chart shows:
Concluding, the broad stock market continues to trade within a short-term consolidation following last week's rally. We can see some short-term overbought conditions, accompanied by negative technical divergences. Therefore, we continue to maintain our speculative short position (opened yesterday at around 2,177 - opening price of the S&P 500 index). Stop-loss level is at 2,240 and potential profit target is at 2,060 (S&P 500 index). You can trade S&P 500 index using futures contracts (S&P 500 futures contract - SP, E-mini S&P 500 futures contract - ES) or an ETF like the SPDR S&P 500 ETF - SPY. It is always important to set some exit price level in case some events cause the price to move in the unlikely direction. Having safety measures in place helps limit potential losses while letting the gains grow.
Thank you.
Paul Rejczak
Stock Trading Strategist
Stock Trading Alerts
