

Stock Trading Alert originally sent to subscribers on November 3, 2016, 6:56 AM.
Briefly: In our opinion, speculative short positions are favored (with stop-loss at 2,150, and profit target at 2,020, S&P 500 index).
Our intraday outlook is bearish, and our short-term outlook is bearish. Our medium-term outlook is neutral, following S&P 500 index breakout above last year's all-time high:
Intraday outlook (next 24 hours): bearish
Short-term outlook (next 1-2 weeks): bearish
Medium-term outlook (next 1-3 months): neutral
Long-term outlook (next year): neutral
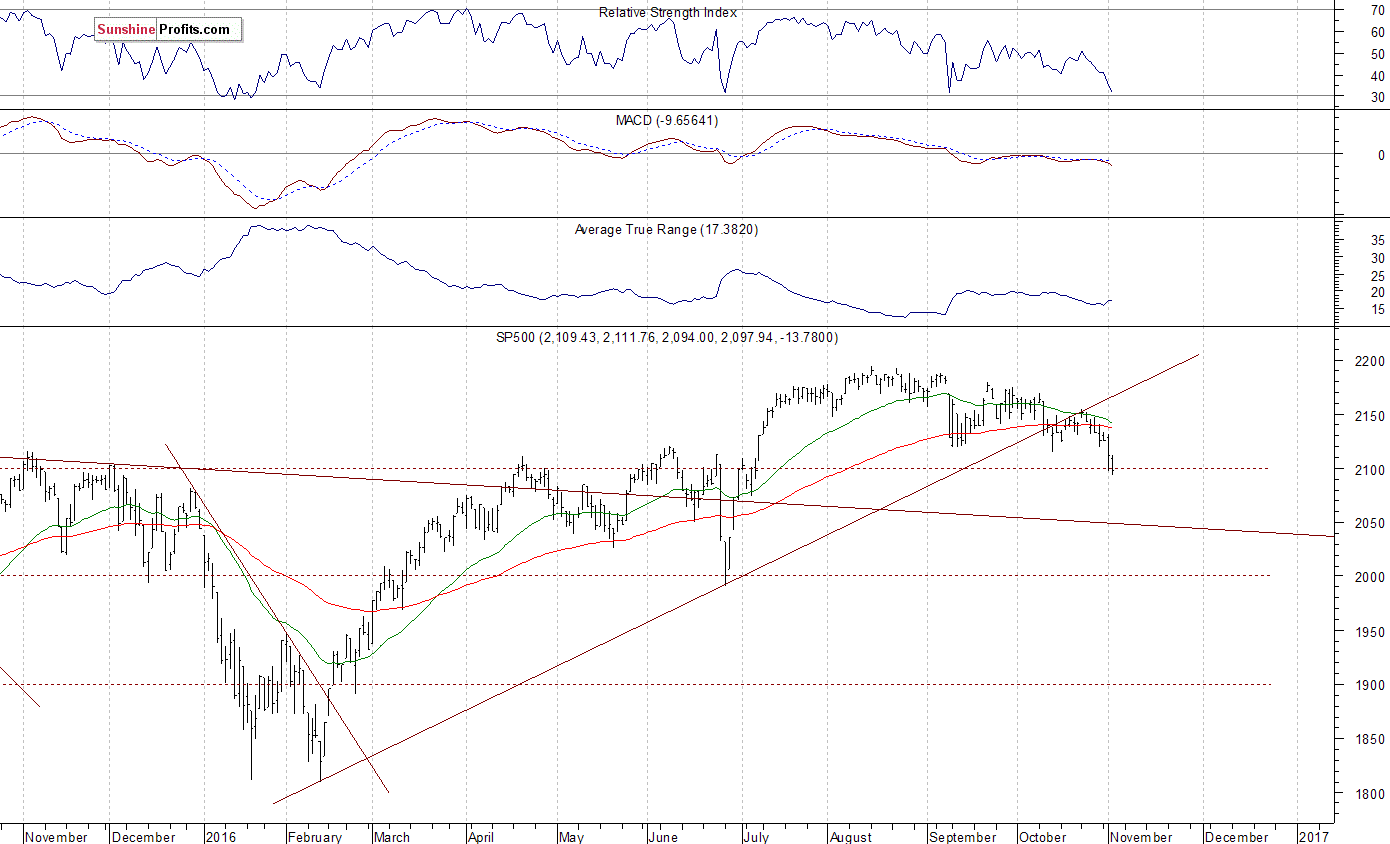
The U.S. stock market indexes lost between 0.4% and 0.8% on Wednesday, extending their short-term downtrend, as investors reacted to the FOMC Rate Decision, quarterly corporate earnings, economic data releases. The S&P 500 index broke below its September - October local lows on Tuesday. It is the lowest since early July. The nearest important support level is at around 2,075-2,090, marked by some previous consolidation. The next important level of support is at 2,035-2,045, marked by the late June daily gap up. On the other hand, resistance level is at 2,110-2,120, and the next resistance level is at 2,150 marked by last month's local highs, as we can see on the daily chart:
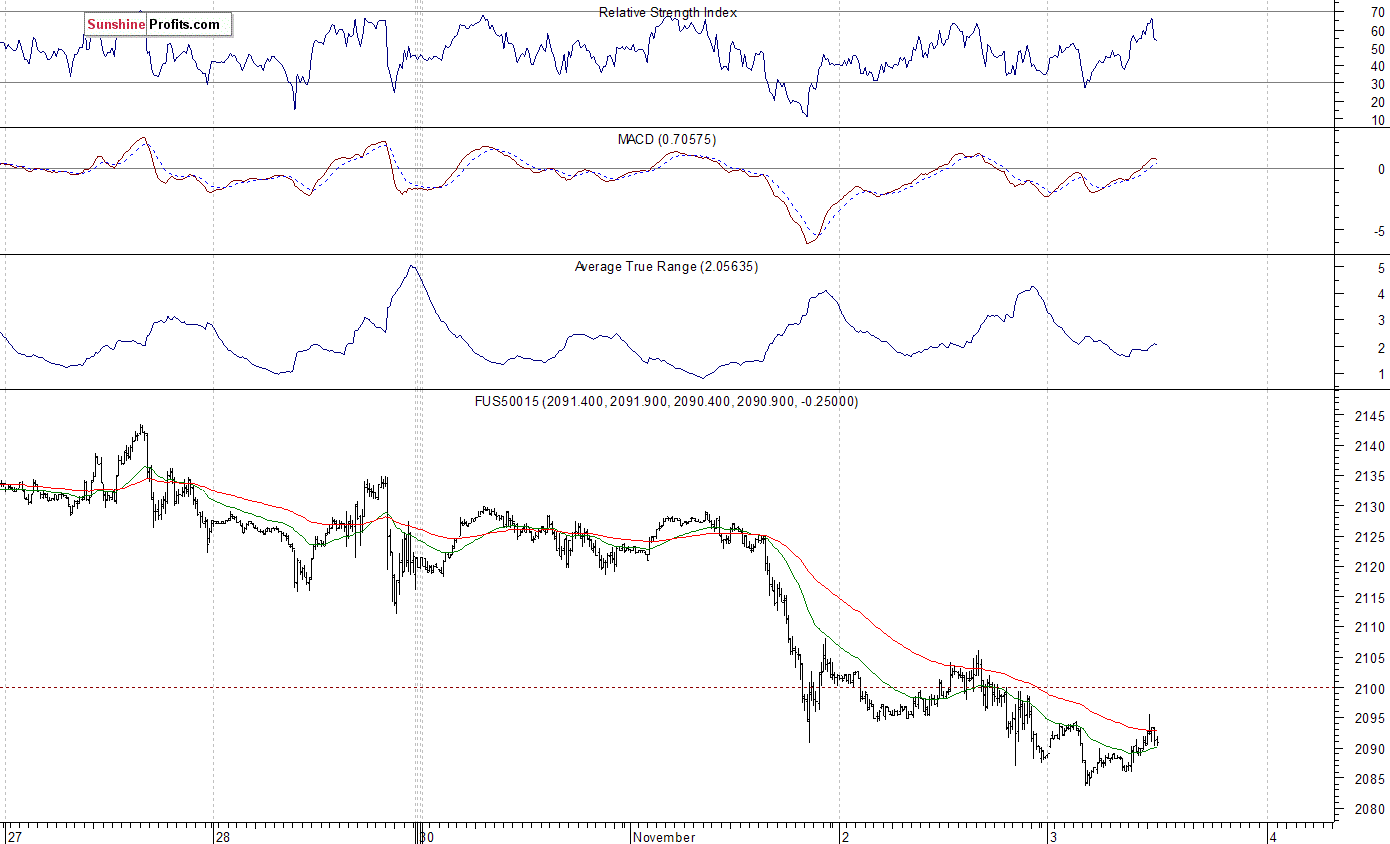
Expectations before the opening of today's trading session are mixed, with index futures currently between -0.4% and +0.1%. The main European stock market indexes have been mixed so far. Investors will now wait for some economic data announcements: Initial Claims, Productivity at 8:30 a.m., Factory Orders, ISM Services number at 10:00 a.m. The S&P 500 futures contract trades within an intraday consolidation, as it bounces off support level at around 2,085-2,090. The nearest important level of resistance is at 2,100 mark. There have been no confirmed short-term positive signals so far:
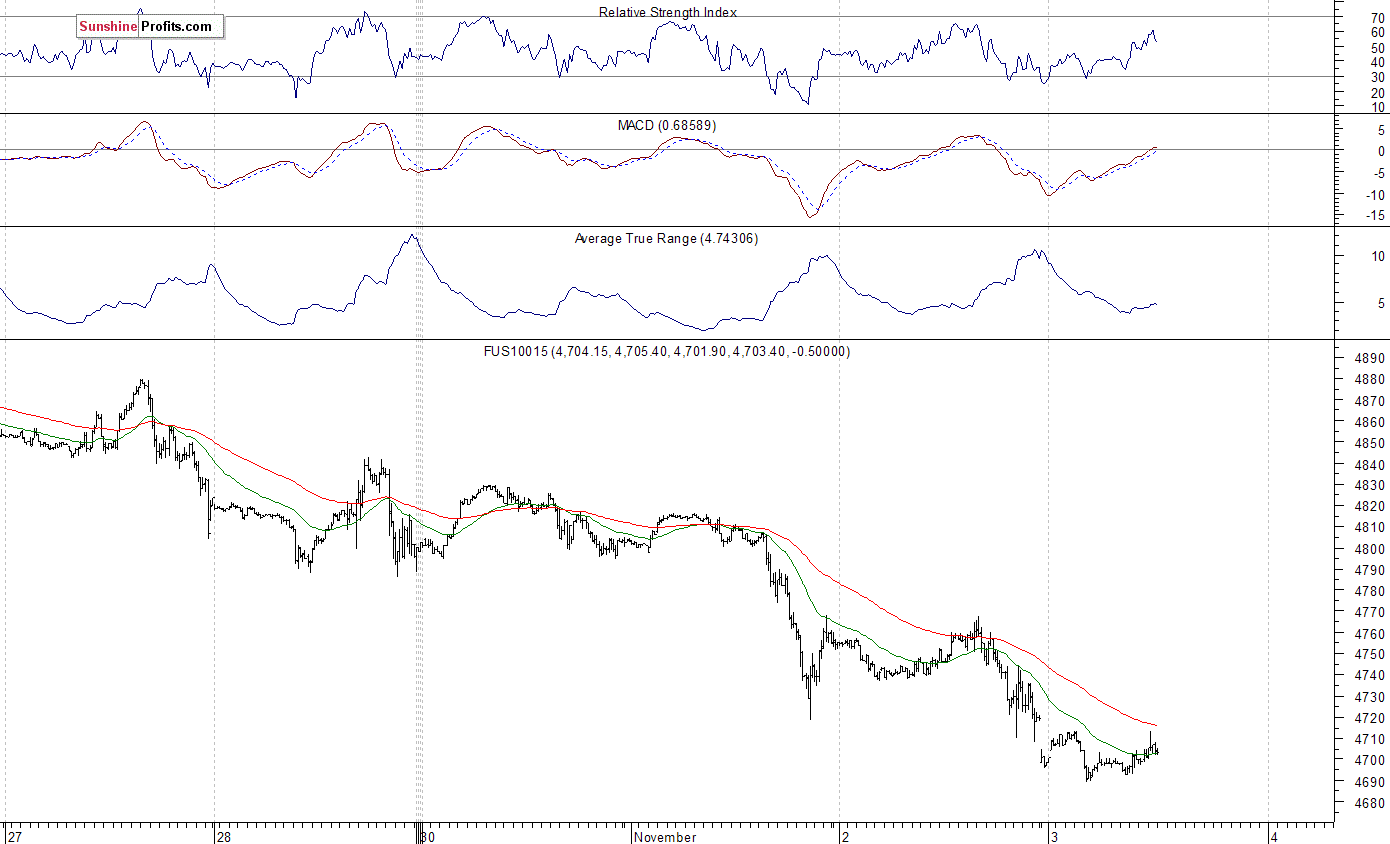
The technology Nasdaq 100 futures contract is relatively weaker than the broad stock market, following yesterday's Facebook's quarterly earnings release. It currently trades along the level of 4,700. The nearest important level of support is at around 4,690, and resistance level remains at 4,720-4,740, among others, as the 15-minute chart shows:
Concluding, the broad stock market continued its short-term downtrend yesterday, as the S&P 500 index traded the lowest since early July. We continue to maintain our speculative short position (opened on July 18th at 2,162, S&P 500 index). However, yet again we decided to move our stop-loss level: from 2,180 down to 2,150 (S&P 500 index). Our potential profit target level remains at 2,020 (S&P 500 index). You can trade S&P 500 index using futures contracts (S&P 500 futures contract - SP, E-mini S&P 500 futures contract - ES) or an ETF like the SPDR S&P 500 ETF - SPY. It is always important to set some exit price level in case some events cause the price to move in the unlikely direction. Having safety measures in place helps limit potential losses while letting the gains grow.
Thank you.
Paul Rejczak
Stock Trading Strategist
Stock Trading Alerts
