

Stock Trading Alert originally sent to subscribers on September 29, 2016, 6:51 AM.
Briefly: In our opinion, speculative short positions are favored (with stop-loss at 2,210, and profit target at 2,050, S&P 500 index).
Our intraday outlook is bearish, and our short-term outlook is bearish. Our medium-term outlook is neutral, following S&P 500 index breakout above last year's all-time high:
Intraday outlook (next 24 hours): bearish
Short-term outlook (next 1-2 weeks): bearish
Medium-term outlook (next 1-3 months): neutral
Long-term outlook (next year): neutral
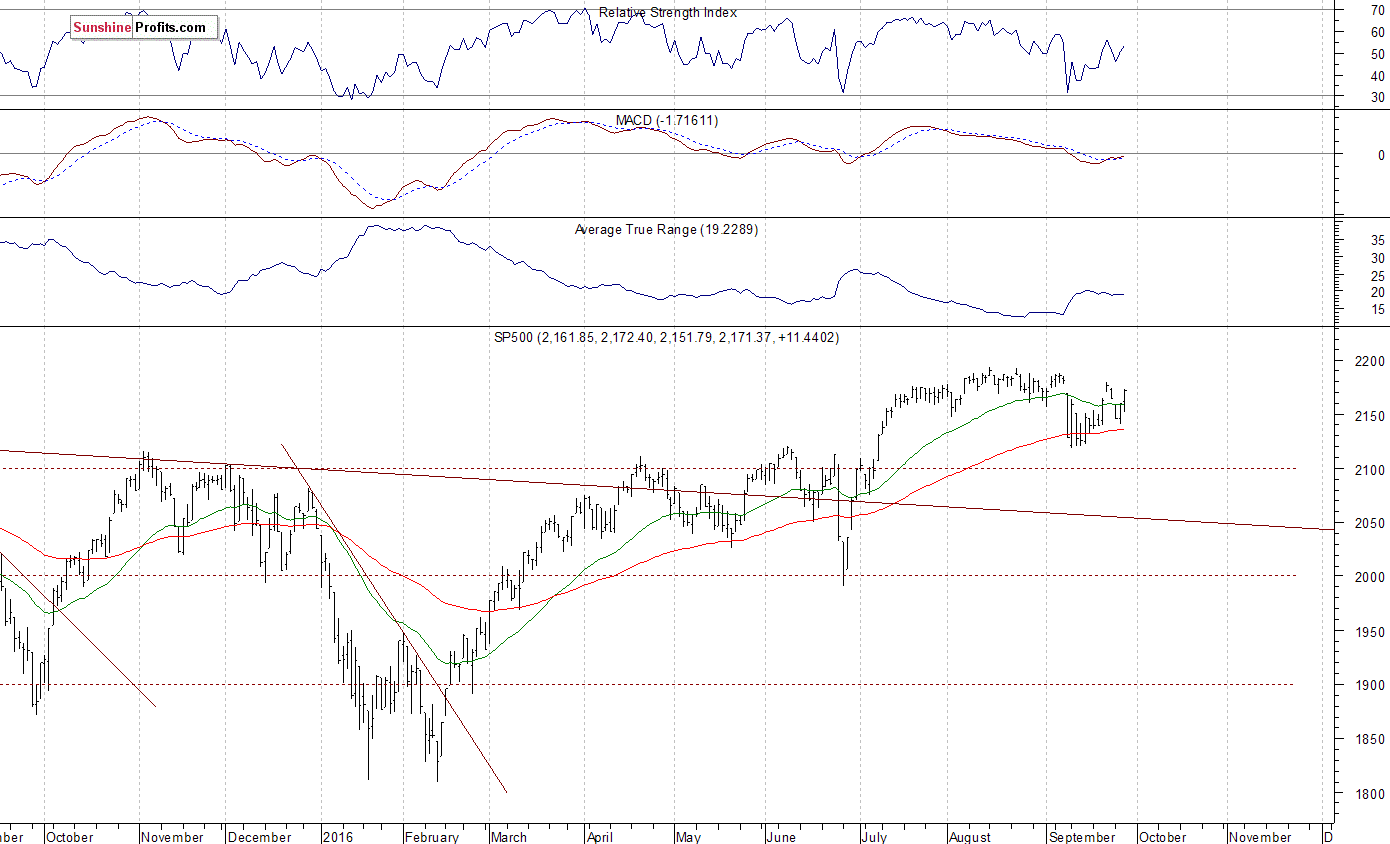
The U.S. stock market indexes gained between 0.2% and 0.6% on Wednesday, extending their short-term uptrend, as investors reacted to economic data releases, among others. The S&P 500 index continues to trade along its July - August consolidation. The nearest important level of resistance is at around 2,160, marked by Monday's daily gap down of 2,158.54-2,163.97. The next important level of resistance is at around 2,170, marked by previous daily gap down, among others. On the other hand, support level is at around 2,120-2,140, marked by local lows. The market trades within a downward correction following recent rally. Will it continue its uptrend? Or is this some topping pattern before downward reversal?
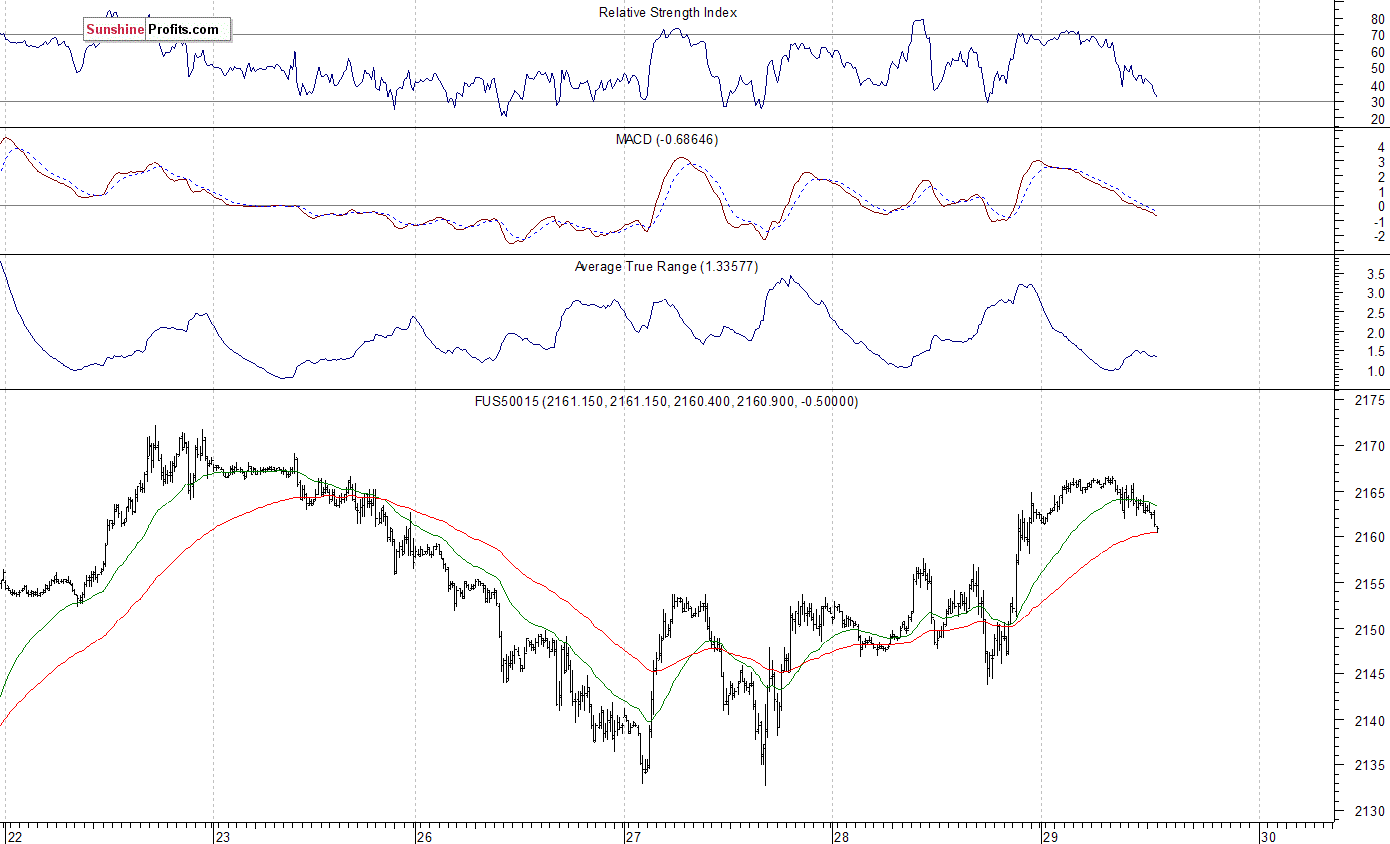
Expectations before the opening of today's trading session are virtually flat. The European stock market indexes have gained 0.7-0.9% so far. Investors will now wait for some economic data announcements: GDP - Third Estimate number, Initial Claims at 8:30 a.m., Pending Home Sales at 10:00 a.m. The S&P 500 futures contract trades within an intraday downtrend, following yesterday's advance. The nearest important level of resistance is at around 2,170. On the other hand, support level remains at 2,130-2,150, marked by recent consolidation, as we can see on the 15-minute chart:
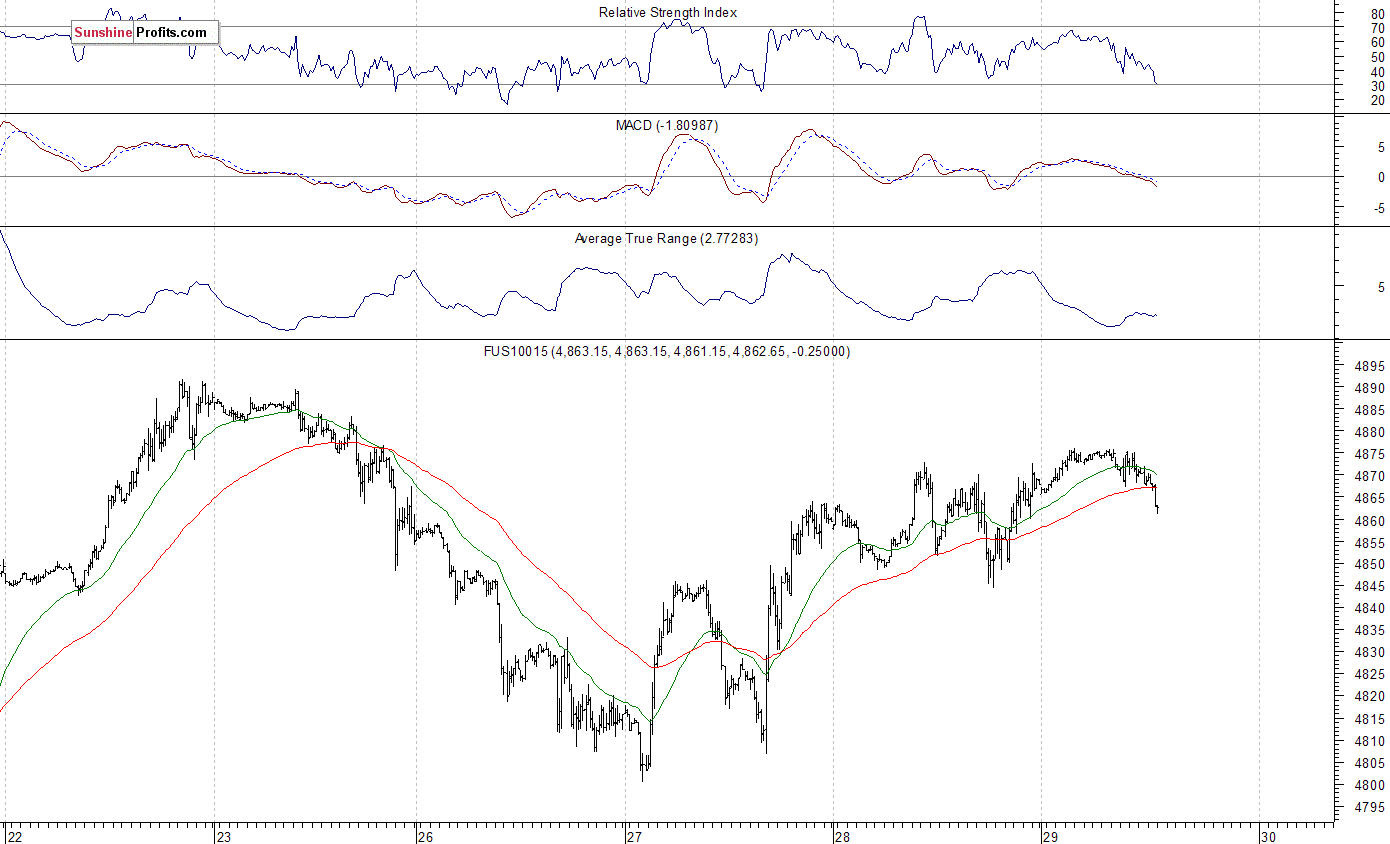
The technology Nasdaq 100 futures contract remains relatively stronger than the broad stock market, as it is close to its last week's new all-time high. However, it currently trades within an intraday downtrend. The nearest important support level is at around 4,850, marked by previous resistance level. The nearest important resistance level is at 4,880-4,900, among others, as the 15-minute chart shows:
Concluding, the broad stock market slightly extended its short-term uptrend yesterday. Is this a new medium-term uptrend or just upward correction? We still continue to maintain our speculative short position (opened on July 18th at 2,162, S&P 500 index). Stop-loss level is at 2,210 and potential profit target is at 2,050 (S&P 500 index). You can trade S&P 500 index using futures contracts (S&P 500 futures contract - SP, E-mini S&P 500 futures contract - ES) or an ETF like the SPDR S&P 500 ETF - SPY. It is always important to set some exit price level in case some events cause the price to move in the unlikely direction. Having safety measures in place helps limit potential losses while letting the gains grow.
Thank you.
Paul Rejczak
Stock Trading Strategist
Stock Trading Alerts
