

Stock Trading Alert originally sent to subscribers on July 18, 2016, 6:51 AM.
Briefly: In our opinion, speculative short positions are favored (with stop-loss at 2,210, and profit target at 2,050, S&P 500 index).
Our intraday outlook is now bearish, and our short-term outlook is bearish. Our medium-term outlook is now neutral, following S&P 500 index breakout above last year's all-time high:
Intraday outlook (next 24 hours): bearish
Short-term outlook (next 1-2 weeks): bearish
Medium-term outlook (next 1-3 months): neutral
Long-term outlook (next year): neutral
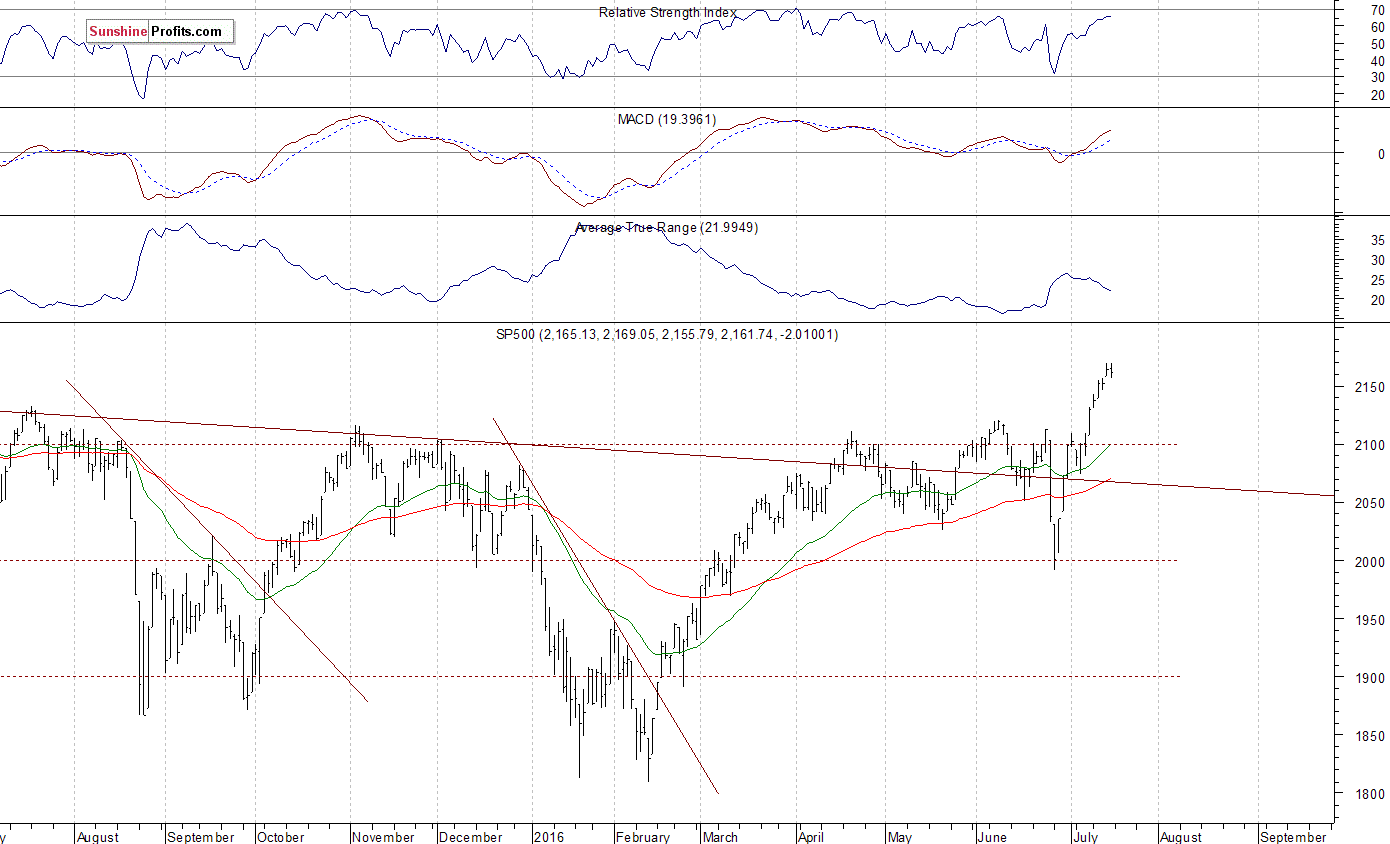
The U.S. stock market indexes were virtually flat on Friday, as investors hesitated following recent rally. The S&P 500 index has managed to reach yet another new all-time high at the level of 2,169.05. The nearest important level of support is at around 2,130-2,135, marked by previous level of resistance (S&P 500 index). The next important level of support is at around 2,100-2,120. On the other hand, potential level of resistance is at 2,200 mark. There have been no confirmed negative signals so far. However, we can see some short-term overbought conditions accompanied by negative technical divergences:
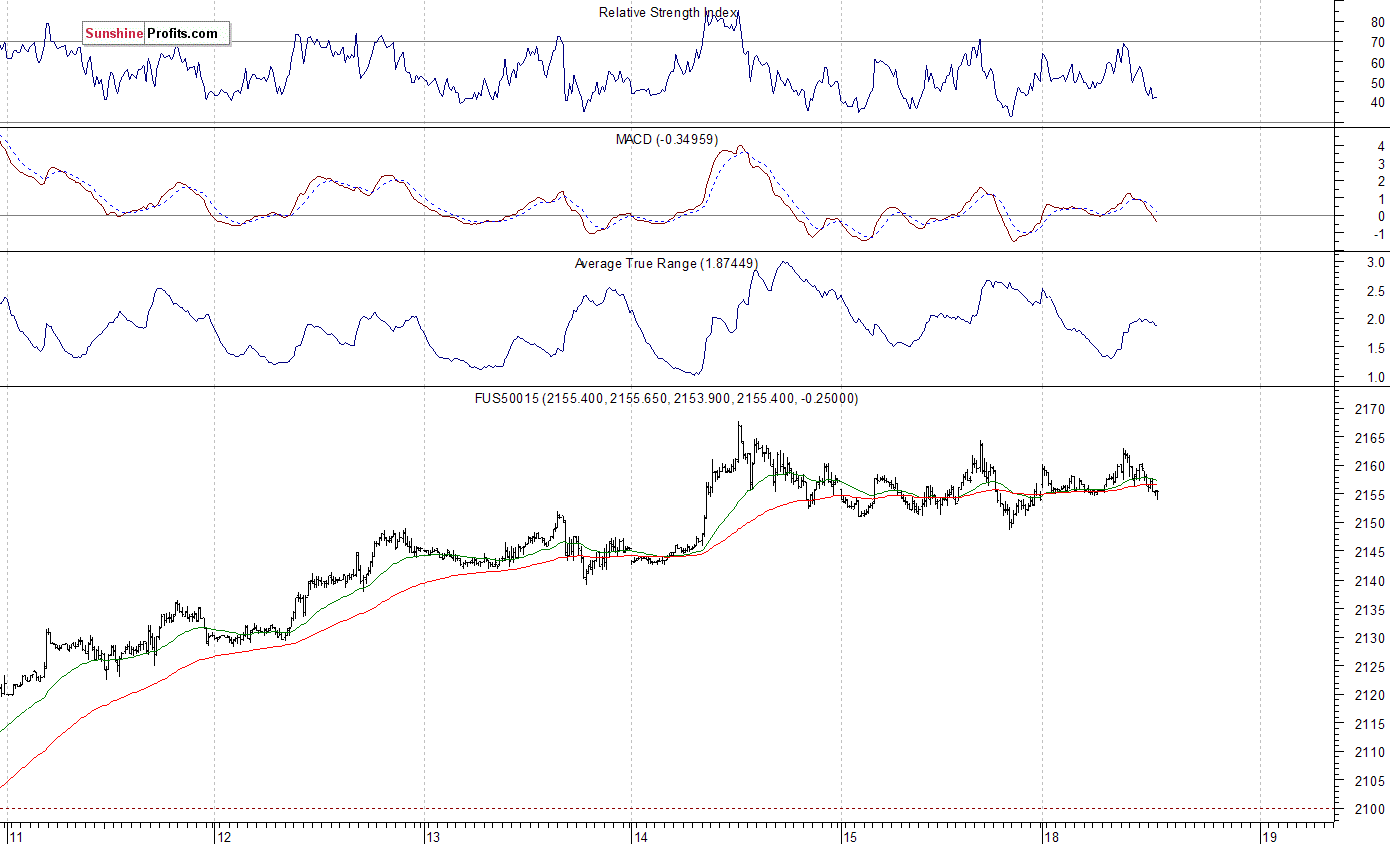
Expectations before the opening of today's trading session are virtually flat, with index futures currently up 0.1%. The European stock market indexes have been mixed so far. Investors will now wait for the NAHB Housing Market Index release at 10:00 a.m. The S&P 500 futures contract trades within an intraday consolidation, as it fluctuates along the level of 2,150-2,160. The nearest important level of resistance is at around 2,160-2,165, marked by recent all-time high. On the other hand, support level is at 2,150. There have been no confirmed negative signals so far. However, there are some technical overbought conditions, as we can see on the 15-minute chart:
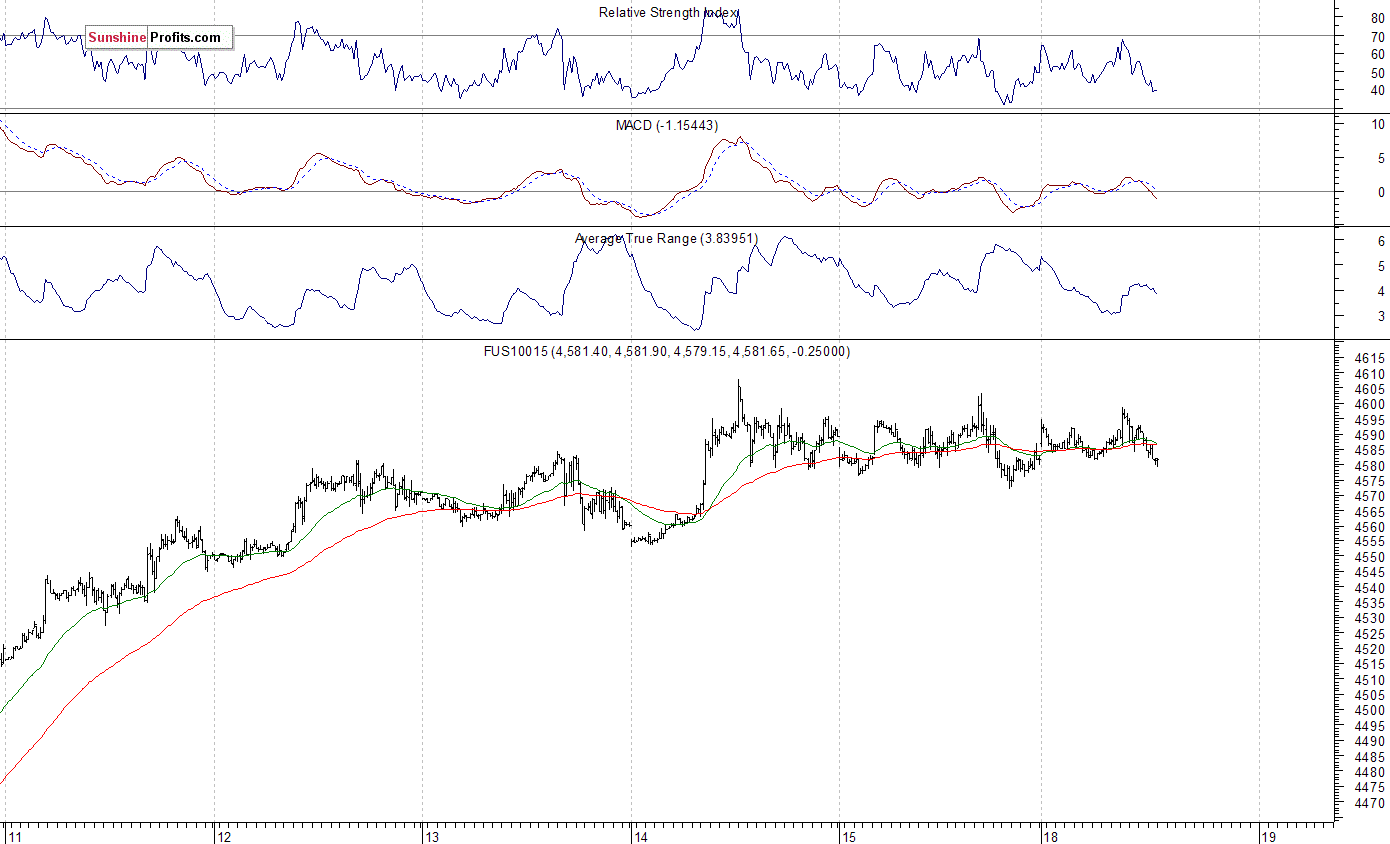
The technology Nasdaq 100 futures contract follows a similar path, as it currently trades within an intraday consolidation along the level of 4,580-4,600. The nearest important level of resistance is at around 4,600-4,610. On the other hand, support level remains at 4,550-4,570, marked by short-term consolidation, as the 15-minute chart shows:
Concluding, the broad stock market remains close to its all-time high, as the S&P 500 index continues to trade above 2,150 mark. We still can see short-term overbought conditions accompanied by bearish technical divergences. Therefore, we decided to open a speculative short position at the opening of today's cash market trading session (S&P 500 index). Stop-loss level is at 2,210 and potential profit target is at 2,050 (S&P 500 index). You can trade S&P 500 index using futures contracts (S&P 500 futures contract - SP, E-mini S&P 500 futures contract - ES) or an ETF like the SPDR S&P 500 ETF - SPY. It is always important to set some exit price level in case some events cause the price to move in the unlikely direction. Having safety measures in place helps limit potential losses while letting the gains grow.
Thank you.
Paul Rejczak
Stock Trading Strategist
Stock Trading Alerts
