

Stock Trading Alert originally sent to subscribers on July 14, 2016, 6:56 AM.
Briefly: In our opinion, no speculative positions are justified.
Our intraday outlook is now neutral, and our short-term outlook is neutral. Our medium-term outlook is now neutral, following S&P 500 index breakout above last year's all-time high:
Intraday outlook (next 24 hours): neutral
Short-term outlook (next 1-2 weeks): neutral
Medium-term outlook (next 1-3 months): neutral
Long-term outlook (next year): neutral
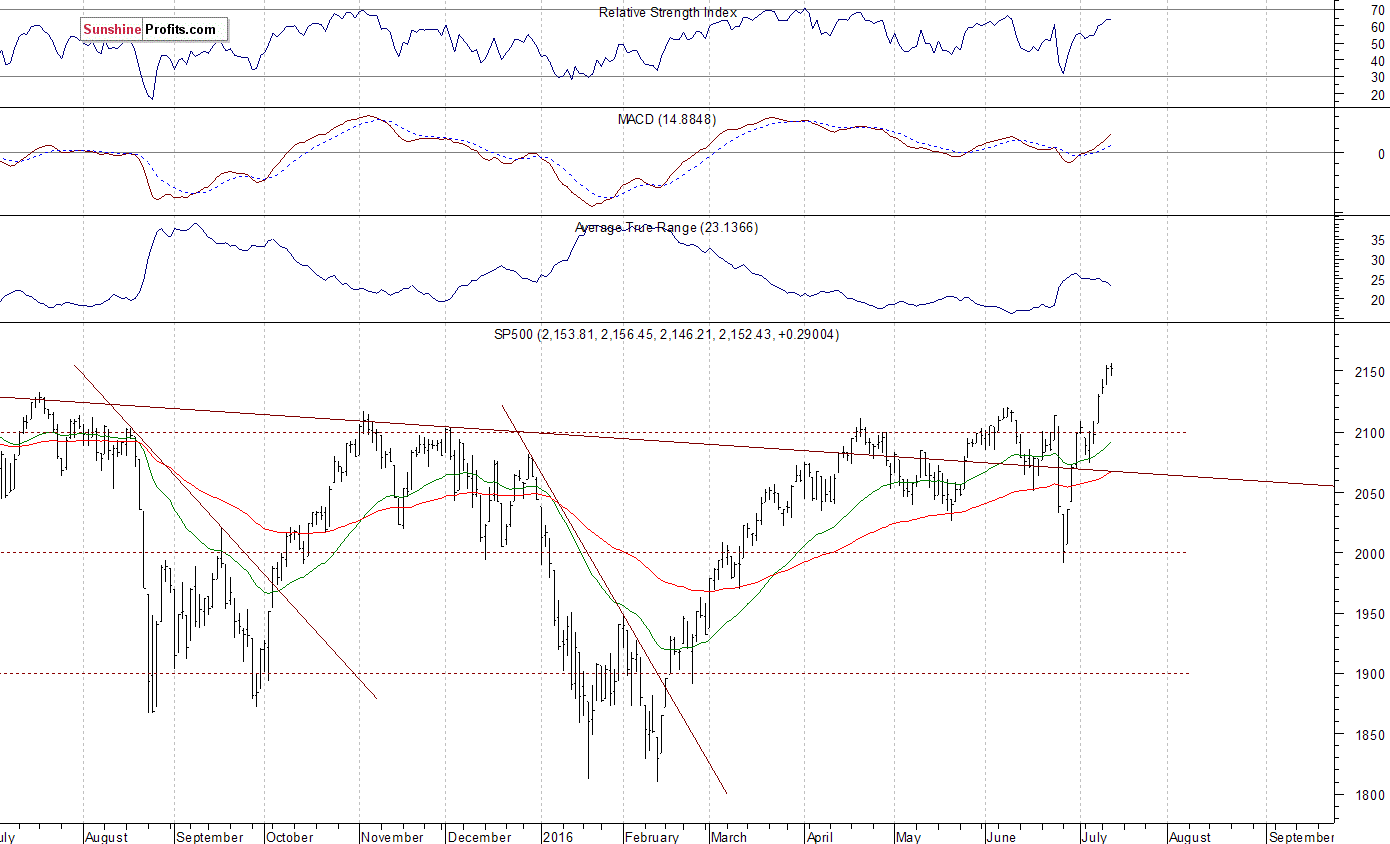
The main U.S. stock market were virtually flat on Wednesday, as investors hesitated following recent rally. The S&P 500 index has reached yet another new all-time high at the level of 2,156.45, slightly exceeding its yesterday's daily high. The nearest important level of support is at around 2,130-2,135, marked by previous level of resistance (S&P 500 index). The next important level of support is at around 2,100-2,120. On the other hand, potential level of resistance is at 2,200 mark. There have been no confirmed negative signals so far. However, we can see some short-term overbought conditions accompanied by negative technical divergences:
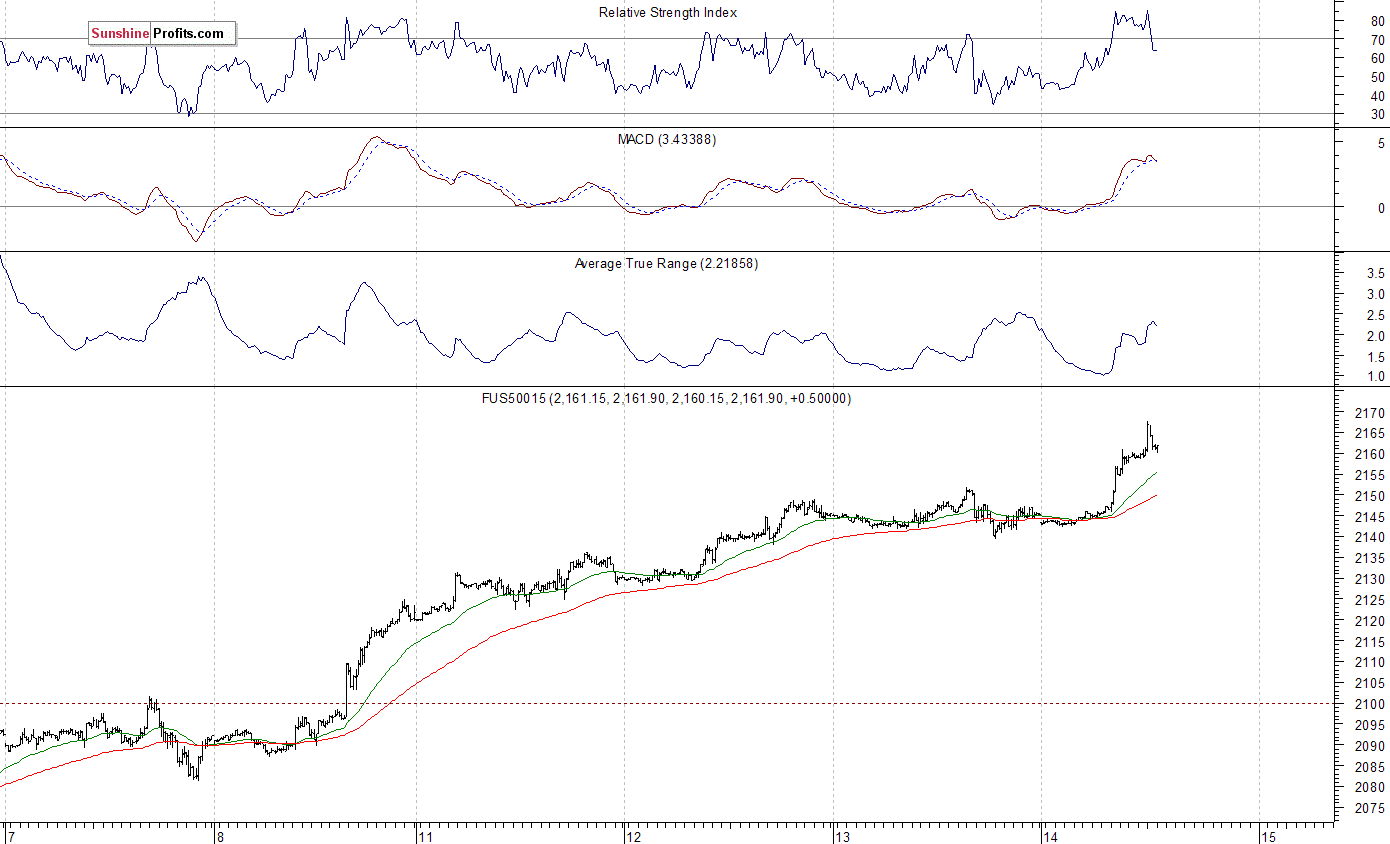
Expectations before the opening of today's trading session are positive, with index futures currently up 0.7-0.8%. The European stock market indexes have gained 0.9-1.4% so far. Investors will now wait for some economic data announcements: Initial Claims, Producer Price Index at 8:30 a.m. The S&P 500 futures contract trades within an intraday uptrend, as it continues its recent move up. However, we can see some intraday volatility following a breakout higher. The nearest important level of support is at around 2,150, marked by previous resistance level. There have been no confirmed negative signals so far. However, there are some short-term overbought conditions, as we can see on the 15-minute chart:
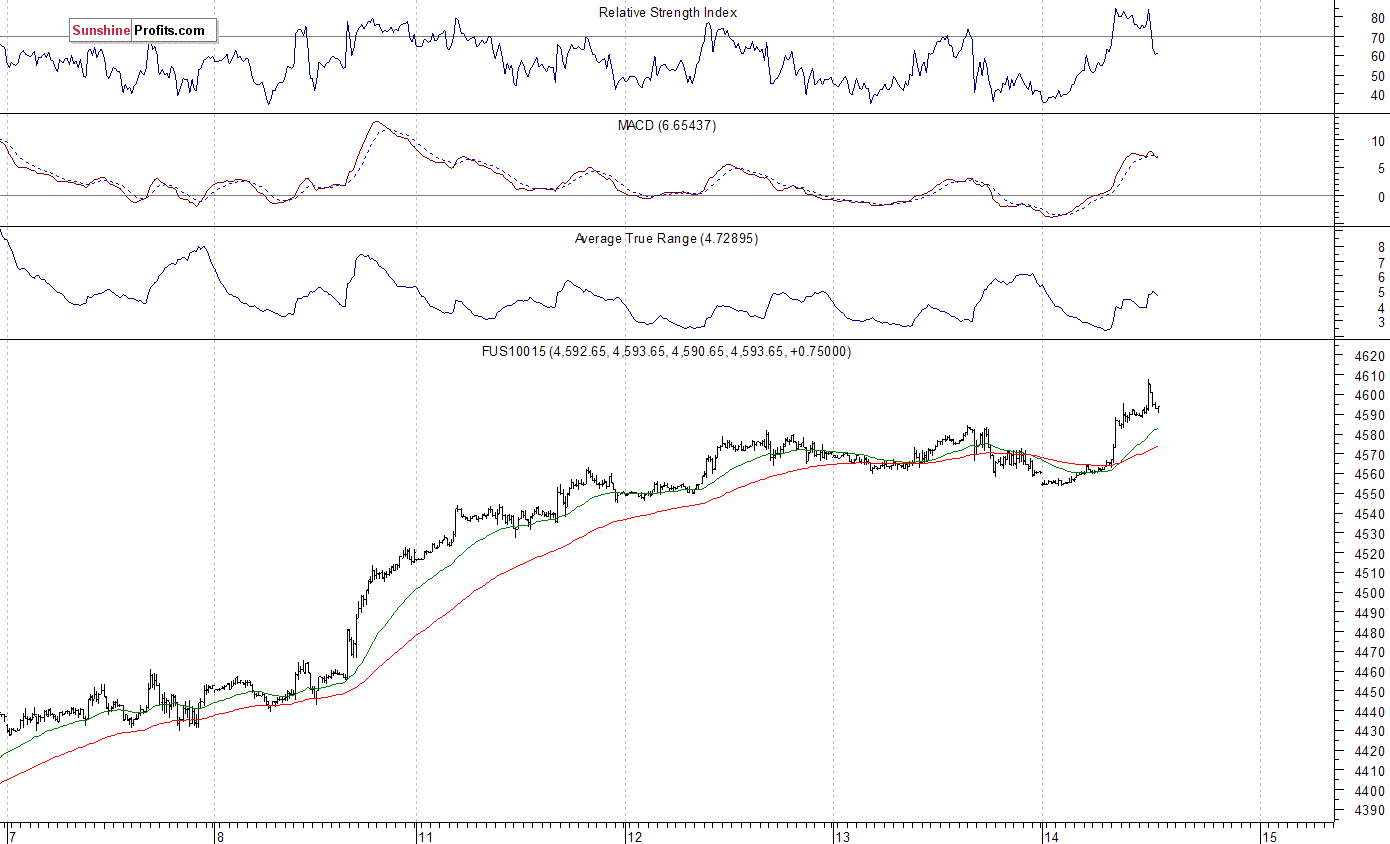
The technology Nasdaq 100 futures contract follows a similar path, as it currently trades closer to 4,600 mark. The nearest important level of resistance is at around 4,600-4,610. On the other hand, support level is at 4,550-4,580, marked by short-term consolidation, as the 15-minute chart shows:
Concluding, the broad stock market slightly extended its short-term uptrend yesterday, as the S&P 500 index remained above the level of 2,150. We still can see short-term overbought conditions accompanied by bearish technical divergences. However, there have been no confirmed negative signals so far. Our speculative short position has been closed on Monday, at stop-loss level of 2,140 (S&P 500 index). We lost 48 index points on that trade, betting against strong short-term uptrend off late June local low at around 2,000. It is always important to set some exit price level in case some events cause the price to move in the unlikely direction. Having safety measures in place helps limit potential losses while letting the gains grow. Currently, we prefer to be out of the market, avoiding low risk/reward ratio trades. We will let you know when we think it is safe to get back in the market.
Thank you.
Paul Rejczak
Stock Trading Strategist
Stock Trading Alerts
