

Stock Trading Alert originally sent to subscribers on May 19, 2016, 6:48 AM.
Briefly: In our opinion, no speculative positions are justified.
Our intraday outlook is neutral, and our short-term outlook is neutral. Our medium-term outlook remains bearish, as the S&P 500 index extends its lower highs, lower lows sequence:
Intraday outlook (next 24 hours): neutral
Short-term outlook (next 1-2 weeks): neutral
Medium-term outlook (next 1-3 months): bearish
Long-term outlook (next year): neutral
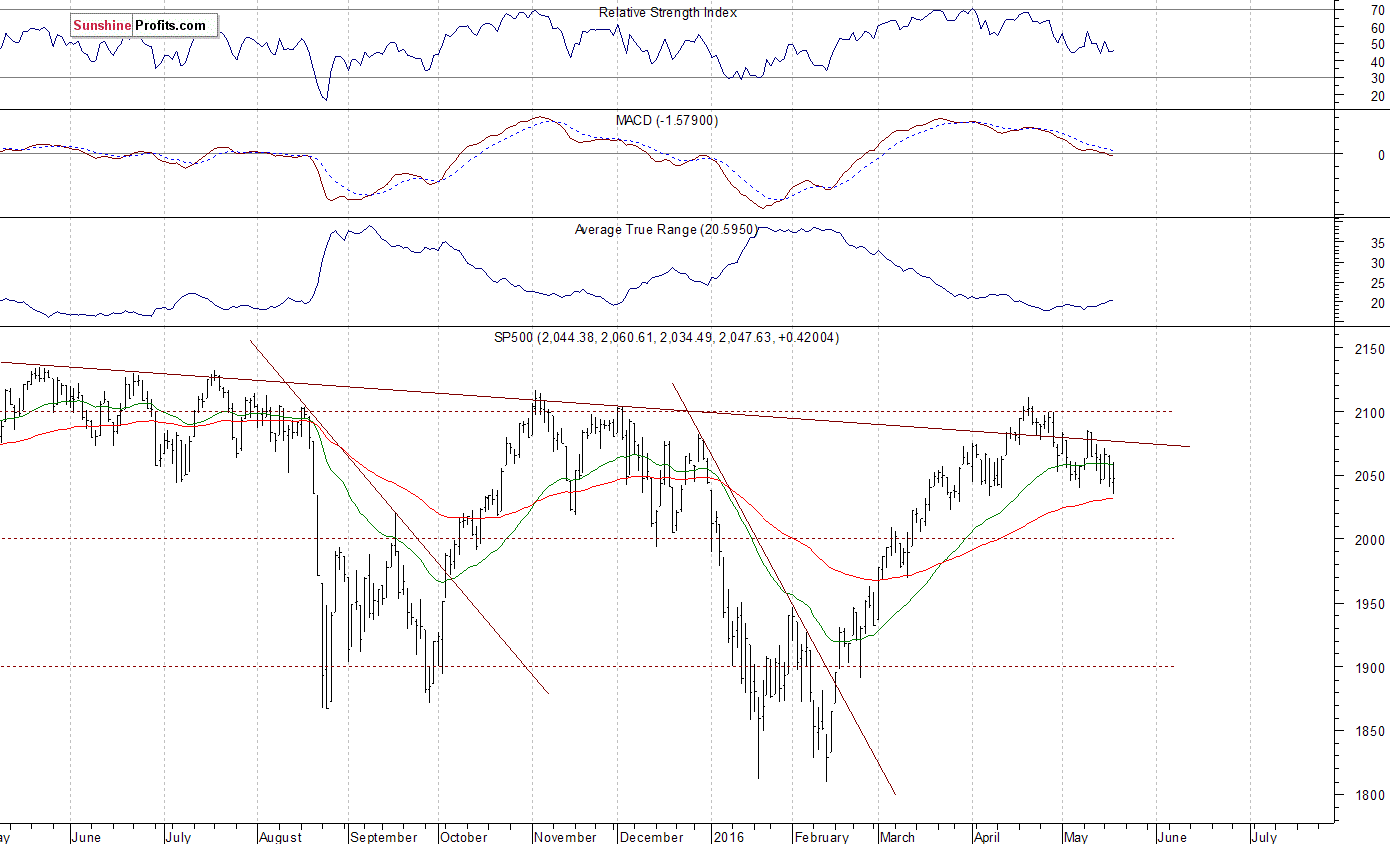
The U.S. stock market indexes were mixed between 0.0% and +0.4% on Wednesday, as investors reacted to the FOMC Minutes release, among others. The S&P 500 index extends its fluctuations along the level of 2,050. The nearest important level of support is at around 2,030-2,040, marked by previous local lows. The next support level is at 2,000-2,020. On the other hand, resistance level is at 2,070-2,085, marked by last week's local highs. The next important level of resistance remains at 2,100-2,110, marked by late April highs. Last year's highs along the level of 2,100 continue to act as a medium-term resistance level. Will the market break above these medium-term highs and continue its seven-year long bull market?
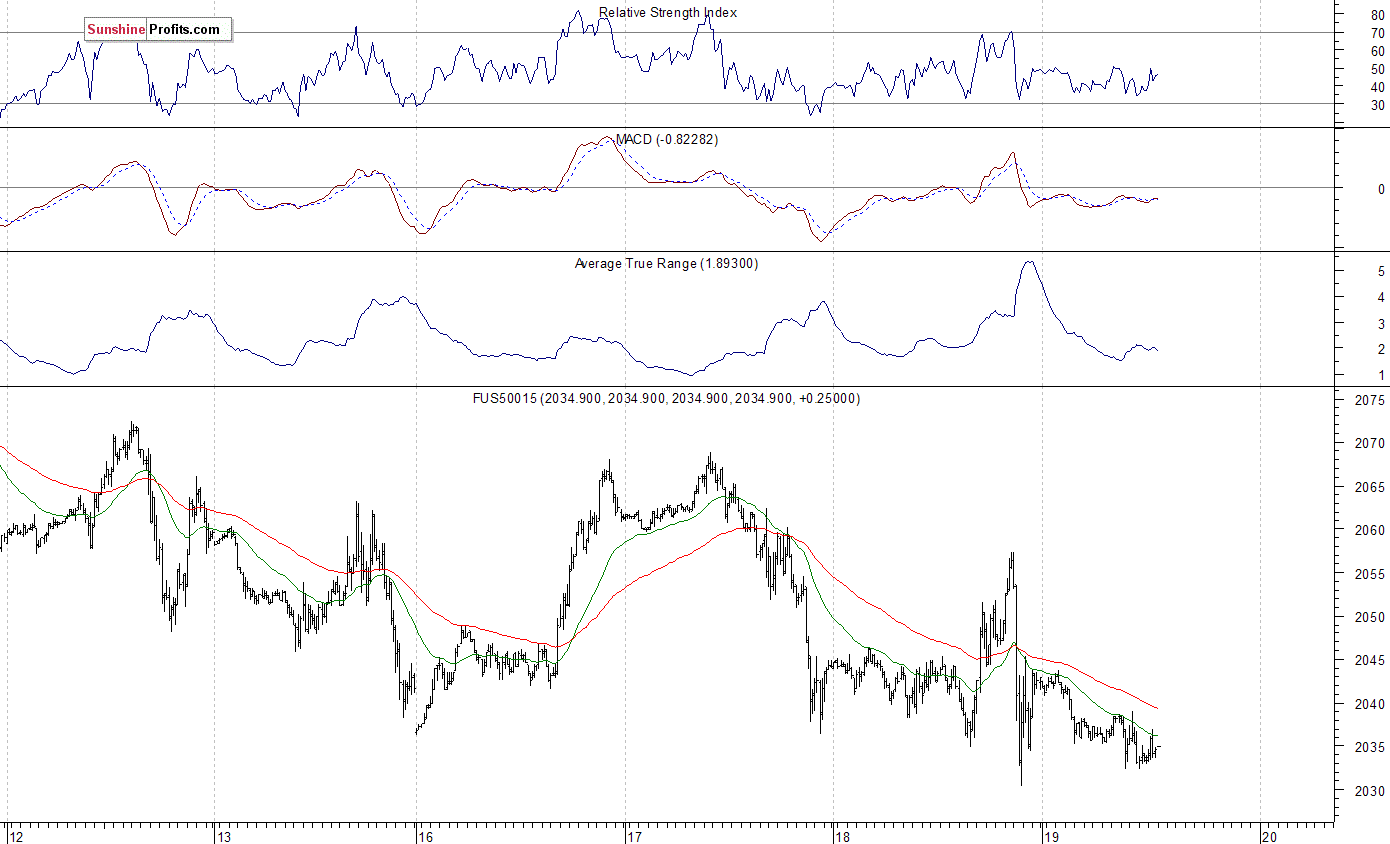
Expectations before the opening of today's trading session are negative, with index futures currently down 0.4%. The European stock market indexes have lost between 0.9% and 1.4% so far. Investors will now wait for some economic data announcements: Initial Claims, Philadelphia Fed number at 8:30 a.m., Leading Indicators at 10:00 a.m. The S&P 500 futures contract trades within an intraday downtrend, following yesterday's volatility. The nearest important level of support is at around 2,030. On the other hand, resistance level is at 2,040-2,050, among others. The market trades along its yesterday's local lows. Will it break lower and continue towards 2,000 mark?
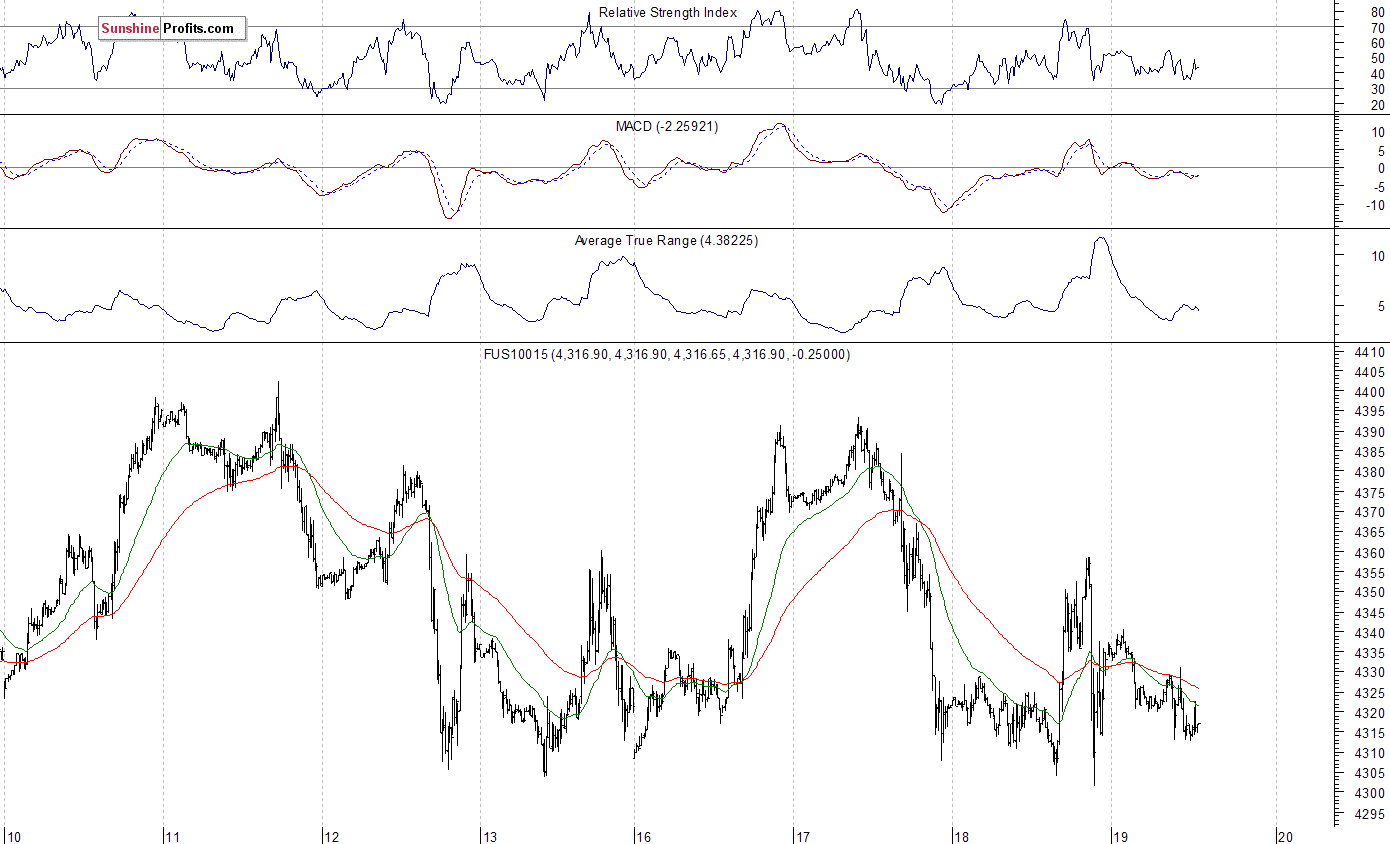
The technology Nasdaq 100 futures contract follows a similar path, as it trades within an intraday downtrend. The nearest important level of support is at 4,300 mark. On the other hand, resistance level is at 4,330-4,350, among others, as we can see on th 15-minute chart:
Concluding, the broad stock market remained within a short-term consolidation yesterday, as the S&P 500 index continued to fluctuate along the level of 2,050. The index remains relatively close to last year's medium-term highs along the level of 2,100 and continues to trade above its late March - early April lows. It still looks like a correction within a medium-term uptrend, so we prefer to be out of the market, avoiding low risk/reward ratio trades. We will let you know when we think it is safe to get back in the market.
Thank you.
Paul Rejczak
Stock Trading Strategist
Stock Trading Alerts
