

Stock Trading Alert originally sent to subscribers on April 4, 2016, 6:39 AM.
Briefly: In our opinion, no speculative positions are justified.
Our intraday outlook is neutral, and our short-term outlook is neutral. Our medium-term outlook remains bearish, as the S&P 500 index extends its lower highs, lower lows sequence:
Intraday outlook (next 24 hours): neutral
Short-term outlook (next 1-2 weeks): neutral
Medium-term outlook (next 1-3 months): bearish
Long-term outlook (next year): neutral
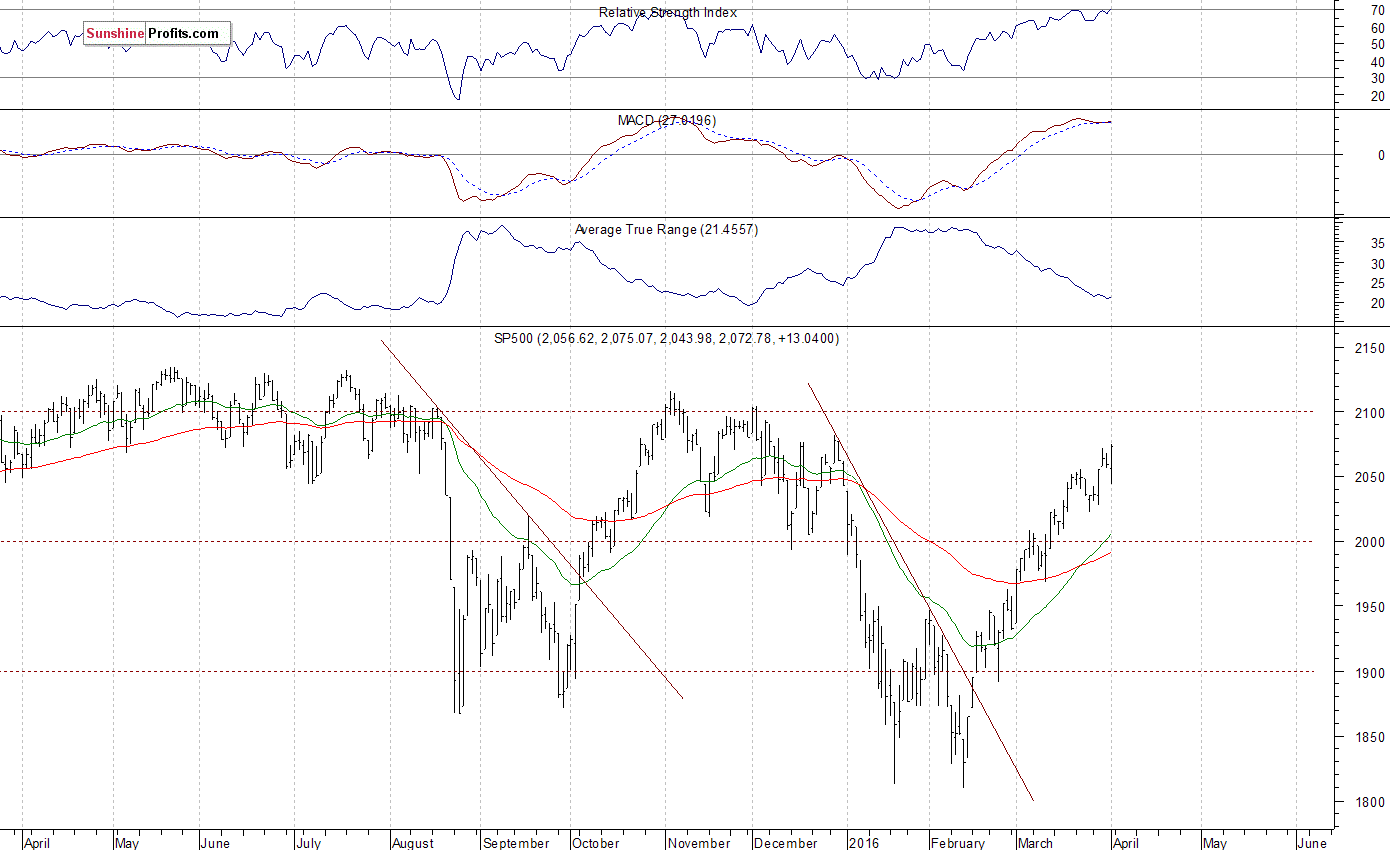
The main U.S. stock market indexes gained 0.6-1.1% on Friday, extending their short-term uptrend, as investors reacted to monthly jobs report release. The S&P 500 index got close to its late December high of 2,081.56. The nearest important level of resistance is at around 2,080. The next resistance level is at 2,100-2,120, marked by previous medium-term highs. On the other hand, support level remains at 2,055-2,060, marked by last week's Wednesday's daily gap up of 2,055.91-2,058.27. The next support level remains at 2,000, marked by previous level of resistance. There have been no confirmed negative signals so far. However, we can see technical overbought conditions. The index continues to trade within a slightly descending medium-term trading channel, as the daily chart shows:
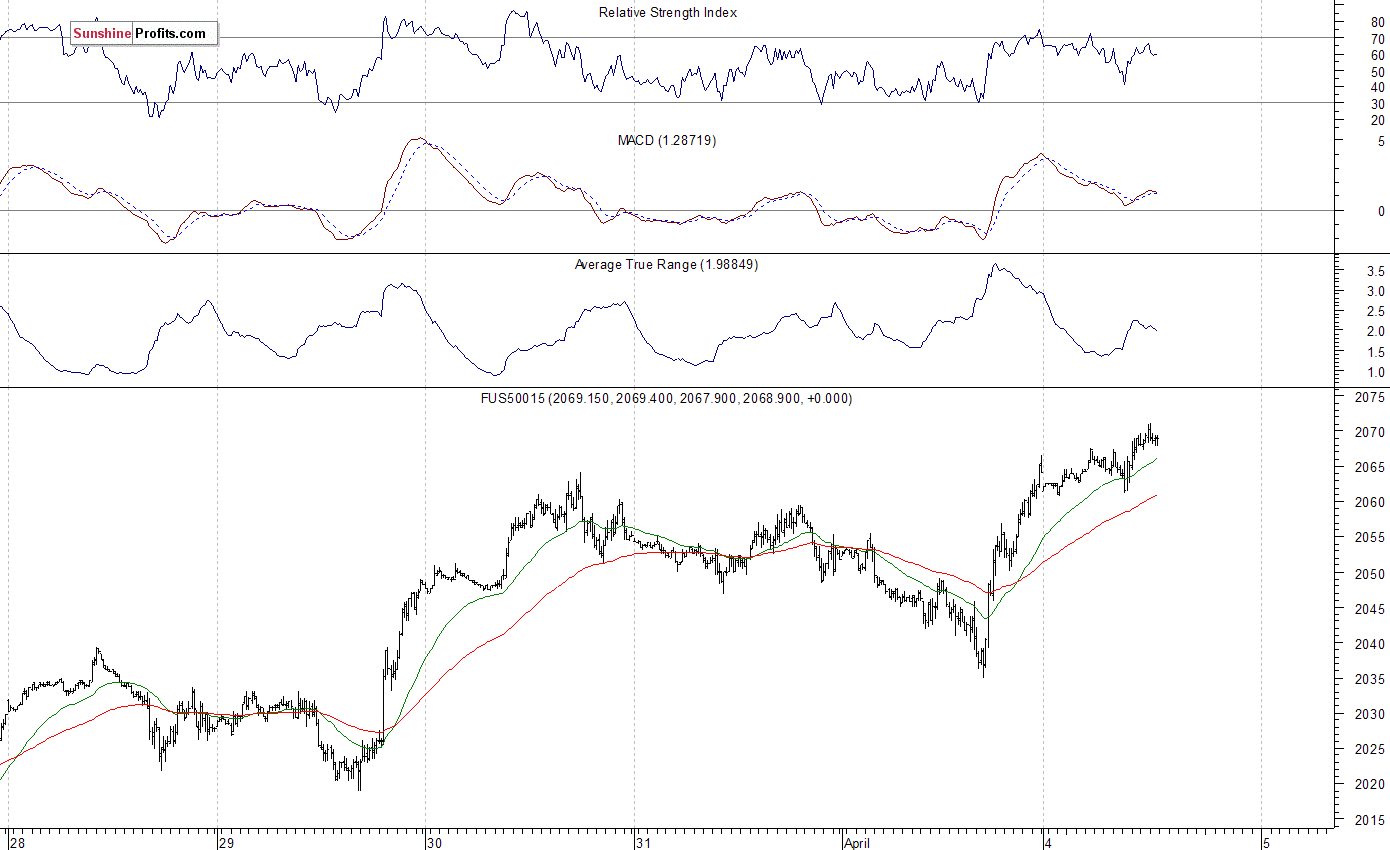
Expectations before the opening of today's trading session are positive, with index futures currently up %. The European stock market indexes have gained % so far. Investors will now wait the Factory orders data release at 10:00 a.m. The S&P 500 futures contract trades within an intraday uptrend, as it reaches new short-term highs. The nearest important level of resistance is at around 2,075-2,080, marked by some previous medium-term local highs. The nearest important level of support is at 2,050, and the next support level is at 2,030, marked by recent local low, as the 15-minute chart shows:
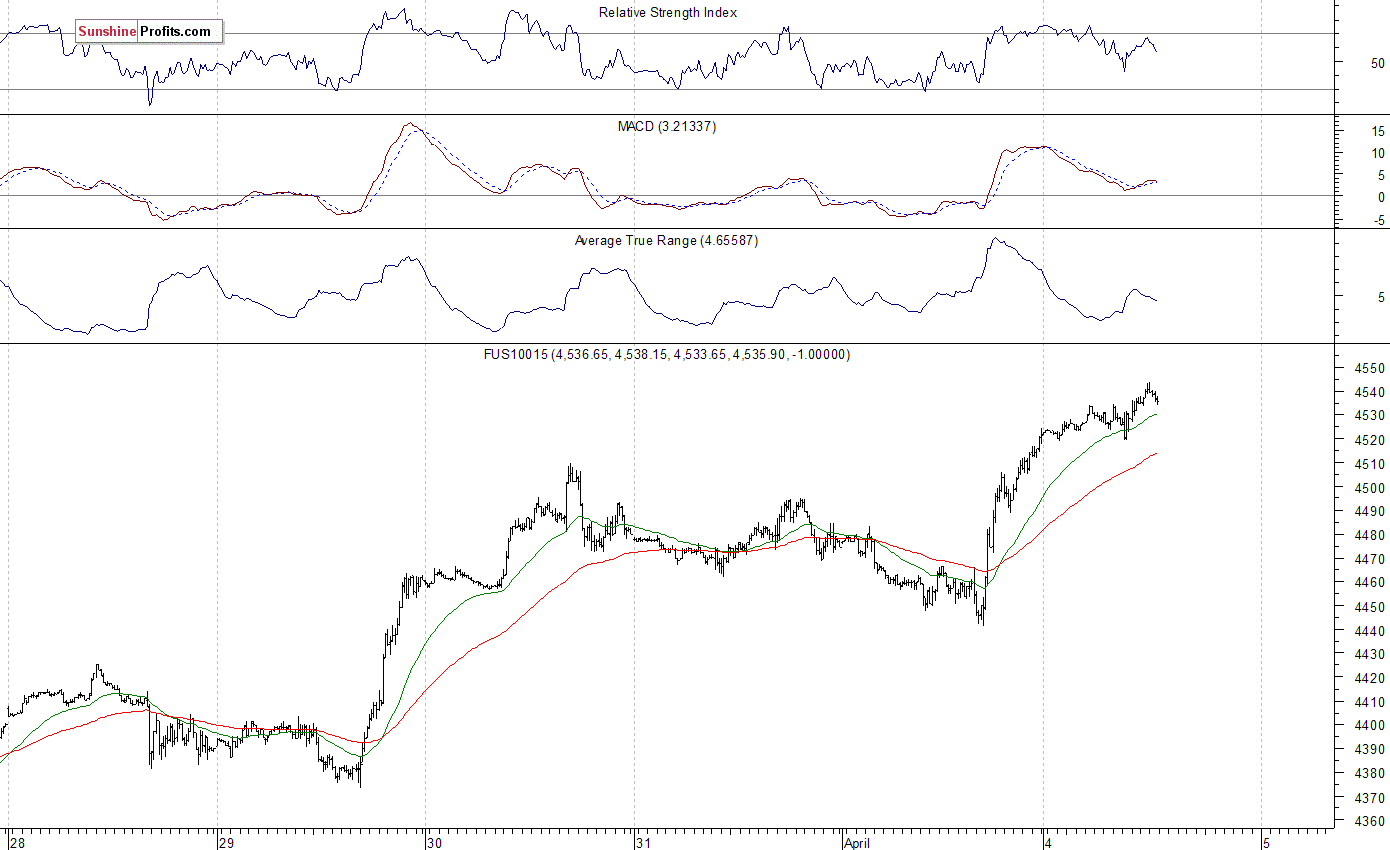
The technology Nasdaq 100 futures contract follows a similar path, as it extends its short-term uptrend. The nearest important level of support is at around 4,500, marked by previous resistance level. On the other hand, potential resistance level is at 4,600. There have been no confirmed negative signals so far. However, we can see short-term overbought conditions:
Concluding, the broad stock market continued its short-term uptrend on Friday, as investors reacted to monthly jobs data announcement, among others. The S&P 500 index is getting closer to its last year's medium-term highs. Will it break above the crucial long-term resistance level of 2,100-2,150 this time? Or is this just an upward move within a slightly descending medium-term trading channel? We can see some short-term technical overbought conditions. However, there have been no confirmed negative signals. We still prefer to be out of the market, avoiding low risk/reward ratio trades. We will let you know when we think it is safe to get back in the market.
Thank you.
Paul Rejczak
Stock Trading Strategist
Stock Trading Alerts
