

Stock Trading Alert originally sent to subscribers on November 30, 2015, 6:28 AM.
Briefly: In our opinion, speculative short positions are favored (with stop-loss at 2,140 and profit target at 1,990, S&P 500 index)
Our intraday outlook is bearish, and our short-term outlook is bearish:
Intraday outlook (next 24 hours): bearish
Short-term outlook (next 1-2 weeks): bearish
Medium-term outlook (next 1-3 months): bearish
Long-term outlook (next year): bullish
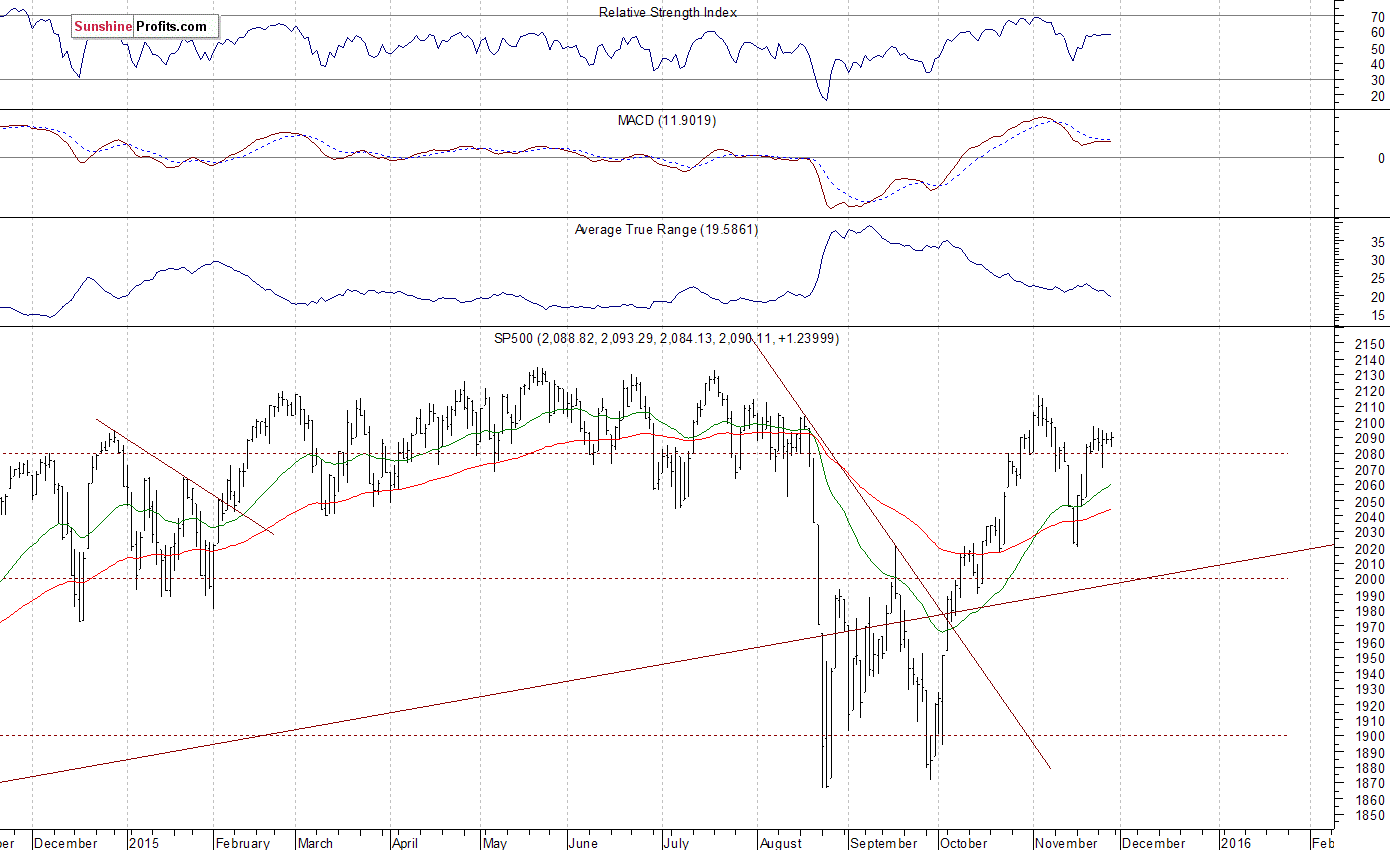
The main U.S. stock market indexes were virtually flat on Friday, as investors had a long holiday weekend. The S&P 500 index continues to fluctuate following recent move up. The nearest important level of resistance is at around 2,100, and the next resistance level is at 2,130, marked by late May all-time high. On the other hand, support level is at 2,070, and the next support level is at 2,020-2,050, marked by previous local lows. For now, it looks like a consolidation following October rally:
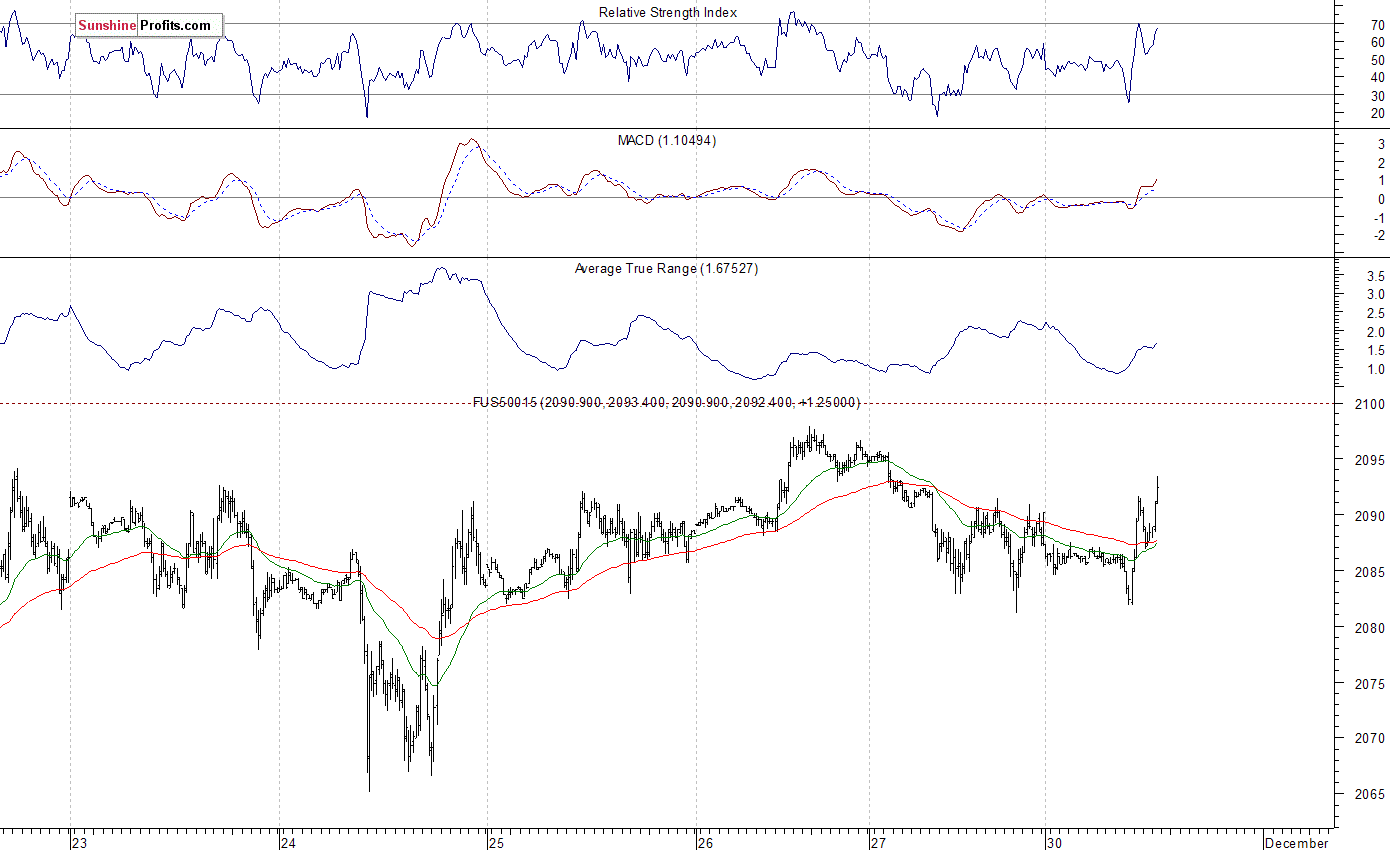
Expectations before the opening of today's trading session are positive, with index futures currently up 0.2-0.3%. The European stock market indexes have been mixed so far. Investors will now wait for some economic data announcements: Chicago PMI at 9:45, Pending Home Sales at 10:00 a.m. The S&P 500 futures contract (CFD) trades within an intraday uptrend, as it retraces Friday's slight retreat. The nearest important level of support is at around 2,080. On the other hand, resistance level is at 2,100, among others, as the 15-minute chart shows:
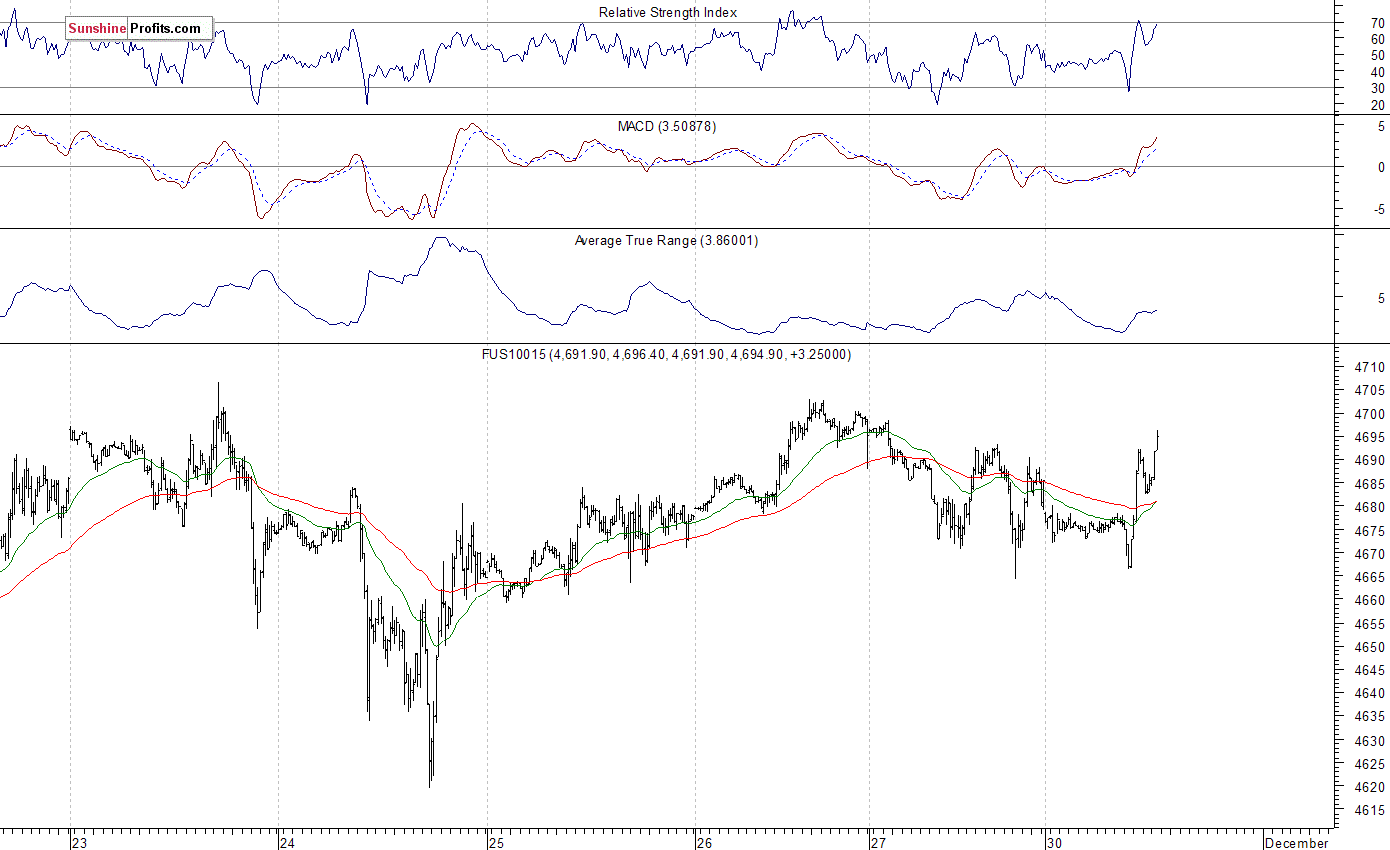
The technology Nasdaq 100 futures contract (CFD) follows a similar path, as it currently trades slightly below the level of 4,700. The nearest important level of resistance is at 4,700-4,710, and support level is at 4,660-4,670, as we can see on the 15-minute chart:
Concluding, the broad stock market extended its short-term fluctuations on Friday, as the S&P 500 index remained just below the level of 2,100. Despite recent rally, there have been no confirmed positive signals so far. Therefore, we continue to maintain our speculative short position (2,088.35, S&P 500 index). Stop-loss is at 2,140 and potential profit target is at 1,990 (S&P 500 index). You can trade S&P 500 index using futures contracts (S&P 500 futures contract - SP, E-mini S&P 500 futures contract - ES) or an ETF like the SPDR S&P 500 ETF - SPY. It is always important to set some exit price level in case some events cause the price to move in the unlikely direction. Having safety measures in place helps limit potential losses while letting the gains grow.
Thank you.
Paul Rejczak
Stock Trading Strategist
Stock Trading Alerts
