

Stock Trading Alert originally sent to subscribers on October 1, 2015, 6:46 AM.
Briefly: In our opinion, speculative long positions are favored (with stop-loss at 1,810, and profit target at 2,020, S&P 500 index)
Our intraday outlook is bullish, and our short-term outlook is bullish:
Intraday outlook (next 24 hours): bullish
Short-term outlook (next 1-2 weeks): bullish
Medium-term outlook (next 1-3 months): bearish
Long-term outlook (next year): bullish
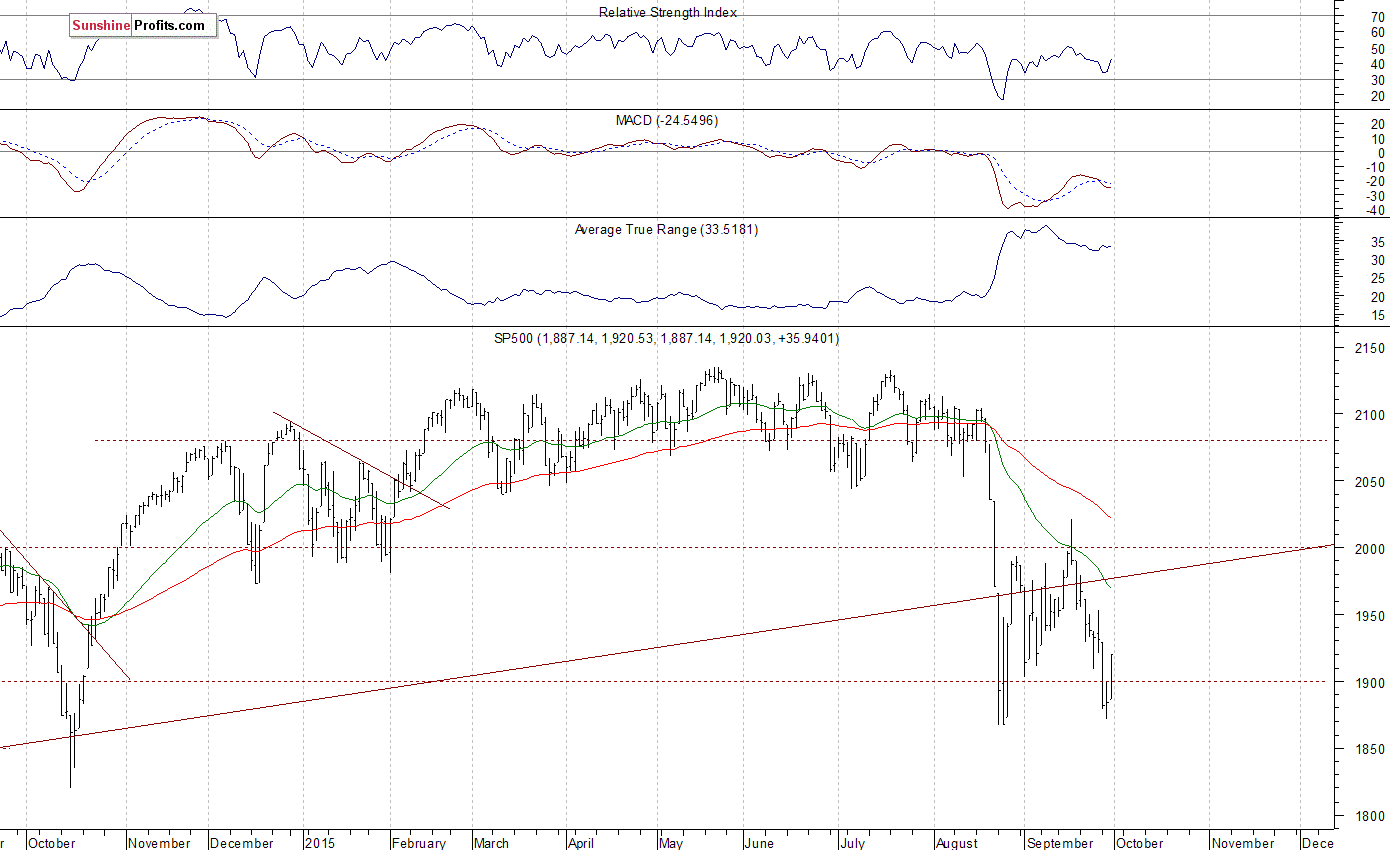
The U.S. stock market indexes gained 1.5-2.4% on Wednesday, as investors hunted for bargains, following recent move down. The S&P 500 index bounced off support level at around 1,860-1,870, marked by late August low. The nearest important level of resistance is at 1,950, and support level is currently at 1,900. There have been no confirmed positive signals so far, however, we can see some positive technical divergences:
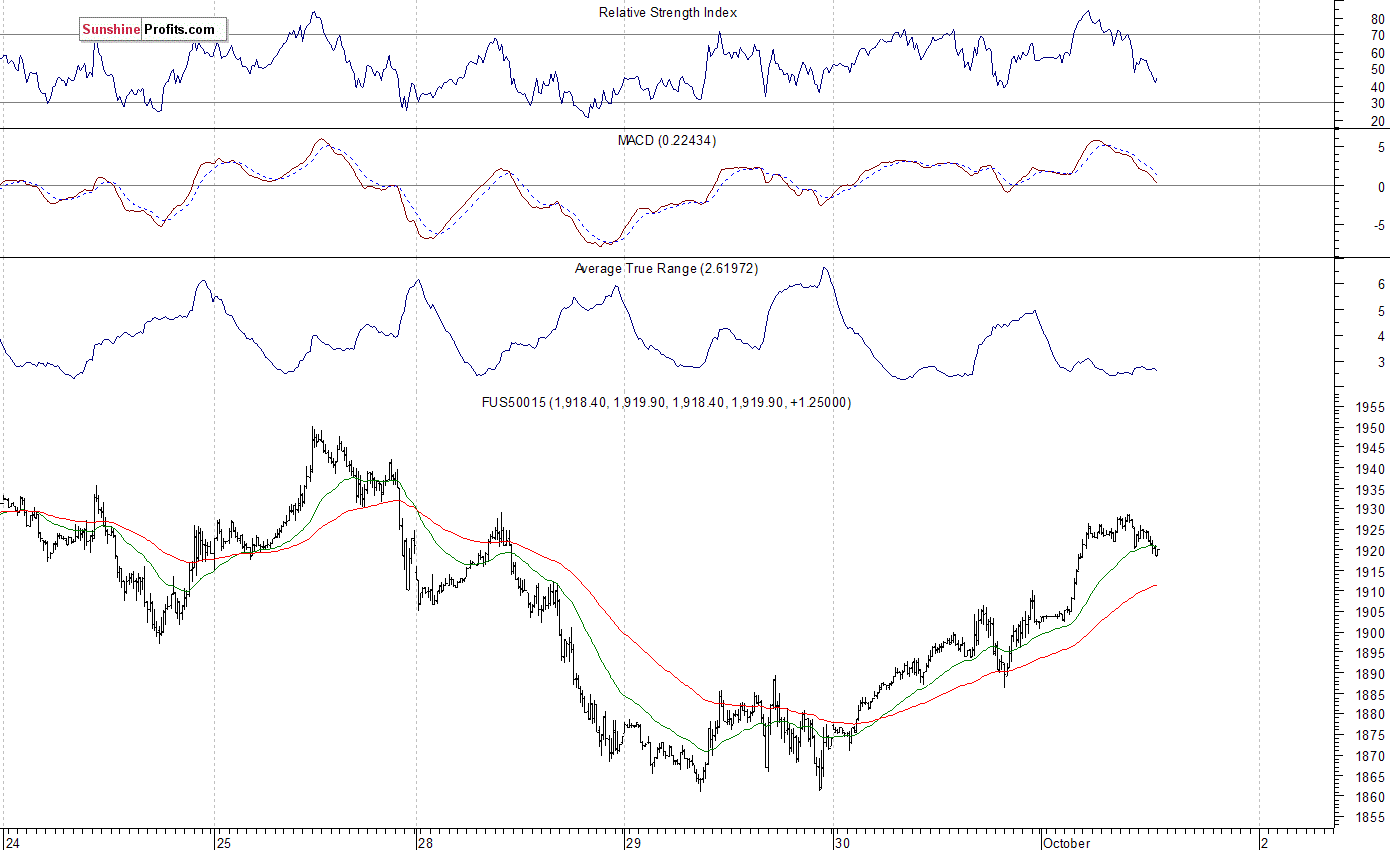
Expectations before the opening of today's trading session are positive, with index futures currently up 0.6-0.8%. The European stock market indexes have gained 0.1-1.1% so far. Investors will now wait for some economic data announcements: Initial Claims at 8:30 a.m., ISM Index, Construction Spending at 10:00 a.m. The S&P 500 futures contract (CFD) trades within an intraday consolidation, following yesterday's rebound. The nearest important level of resistance is at 1,930-1,950, marked by previous local highs. On the other hand, support level remains at 1,900, among others, as the 15-minute chart shows:
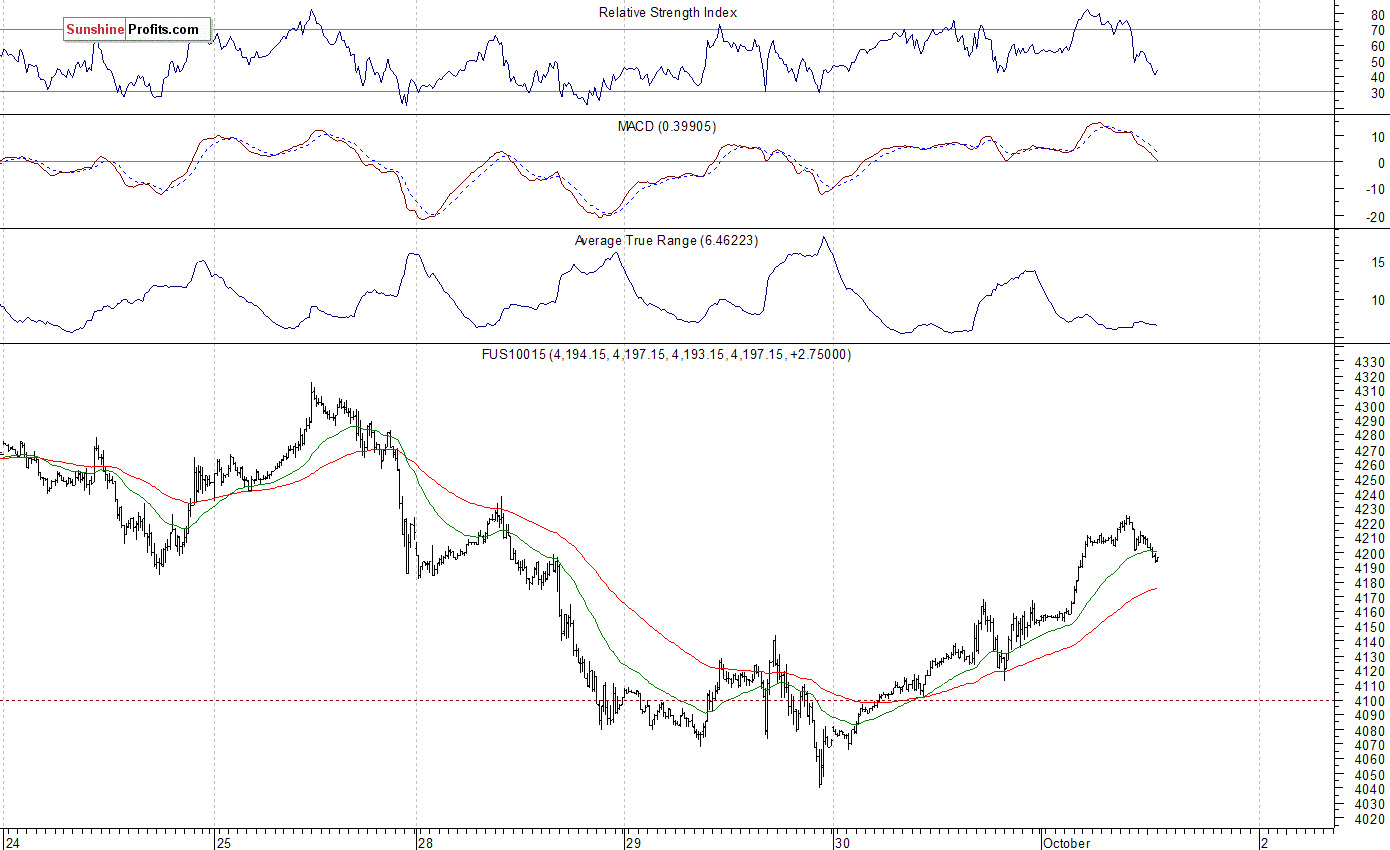
The technology Nasdaq 100 futures contract (CFD) follows a similar path, as it currently trades along the level of 4,200. The nearest important level of support is at 4,150, as we can see on the 15-minute chart:
Concluding, the broad stock market bounced off its medium-term support level yesterday, and the S&P 500 index broke above resistance level of 1,900. There have been no confirmed positive signals so far. However, we continue to maintain our already profitable speculative long position (1,881.90, S&P 500 index), as we expect an upward correction or downtrend reversal. Stop-loss is at 1,810, and potential profit target is at 2,020. You can trade S&P 500 index using futures contracts (S&P 500 futures contract - SP, E-mini S&P 500 futures contract - ES) or an ETF like the SPDR S&P 500 ETF - SPY. It is always important to set some exit price level in case some events cause the price to move in the unlikely direction. Having safety measures in place helps limit potential losses while letting the gains grow.
Thank you.
Paul Rejczak
Stock Trading Strategist
Stock Trading Alerts
