

Stock Trading Alert originally sent to subscribers on September 28, 2015, 6:48 AM.
Briefly: In our opinion, no speculative positions are justified
Our intraday outlook is neutral, and our short-term outlook is neutral:
Intraday outlook (next 24 hours): neutral
Short-term outlook (next 1-2 weeks): neutral
Medium-term outlook (next 1-3 months): bearish
Long-term outlook (next year): bullish
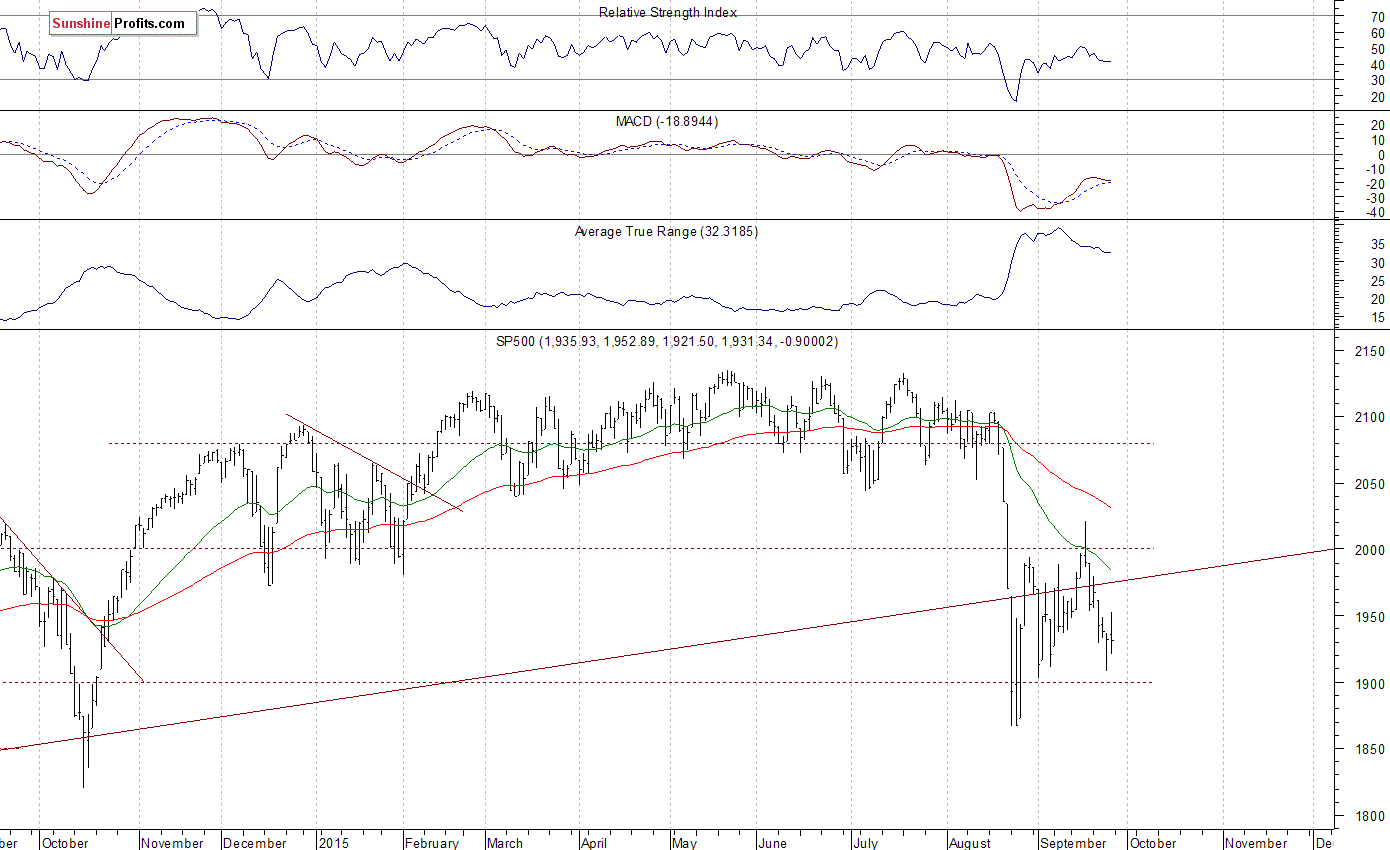
The U.S. stock market indexes were mixed between -0.9% and +0.7% on Friday, as investors reacted to economic data releases. The S&P 500 index extends its short-term consolidation following late August sell-off. The nearest important level of support is at around 1,900-1,920, marked by local lows. On the other hand, resistance level is at 1,950, and the next important level of resistance is at 2,000. There have been no confirmed positive signals so far. It looks like a correction within a medium-term downtrend:
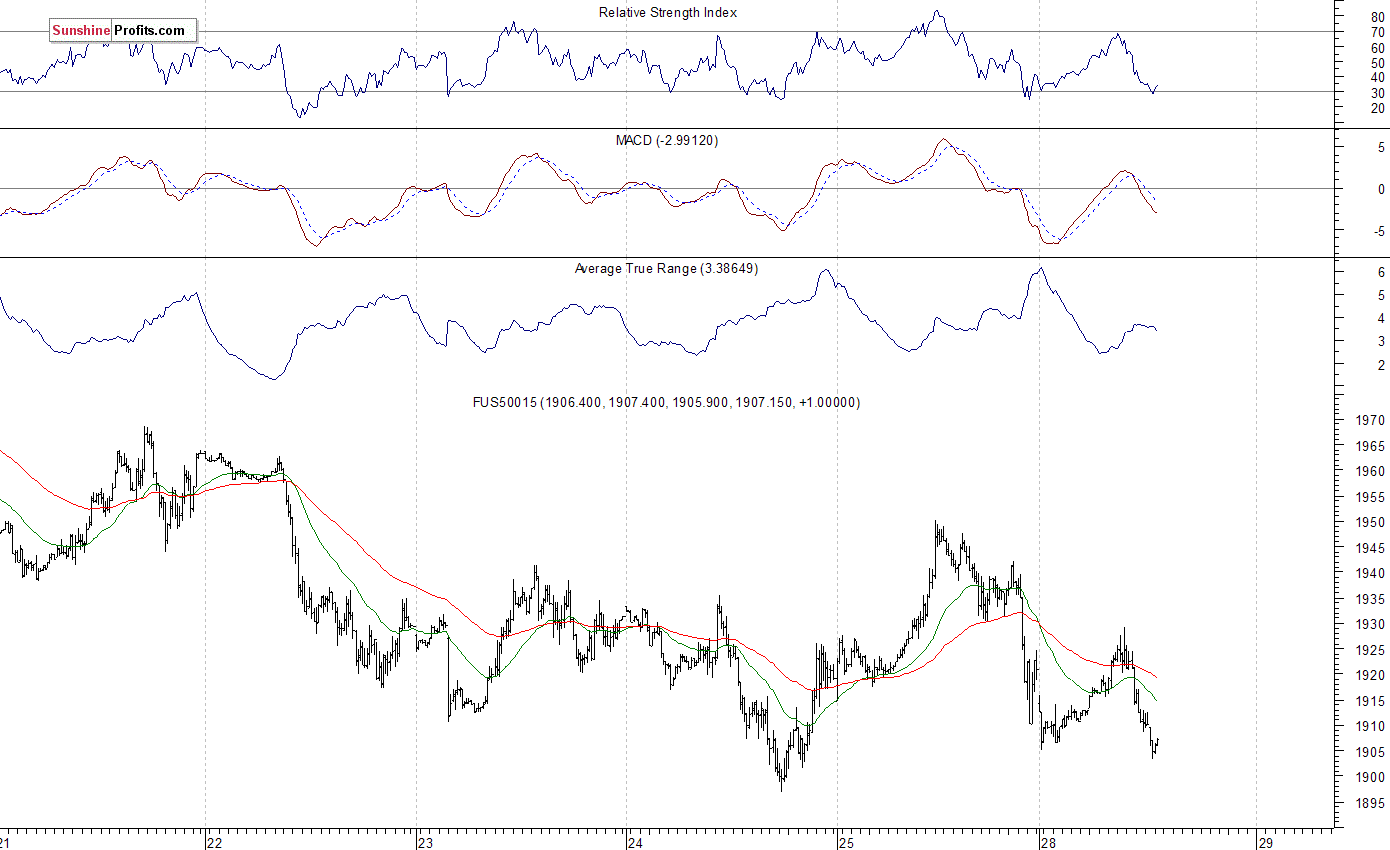
Expectations before the opening of today's trading session are negative, with index futures currently down 0.6%. The European stock market indexes have lost 1.4-2.1% so far. Investors will now wait for some economic data announcements: Personal Income, Personal Spending, PCE - Prices Core number at 8:30 a.m., Pending Home Sales at 10:00 a.m. The S&P 500 futures contract (CFD) trades within an intraday downtrend, as it gets closer to a potential support level of 1,900. The nearest important level of resistance remains at around 1,930-1,950, as the 15-minute chart shows:
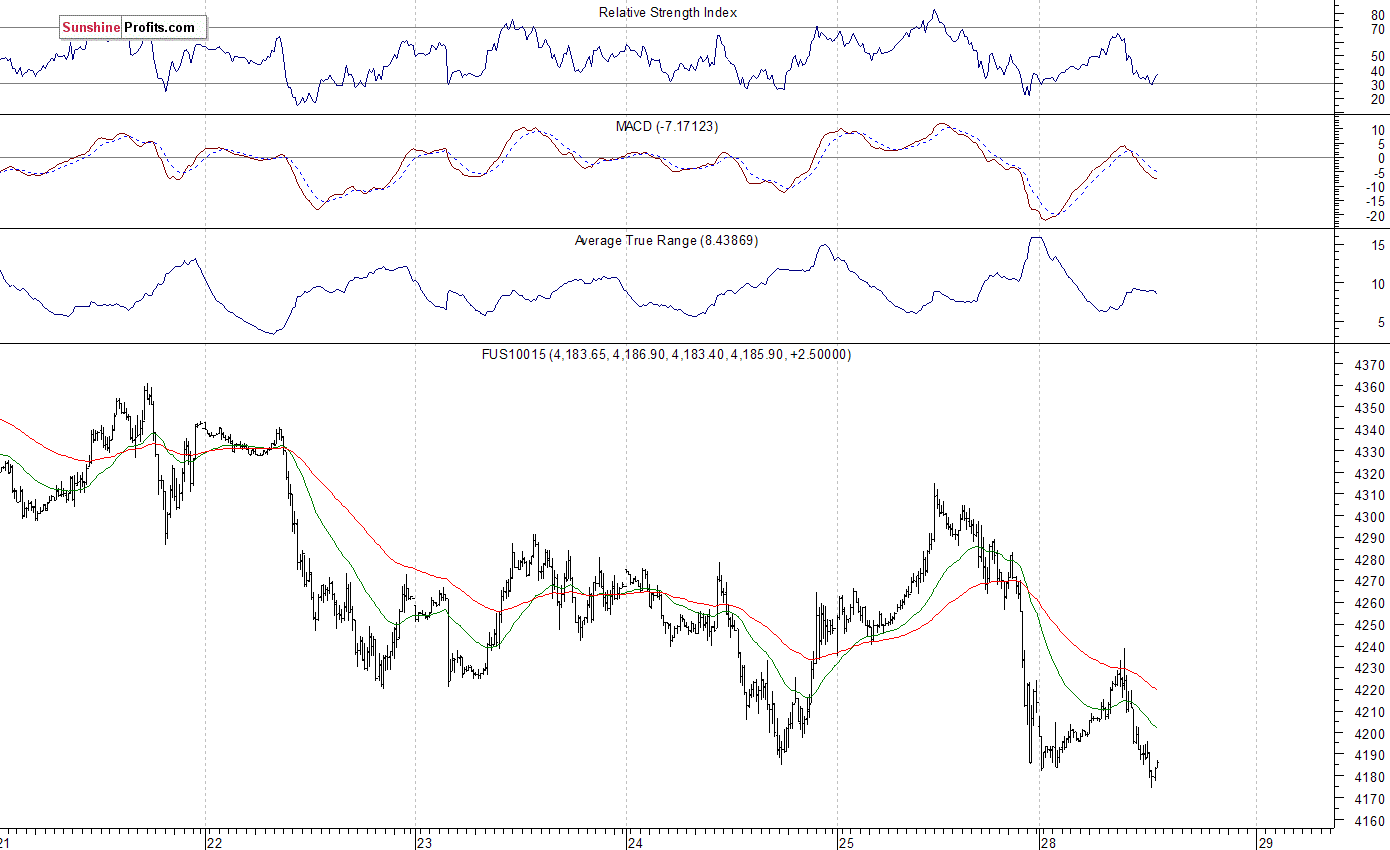
The technology Nasdaq 100 futures contract (CFD) follows a similar path, as it trades below the level of 4,200. The nearest important level of support is at 4,100-4,150, marked by previous local lows. On the other hand, resistance level is at around 4,240-4,250, as we can see on the 15-minute chart:
Concluding, the broad stock market continues to fluctuate following its late August sell-off. There have been no confirmed positive signals so far. It looks like an upward correction within a medium-term downtrend. We prefer to be out of the market, avoiding low risk/reward ratio trades. We will let you know when we think it is safe to get back in the market.
Thank you.
Paul Rejczak
Stock Trading Strategist
Stock Trading Alerts
