

Stock Trading Alert originally sent to subscribers on June 15, 2015, 6:25 AM.
Briefly: In our opinion, speculative short positions are favored (with stop-loss at 2,140, and profit target at 1,980, S&P 500 index)
Our intraday outlook is bearish, and our short-term outlook is bearish:
Intraday outlook (next 24 hours): bearish
Short-term outlook (next 1-2 weeks): bearish
Medium-term outlook (next 1-3 months): neutral
Long-term outlook (next year): bullish
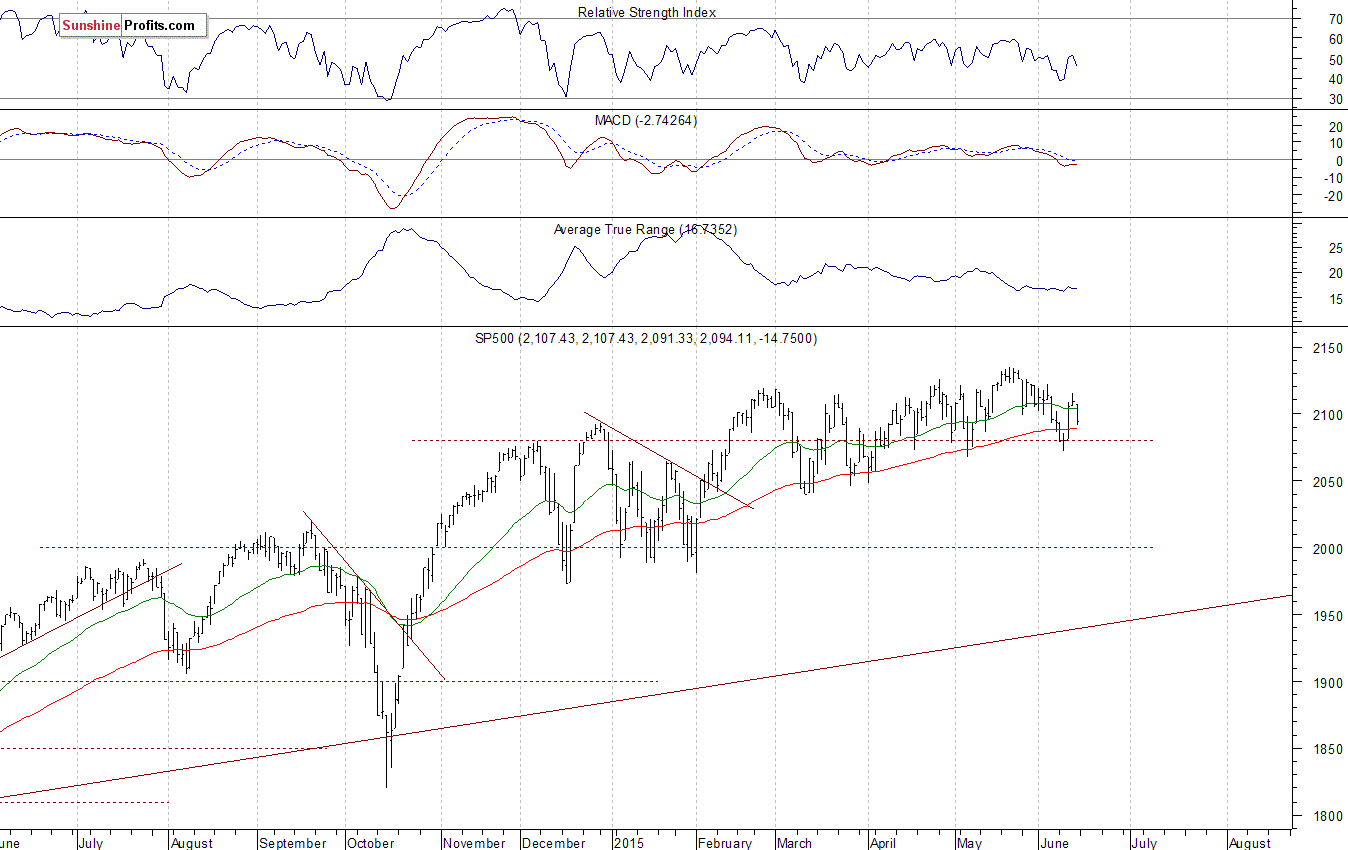
The U.S. stock market indexes lost 0.7-0.8% on Friday, as investors reacted to news concerning Greece debt deal talks, among others. Our Friday's negative intraday outlook has proved accurate. The S&P 500 index broke below the level of 2,100 again. The nearest important level of resistance is at 2,100 and the next resistance level is at 2,110-2,115, marked by local highs. On the other hand, support level remains at 2,070-2,080, marked by previous local low, as we can see on the daily chart:
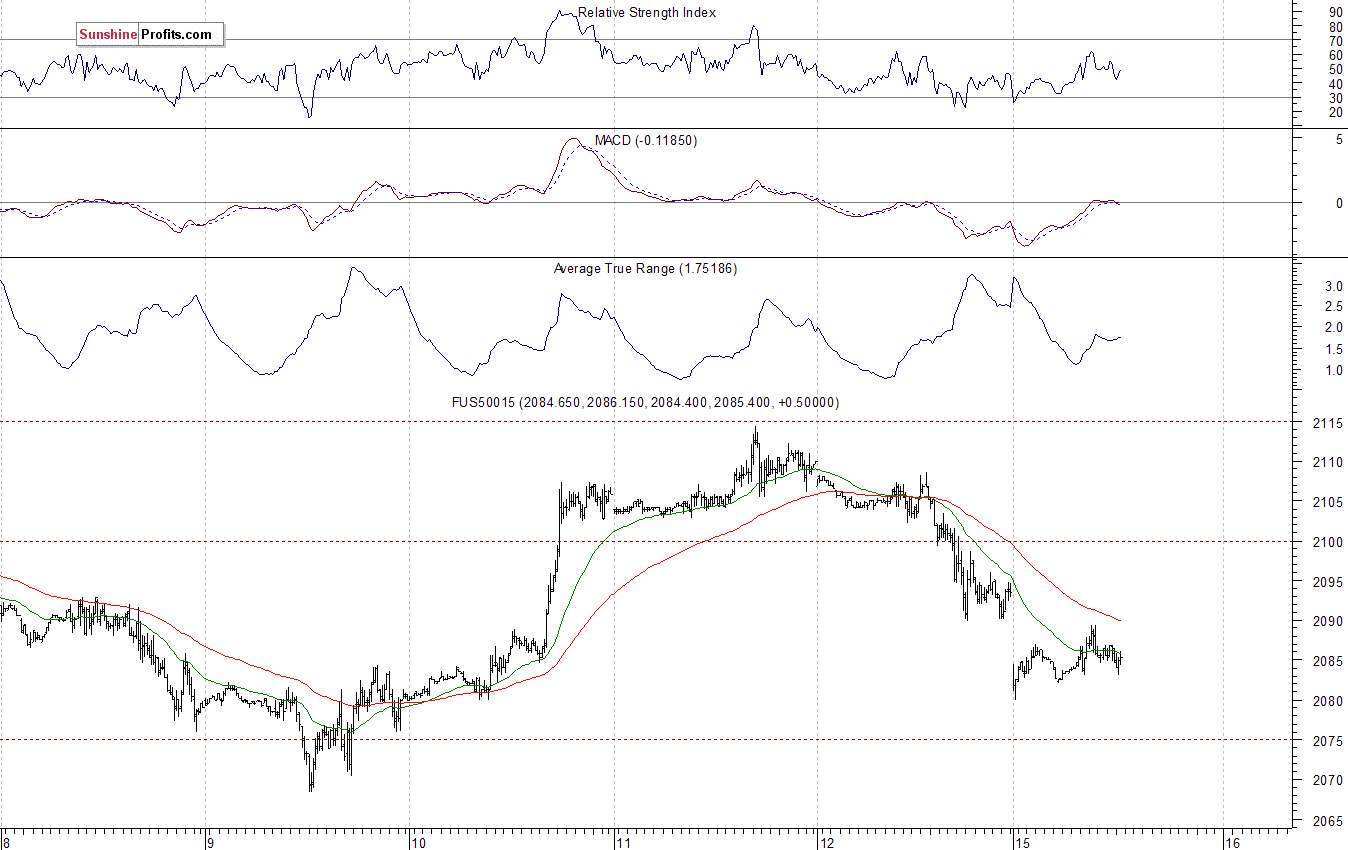
Expectations before the opening of today's trading session are negative, with index futures currently down 0.4-0.5%. The main European stock market indexes have lost 0.8-1.5% so far. Investors will now wait for some economic data announcements: Empire Manufacturing number at 8:30 a.m., Industrial Production, Capacity Utilization at 9:15 a.m., NAHB Housing Market Index at 10:00 a.m. The S&P 500 futures contract (CFD) trades within an intraday consolidation, following lower opening. The nearest important level of resistance is at around 2,085-2,090, and support level is at 2,080:
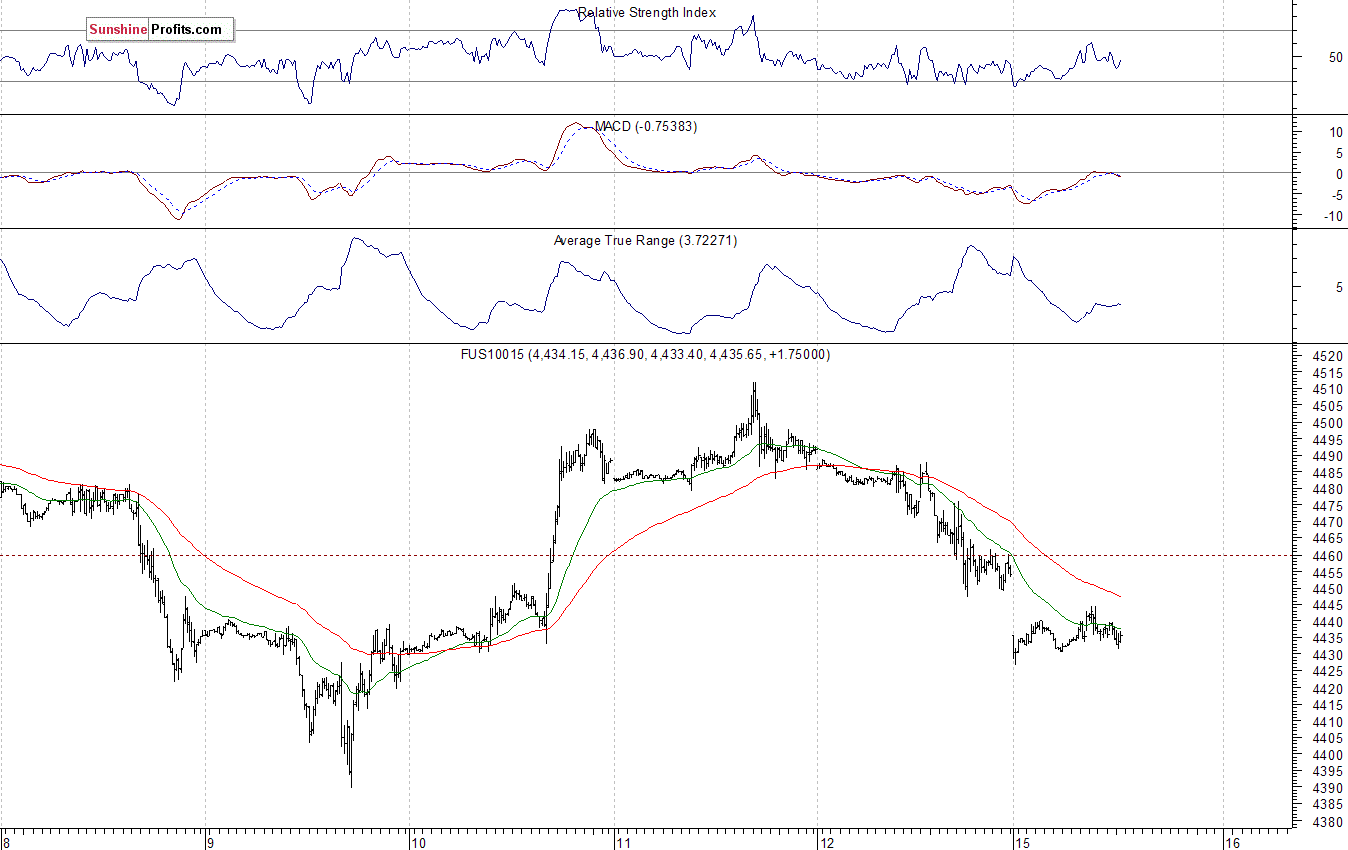
The technology Nasdaq 100 futures contract (CFD) is in an intraday consolidation, as it trades along the level of 4,430. The nearest important level of support is at 4,425, marked by local low. On the other hand, level of resistance is at 4,445-4,450, as the 15-minute chart shows:
Concluding, the broad stock market extended its short-term fluctuations on Friday, as the S&P 500 index broke below the level of 2,100 again. We continue to maintain our speculative short position (2,098.27, S&P 500 index), as we expect a downward correction or an uptrend reversal. Stop-loss is at 2,140, and potential profit target is at 1,980. You can trade S&P 500 index using futures contracts (S&P 500 futures contract - SP, E-mini S&P 500 futures contract - ES) or an ETF like the SPDR S&P 500 ETF - SPY. It is always important to set some exit price level in case some events cause the price to move in the unlikely direction. Having safety measures in place helps limit potential losses while letting the gains grow.
Thank you.
Paul Rejczak
Stock Trading Strategist
Stock Trading Alerts
