
Stock Trading Alert originally sent to subscribers on September 4, 2014, 6:54 AM.
Briefly: In our opinion, speculative short positions are favored (entry point at 2,000.5 with stop-loss at 2,030 and a profit target at 1,900, S&P 500 index)
Our intraday outlook is bearish, and our short-term outlook is bearish:
Intraday
(next 24 hours) outlook: bearish
Short-term (next 1-2 weeks) outlook: bearish
Medium-term (next 1-3 months) outlook: neutral
Long-term outlook (next year): bullish
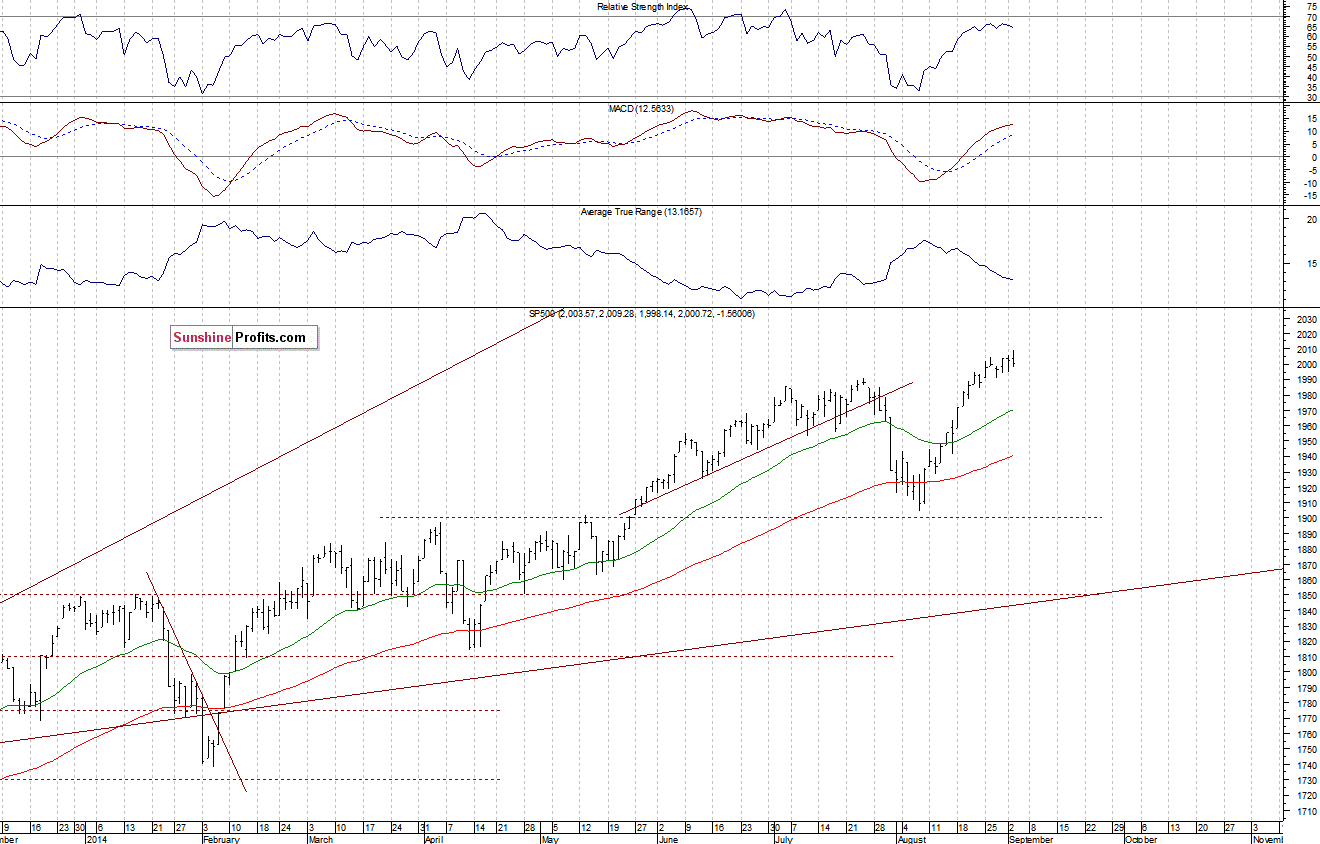
The U.S. stock market indexes were mixed between -0.6% and +0.1% on Wednesday, extending their short-term consolidation, as investors took some profits off the table following recent rally. However, the S&P 500 index has managed to reach yet another new record high at 2,009.28. The resistance level remains at around 2,000-2,010, marked by recent highs. On the other hand, the nearest important level of support is at 1,990-1,995, and the next support level is at 1,980-1,985, among others. There have been no confirmed negative signals so far, however, we can see negative technical divergences accompanied by some overbought conditions:
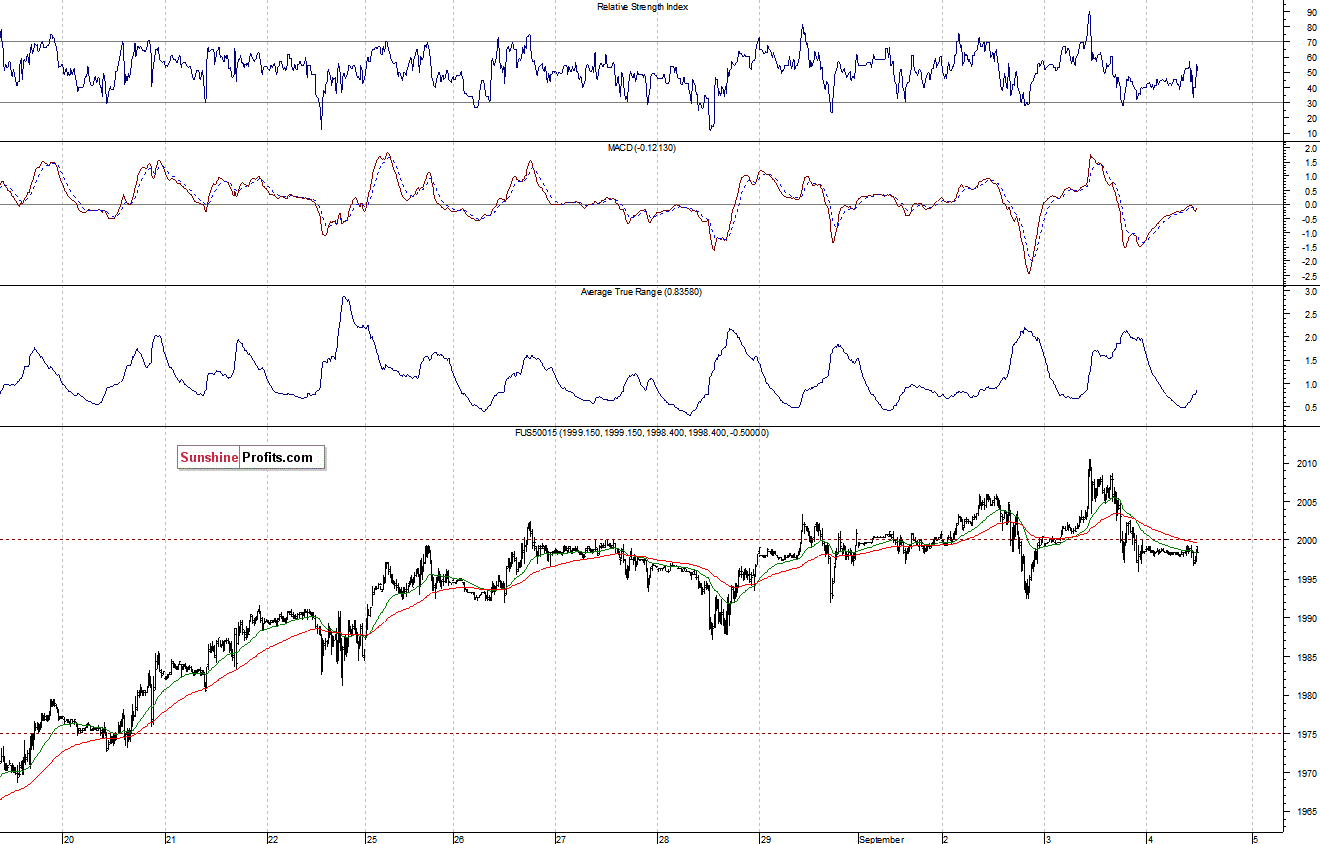
Expectations before the opening of today’s session are virtually flat. The main European stock market indexes have been mixed between -0.8% and +0.1% so far. Investors will now wait for series of economic data announcements: Challenger Job Cuts report at 7:30 a.m., ADP Employment Change at 8:15 a.m., Initial Claims, Trade Balance, Productivity at 8:30 a.m., ISM Services at 10:00 a.m. The ADP (Automatic Data Processing) National Employment Report is a measure of employment derived from an anonymous subset of roughly half a million U.S. business clients. It is considered as a timely and accurate resource for estimates in labor market movements. The S&P 500 futures contract (CFD) continues to trade along the level of 2,000. The resistance level is at around 2,005-2,010, marked by recent local highs. On the other hand, the level of support is at 1,990-1,995, marked by local lows, as we can see on the 15-minute chart:
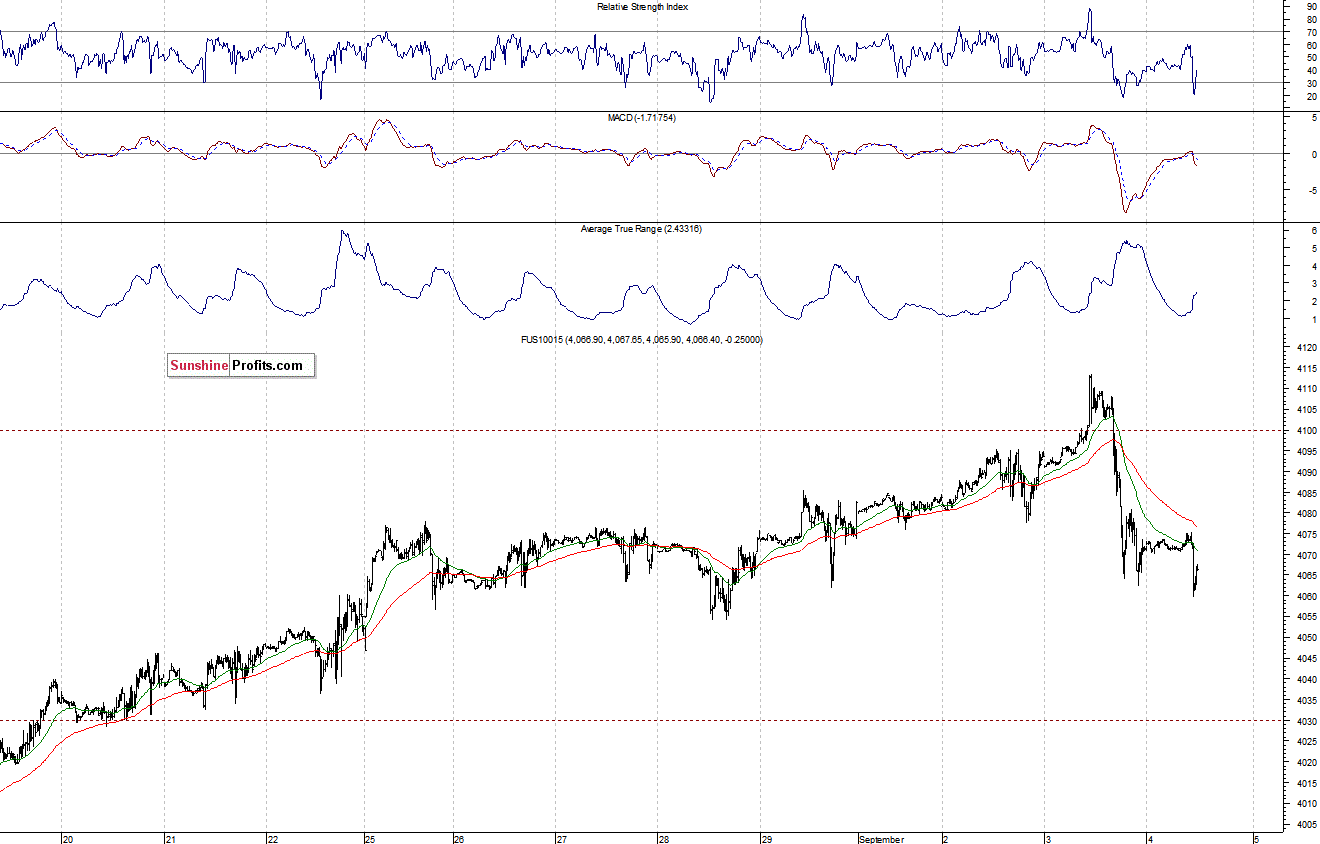
The technology Nasdaq 100 futures contract (CFD) is in an intraday consolidation, as it fluctuates above the level of support at 4,060. The nearest important resistance level is at around 4,080-4,100. For now, it looks like a downward correction within short-term uptrend, as the 15-minute chart shows:
Concluding, the broad stock market remains relatively close to all-time high as the S&P 500 index continues to fluctuate along the level of 2,000. There have been no confirmed negative signals. However, we remain bearish, expecting a downward correction or uptrend reversal. We continue to maintain our speculative short position with entry point at 2,000.5 (S&P 500 index). The stop-loss is at the level of 2,030 and potential profit target is at 1,900 (S&P 500 index).
Thank you.
Paul Rejczak
Stock Trading Strategist
Stock Trading Alerts
